4656
The Signal Intensity of Anterior and Posterior Lobe of Pituitary and Thyroid Gland in Preterm and Term Infants1Department of Diagnostic Imaging and Nuclear Medicine, Kyoto University Graduate School of Medicine, Kyoto, Japan, 2Human Brain Research Center, Kyoto University Graduate School of Medicine, Kyoto, Japan
Synopsis
We have evaluated the signal and the volume of anterior pituitary, posterior pituitary and thyroid gland in preterm and term infants on MRI by using 3D T1-PETRA sequence. Our study showed that the intensity of anterior pituitary was positively correlated with gestational age (GA), negatively correlated with chronological age (CA). We showed the intensity of posterior pituitary was also positively correlated with GA, negatively correlated with CA. We also demonstrated that the intensity of thyroid was positively correlated with GA, negatively correlated with CA. Our results may have relation to the maturity of hypothalamic-pituitary-thyroid (HPT) axis.
Introduction
Hypothyroidism is common in preterm infants. Postulated causes include immaturity of the hypothalamic pituitary thyroid (HPT) axis [1]. The evaluation of thyroid function is important for neonates and infants because thyroid hormones play a critical role in central nervous system development and function [1,7]. However, the intensity and the volume of thyroid gland on MRI have not been evaluated well.The anterior lobe of pituitary gland in the term infant is known to be hyperintense on T1-weighted MR images. This is explained to be associated with a high amount of endoplasmic reticulum and high protein synthetic activity [2,3,4]. In previous reports, the signal of anterior pituitary is negatively correlated with chronological age (CA) [3,4,5] However, the signal of pituitary posterior has not been evaluated.
We hypothesized the intensity and the volume of pituitary and thyroid of neonates may reflect the status of HPT axis. The purpose of this study is to investigate whether intensity and volume of anterior pituitary (AP), posterior pituitary (PP) and thyroid on MRI correlate with gestational age (GA), chronological age (CA), and other clinical information.
Methods
- Subjects
This prospective study was performed in 102 neonates and infants (gestational age [GA], 164-290 days (23–41 weeks); chronological age [CA], 6–134 days) without severe intracranial abnormalities. Preterm infants underwent MR imaging at term equivalent age. Term infants underwent MR imaging when intracranial abnormalities were suspected. - Image Acquisition
Subjects underwent MR imaging at 3T MR scanners (MAGNETOM Skyra, Siemens Healthineers, Erlangen, Germany) with a 32-channel head coil. Whole brain quiet 3D T1-weighted imaging was performed by using Pointwise Encoding Time Reduction with Radial Acquisition (PETRA) sequence which completely covered thyroid gland. The central part of k-space was acquired with pointwise encoding after the first inversion pulse, whereas the outer edge of volumetric k-space was acquired by using radial projections after the second and later inversion pulses [6]. The imaging protocols of 3D-T1-PETRA (MPRAGE equivalent) was as follows: TR1/TR2/TE, 4.0/2400/0.07 ms; TI1/ TI2, 2000/800 ms; matrix, 256 × 256; field of view, 230 × 230 mm; flip angle, 6.0°; slice thickness, 0.9 mm (0.9 mm isotropic voxel); 256 slices; bandwidth, 383 Hz/Px; acquisition time, 3 min 29 s. - Post-imaging
Procedure
We manually placed volume of interest (VOI) of AP, PP and thyroid by using ITK-SNAP (www.itksnap.org), and the mean intensity and the volume were measured. The signal intensities of AP, PP, and thyroid were evaluated using the signal of pons and cord as follows: AP/pons, PP/pons, and Thyroid/cord, respectively. And their correlations with GA, CA and other clinical information were assessed. Additionally, we evaluated whether Thyroid/cord and the volume of thyroid were correlated with thyroid function (level of TSH in the blood). - Data
Analysis
All statistical data were analyzed using a software package (JMP Pro 14.0, SAS Institute Inc.)
Results
Representative images of anterior/posterior pituitary were shown in Figure 1. AP/pons was correlated with its volume (R2 = 0.27, the graph is not shown).Representative image of thyroid gland was shown in Figure 2. Thyroid/cord was slightly correlated with its volume (R2 = 0.09, the graph is not shown).
AP/pons and PP/pons were significantly positively correlated with GA (R2 = 0.40, 0.35). (Figure 3)
AP/pons and PP/pons were significantly negatively correlated with CA (R2 = 0.69, 0.61). (Figure 4)
Thyroid/cord was mildly positively correlated with GA (R2 = 0.18) and negatively correlated with CA(R2=0.27). The volume of thyroid was positively correlated with GA (R2 = 0.22). (Figure 5)
The intensity and the volume of thyroid both were somewhat correlated with thyroid function. The higher the level of TSH was, Thyroid/cord became the lower and the volume became the smaller (the data is not shown).
Discussion and Conclusion
The signal and the volume of AP, PP and thyroid in preterm and term infants have not been intensively evaluated on MRI. Our study showed that AP/pons was positively correlated with GA and negatively correlated with CA as previous reports [3,4,5]. We also showed PP/pons was also positively correlated with GA, negatively correlated with CA.The fetal hypothalamic-pituitary-thyroid (HPT) axis begins to function after the first trimester and completes at the term gestation. Immaturity of HPT axis is one of the causes of hypothyroidism in preterm infants [1,7]. Our study demonstrated that Thyroid/cord and the volume of thyroid were positively correlated with GA and both were correlated with thyroid function. Lower intensity and smaller volume of thyroid at term equivalent age may have relation to the risk of immaturity of thyroid, however, further studies are required.
Acknowledgements
We are grateful to Yuta Urushibata, Siemens Healthcare Japan K. K. for his help in protocol optimization.References
- Delbert A. Fisher, MD. Thyroid System Immaturities in Very Low Birth Weight Premature Infants. Semin Perinatol. 2008;32:387-397
- Cox TD, Elster AD. Normal pituitary gland: changes in shape, size, and signal intensity during the 1st year of life at MR imaging. Radiology. 1991;179:721–4.
- Takashi Okazaki, Tetsu Niwa, Keiji Suzuki, Shuhei Shibukawa, Yutaka Imai. Age related signal changes of the pituitary stalk on thin-slice magnetic resonance imaging in infants. Brain & Development. 2019;41:327–333
- E. Kitamura, Y. Miki, M. Kawai, H. Itoh, S. Yura, N. Mori, K. Sugimura, K. Togashi. T1 Signal Intensity and Height of the Anterior Pituitary in Neonates: Correlation with Postnatal Time. AJNR Am J Neuroradiol. 2008;29:1257– 60
- Saeka Hori, Toshiaki Taoka, Tomoko Ochi, Toshiteru Miyasaka, Masahiko Sakamoto, Katsutoshi Takayama, Takeshi Wada, Kaoru Myochin, Yukihiro Takahashi, and Kimihiko Kichikawa. Structures Showing Negative Correlations of Signal Intensity with Postnatal Age on T1-weighted Imaging of the Brain of Newborns and Infants. Magn Reson Med Sci. 2017;16;325–331
- N. Aida, T. Niwa, Y. Fujii, K. Nozawa, M. Enokizono, K. Murata, and T. Obata. Quiet T1-Weighted Pointwise Encoding Time Reduction with Radial Acquisition for Assessing Myelination in the Pediatric Brain. AJNR Am J Neuroradiol. 2016; 37(8):1528-34
- Ji Hoon Lee, Sung Woo Kim, Ga Won Jeon, Jong Beom Sin. Thyroid dysfunction in very low birth weight preterm infants. Korean J Pediatr. 2015;58(6):224-229
Figures
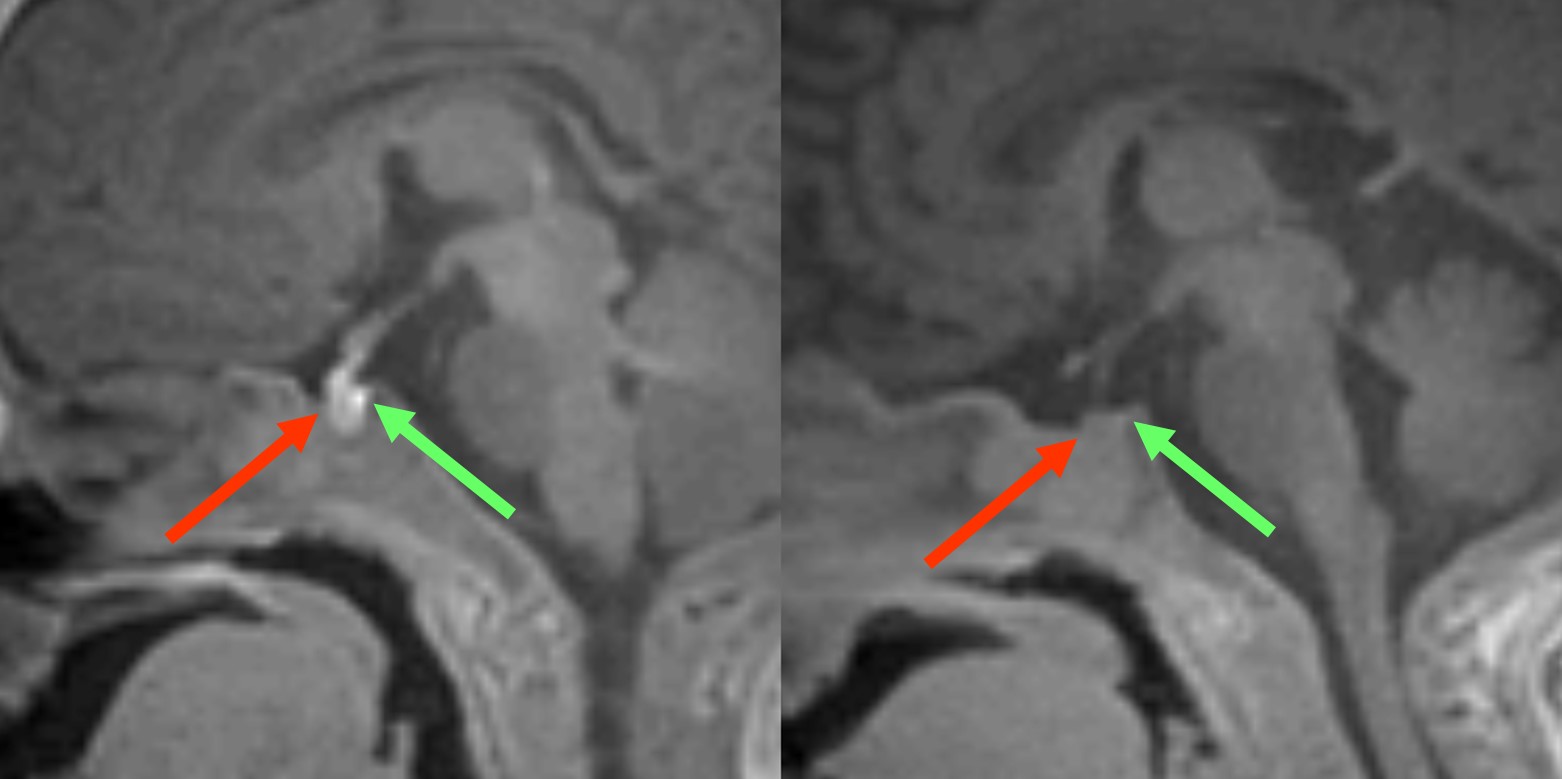
Figure 1.
Representative image of anterior/posterior pituitary image. Red arrow indicates anterior pituitary. Green arrow indicates posterior pituitary. The left image is a term infant (gestational age of 282 days and chronological age of 10 days). Both anterior and posterior pituitary show high signal intensity and its volume is relatively large. The right image is a preterm infant (gestational age of 180 days and chronological age of 110 days). Both anterior and posterior pituitary show low signal intensity and its volume is relatively small.
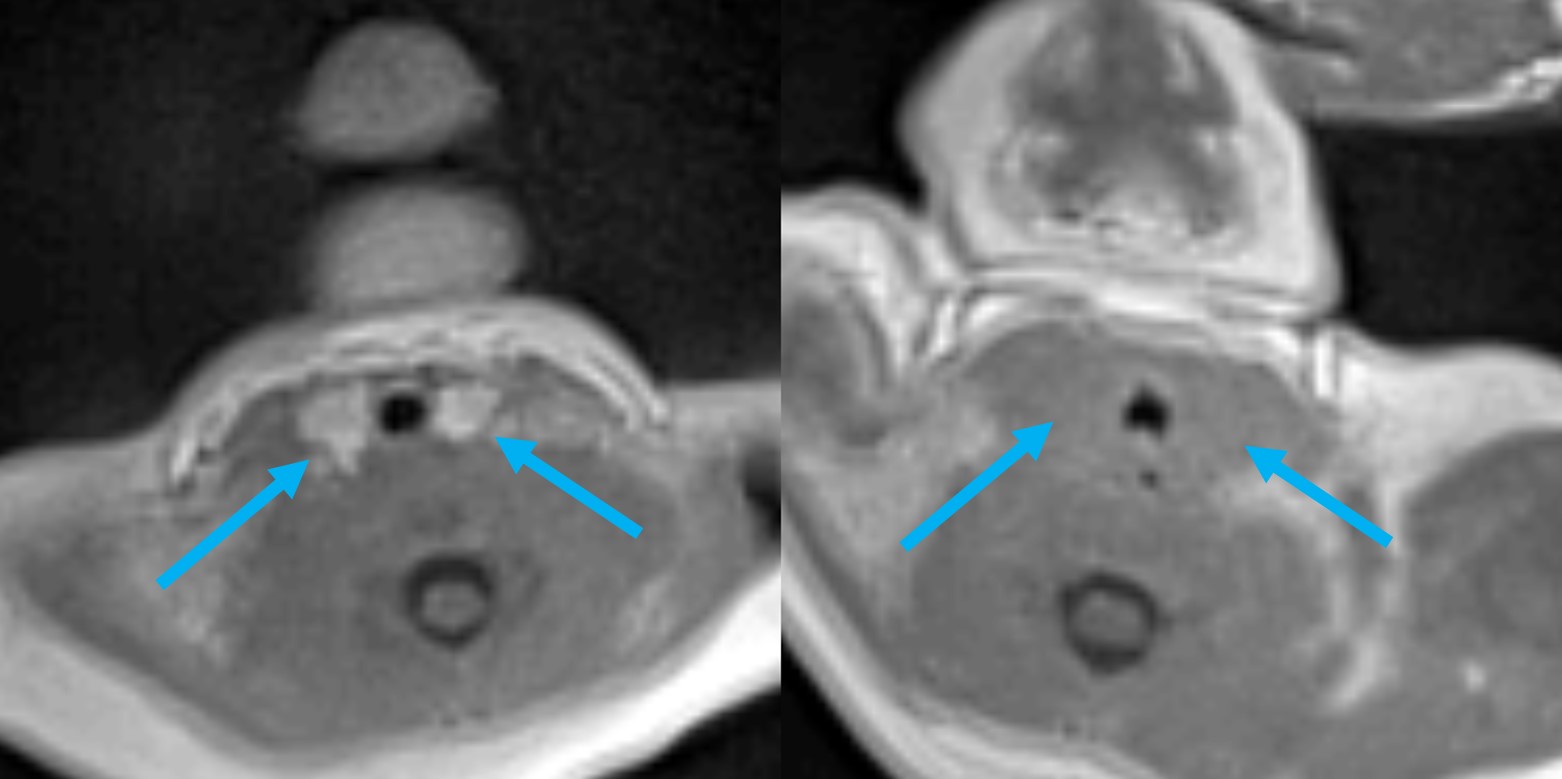
Figure 2.
Representative image of thyroid image. Blue arrow indicates thyroid gland. The left image is a term infant (gestational age of 282 days and chronological age of 10 days). The thyroid gland shows high signal intensity. The right image is a preterm infant (gestational age of 180 days and chronological age of 110 days). The thyroid gland shows low signal intensity.
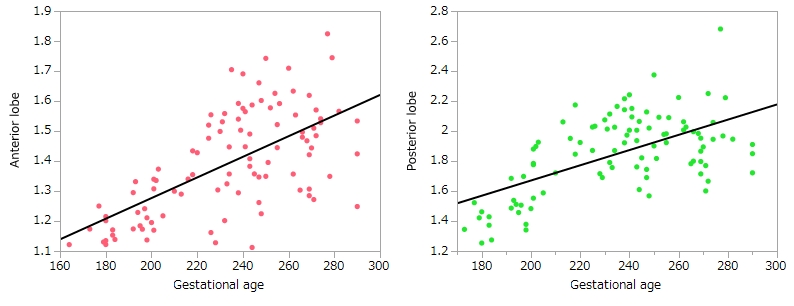
Figure 3.
Scattered plots show the relationship of AP/pons and gestational age [days], that of PP/pons and gestational age [days]. AP/pons and PP/pons were significantly positively correlated with GA (R2 = 0.40, 0.35).
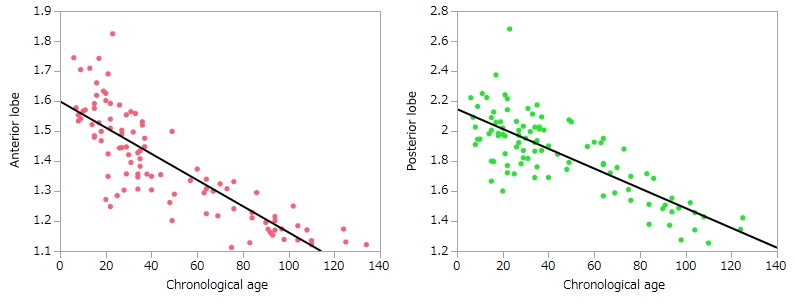
Figure 4.
Scattered plots show the relationship of AP/pons and chronological age [days], that of PP/pons and chronological age [days]. AP/pons and PP/pons were significantly negatively correlated with CA (R2 = 0.69, 0.61).
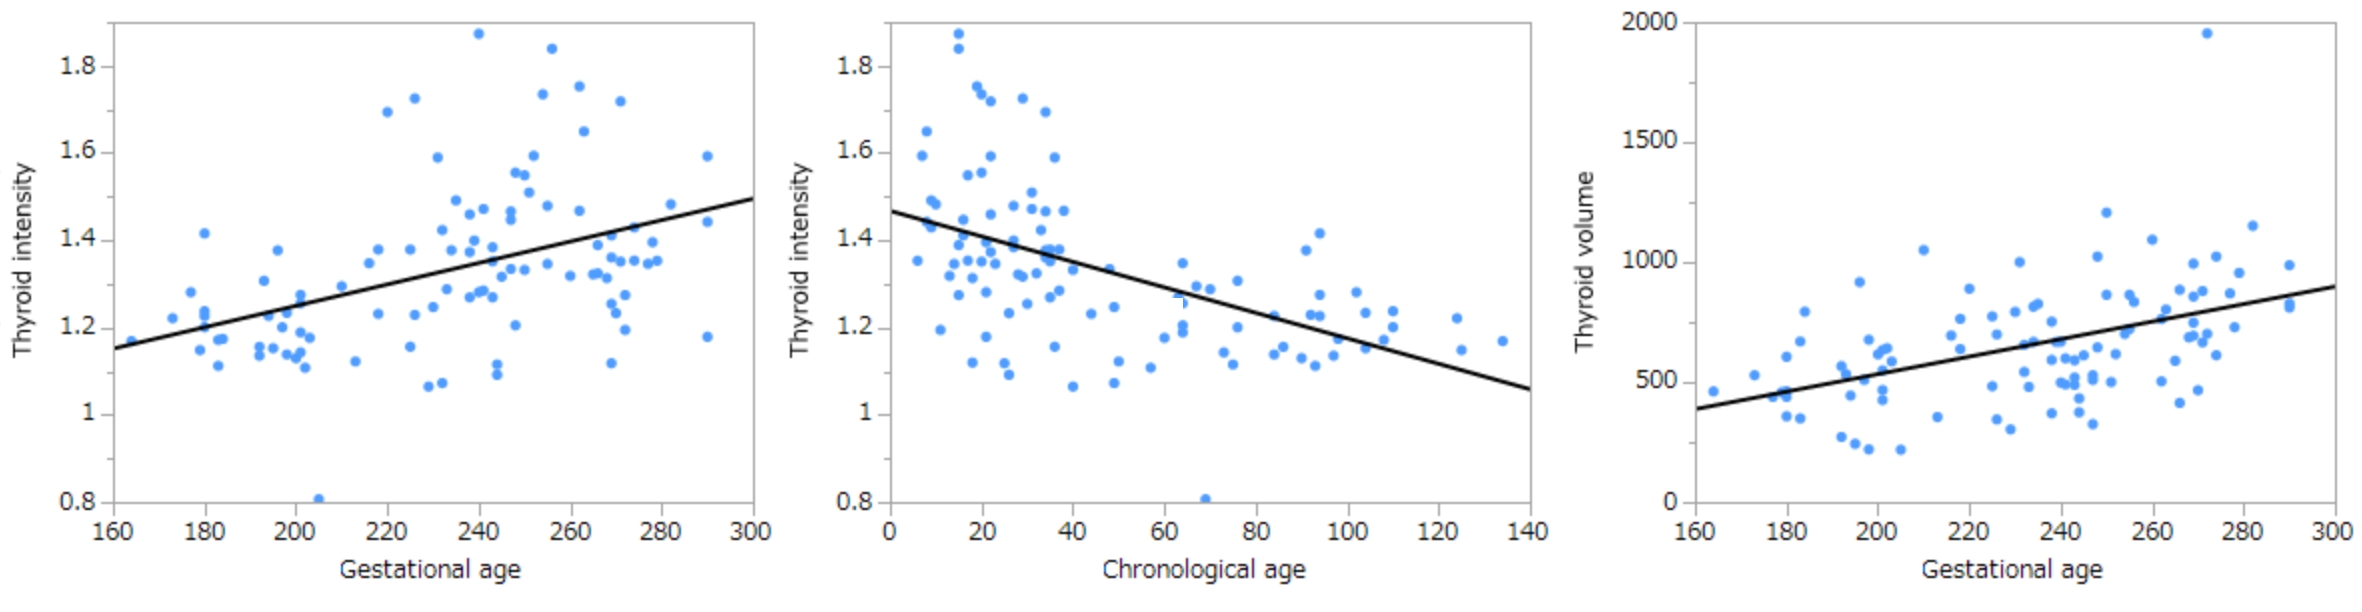
Figure 5.
Scattered plots show the relationship of Thyroid/cord and gestational age [days], that of Thyroid/cord and chronological age [days], that of thyroid volume [mm3] and gestational age [days]. Thyroid/cord was mildly positively correlated with GA (R2 = 0.18) and negatively correlated with CA (R2 = 0.27). The volume of thyroid was mildly positively correlated with GA (R2 = 0.22).