4654
Characterization of cortical abnormalities in adolescents with first-episode drug-naïve major depressive disorder1Huaxi MR Research Center (HMRRC), Functional and molecular imaging Key Laboratory of Sichuan Province, Department of Radiology, West China Hospital, Sichuan University, Chengdu 610041, China, Chengdu, China, 2Department of Radiology, the third hospital of Mianyang, Mianyang, China, Mianyang, China, 3Department of Psychiatry, the third hospital of Mianyang, Mianyang, China, Mianyang, China
Synopsis
The detailed information about neuroanatomical alterations in adolescents with first-episode drug-naïve major depressive disorder (MDD) is still unknown. We measured cortical thickness, surface area and volume in 35 MDD patients and 22 healthy controls (HC). The MDD group, compared to HCs, showed reduction in cortical volume of the right precentral gyrus. We also found that MDD severity significantly correlated with cortical abnormalities in a number of regions, primarily in frontal and parietal lobes. These regions are implicated in emotion processing whose abnormities will contribute to the affective and cognitive dysfunction in adolescents with MDD.
Purpose
Previous neuroimaging studies have suggested that major depressive disorder (MDD) in adolescents may be correlated with functional and structure difference1, 2. However, few studies have explored the cortical abnormalities that are more accessible than measures of neural function. Herein, we aimed to investigate the anatomical differences in cortical morphometry between adolescents with first-episode drug-naïve MDD and healthy controls(HC)using 3D T1-weighted imaging and to explore correlations between age, MDD symptoms and cortical abnormalities.Methods
The study was approved by the local ethical committee and written informed consent was obtained from all subjects. A total of 35 first-episode drug-naive adolescent (age 13-18) with MDD who met DSM-Ⅳ criteria and 22 age, gender and handedness well matched healthy controls were recruited. Illness severity was assessed using the 14-item Hamilton Anxiety Scale (HAMA), the 17-item Hamilton Depression Scale (HAMD) and the Pittsburgh Sleep Quality Index (PSQI). High-resolution T1-weighted images of all the participants were acquired via a Siemens 3.0 T scanner. Brain cortical thickness, surface area and volume were measured by FreeSurfer 6.03, 4(http://surfer.nmr.mgh.harvard.edu/). Differences between MDD and HC groups in cortical thickness, surface area and volume difference (age, sex, ICV controlled) were compared within Qdec 1.5, followed by correlational analyses between cortical variables and HAMD, HAMA and PSQI scores (age, sex, ICV controlled) in MDD patients. Monte Carlo simulation was used to correct for multiple comparisons using a threshold of p <0.05. A partial correlation analysis (sex, ICV controlled) was performed to examine the effect of age on abnormal cortical regions for each group respectively. Pearson’s partial correlation analyses (age, sex, ICV controlled) were performed to identify relationships between HAMD, HAMA, PSQI scores and abnormal cortical regions in patients with MDD.RESULTS
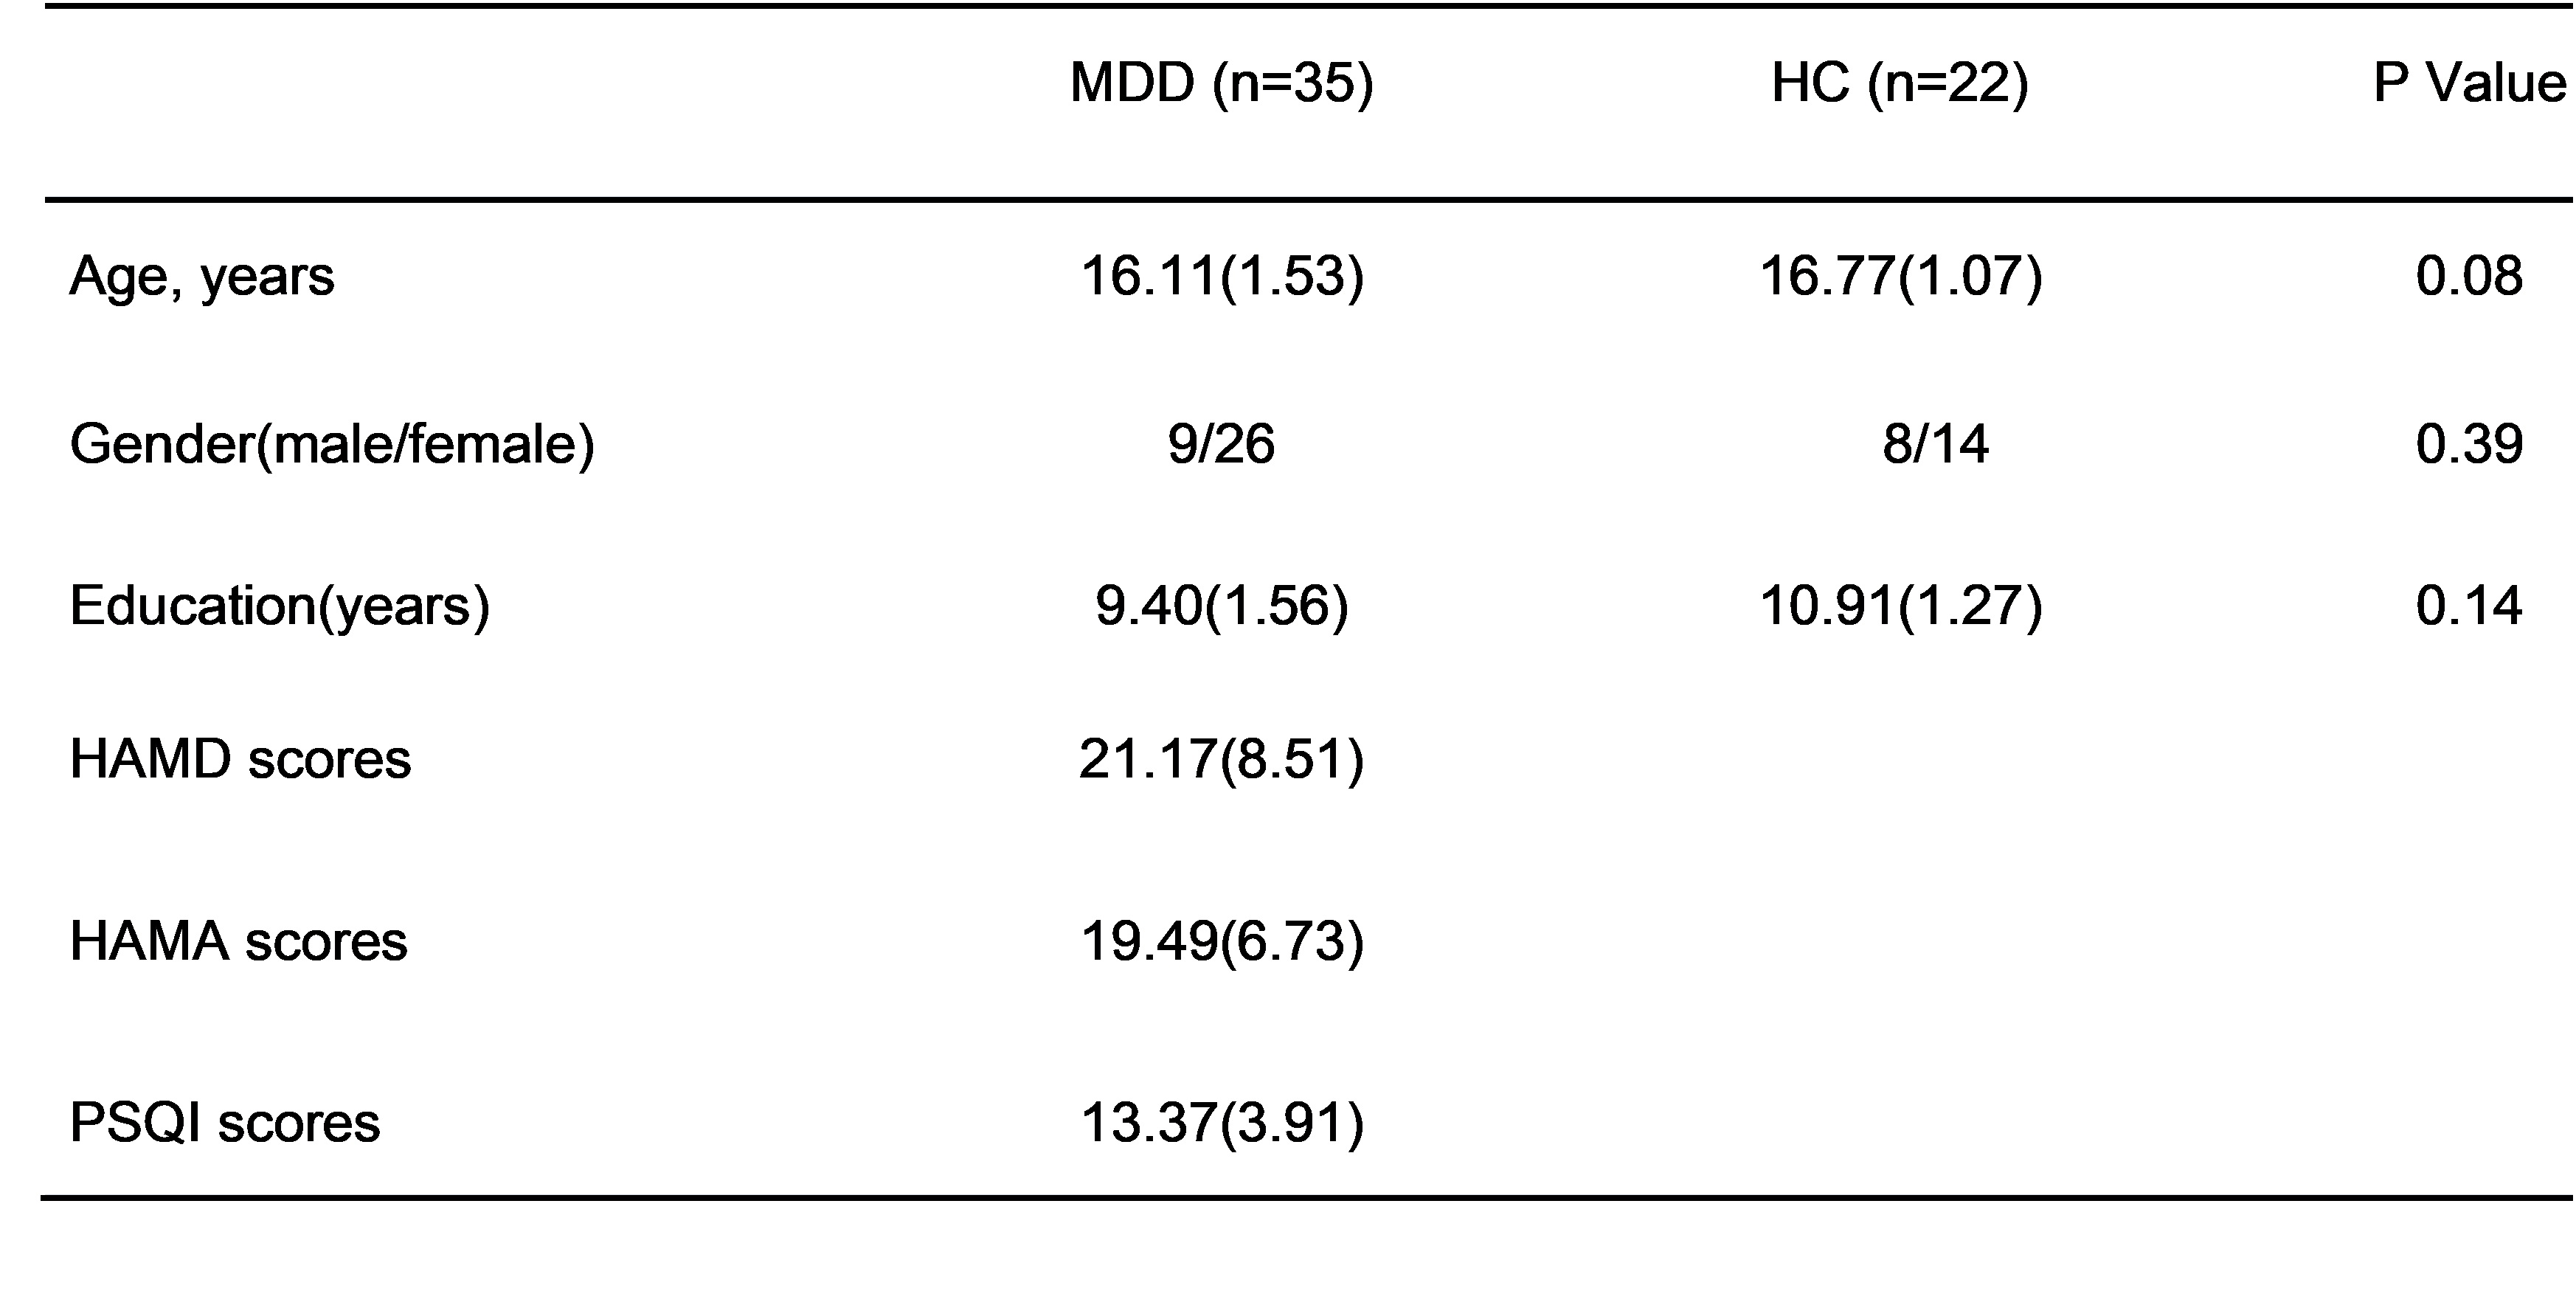
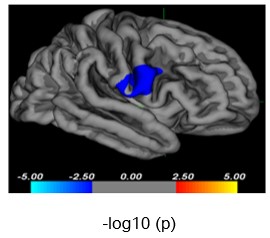
Demographic and clinical characteristics for all subjects are summarized in Table 1.1. Cortical comparisons between MDD and HC groups: Compared with HC, adolescents with MDD showed reduction in cortical volume in the right precentral gyrus (cluster level: x=58.7, y=6.5, z=18.2, vertex=19, cluster size= 979.27mm2, -log10(p)= -2.04, Monte Carlo-corrected, Fig 1). There were no significant differences in cortical thickness and surface area between the MDD and HC groups.
2. Correlations between HAMD, HAMA, PSQI scores and age and the right precentral gyrus: In the right precentral gyrus, a negative correlation was identified between age and cortical volume in MDD group(r = -0.205, p =0.252, Fig 2); whereas in HC, a significant negative correlation was observed (r = -0.579, p =0.007, Fig 2). Moreover, there was a significant negative correlation between HAMD scores and mean volume of the right precentral gyrus (r = -0.429, p =0.014).
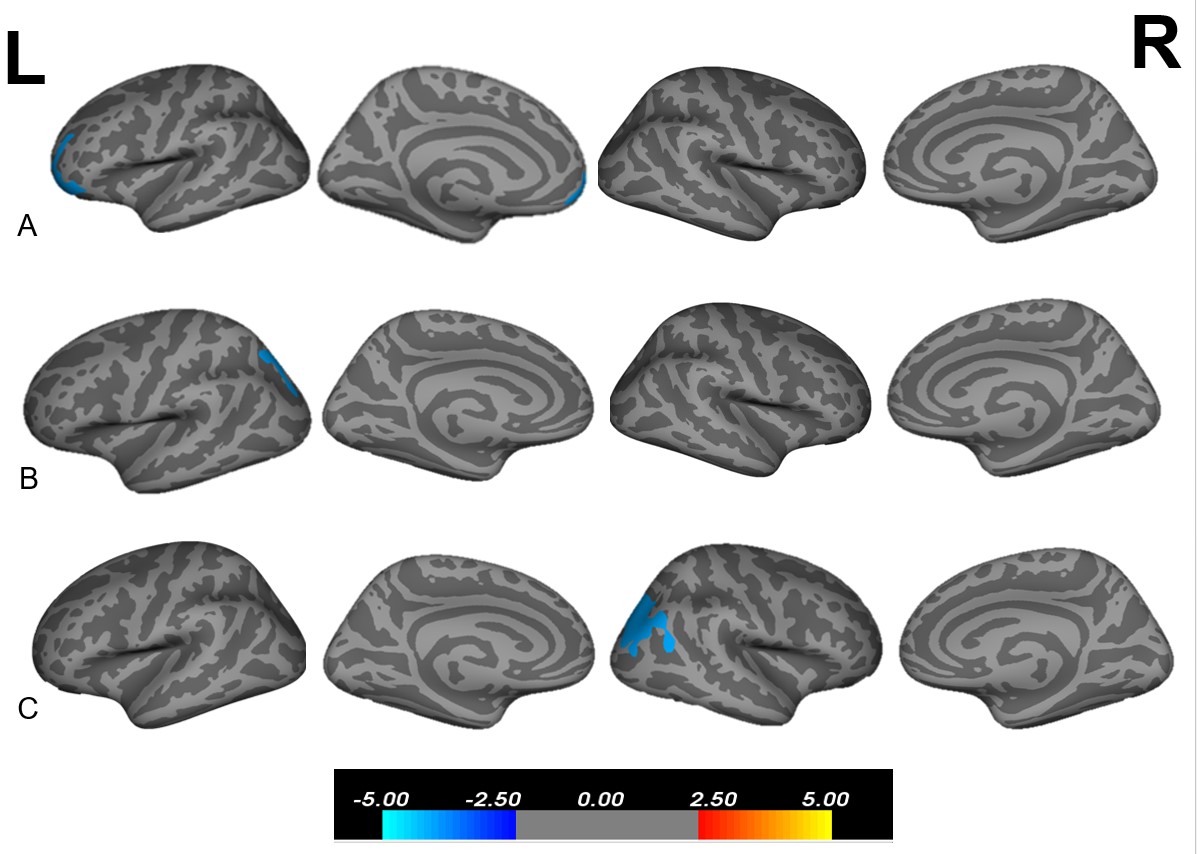
3. Correlations between HAMD scores and cortical measurements: There was one cluster in rostral middle frontal region showed significant negative association between cortical volume and HAMD scores (cluster level: x=-40.5, y=45.0, z=-11.0, vertex=30870, cluster size= 1695.25mm2, log10(p)= -4.00, Fig 3A) in the MDD group.
4.Correlations between HAMA scores and cortical measurements: One cluster in the superiorparietal region of the LH showed significant negative correlation between cortical thickness and HAMA scores (cluster level: x=-14.9, y=78.4, z=34.0, vertex=122292, cluster size= 2017.33mm2, log10(p)= -4.00, Fig 3B) in the MDD group.
5. Correlations between PSQI scores and cortical measurements: One cluster in the inferiorparietal region of the right hemisphere (RH) showed significant negative correlations between surface area and PSQI scores (cluster level: x=26, y=-74.0, z=19.0, vertex=52078, cluster size= 2401.82mm2, log10(p)= -4.00, Fig 3C) in the MDD group.
Discussion & Conclusion
Our study characterize the cortical morphometry of first episode drug-naïve adolescents with MDD. Here, we showed the normal age-related cortical morphometric development was disrupted in adolescents with MDD. Moreover, the cortical volume reduction in the right precentral gyrus may associates with depression in adolescents with MDD as demonstrated by the association it has with HAMD scores. - Moreover, the cortical volume reduction in the right precentral gyrus may associates with depression in adolescents with MDD as demonstrated by the association it has with HAMD scores. Moreover, We also found that MDD severity (as measured by the HAMD, HAMA, PSQI) significantly negatively correlated with thickness, surface area and volume in a number of regions, primarily in frontal and parietal regions, whose abnormalities will contribute to the dysfunction of salience and executive-control networks in MDD.Acknowledgements
This study was supported by National Nature Science Foundation (Grant NO. 81671669), Science and Technology Project of Sichuan Province (Grant NO. 2017JQ0001)References
1.Liao Y, Huang X, Wu Q, et al. Is depression a disconnection syndrome? Meta-analysis of diffusion tensor imaging studies in patients with MDD. J Psychiatry Neurosci. 2013; 38(1):49–56.
2. Murrough JW, Abdallah CG, Anticevic A, et al. Reduced global functional connectivity of the medial prefrontal cortex in major depressive disorder. Hum Brain Mapp. 2016; 37(9):3214–3223.
3.Fischl B, Dale AM. Measuring the thickness of the human cerebral cortex from magnetic resonance images. Proc Natl Acad Sci U S A. 2000; 97(20):11050–11055.
4. Fischl B, Van Der Kouwe A, Destrieux C, et al. Automatically parcellating the human cerebral cortex [J]. Cerebral cortex, 2004, 14(1): 11-22.
5.Pan L A, Ramos L, Segreti A M, et al. Right superior temporal gyrus volume in adolescents with a history of suicide attempt [J]. The British Journal of Psychiatry, 2015, 206(4): 339-340.
Figures