4653
Brain region scaling differences between children and adults1Institute of Cognitive Neuroscience, East China Normal University, Shanghai, China, 2NYU-ECNU Institute of Brain and Cognitive Science, New York University Shanghai, Shanghai, China
Synopsis
Individual brain size can vary as much as 1.5-fold. Furthermore, brain regions might not expand linearly proportional relative to total brain size. Scaling is a measure of such expansion. However, only few studies have investigated the differences in scaling pattern between childhood and adulthood. Here we analyzed structural T1 weighted images from children and adults datasets. We found that nonlinear scaling regions are more widely distributed in adults than in children. Therefore, we propose that individual brain regional growth might be influenced by “initial” brain size.
Introduction
It was reported that areal scaling of different brain regions is not consistent1. Some regions exhibit greater than proportional expansion relative to total cortical size, whereas some regions exhibit lower than proportional expansion. However, age was regarded as a random effect variable, which may overlook systematic influences of age. The present study compared scaling patterns between children and adults to fill this gap.Methods
Structural T1 weighted images were collected from 91 children (aged 6-7) and 103 young adults (age range) using using a 3T Siemens PRISMA magnetic resonance scanner with a 64 channel RF head coil. Due to motion artifacts, 15 children were excluded; therefore, the final analysis included 76 children and 103 adults. All the scans were processed using Freesurfer2 software (“recon-all” pipeline) to reconstruct individual cortical surfaces. We conducted both parcellation-based3 and vertexwise-based group analysis. Reference map of areal scaling was generated by calculating log-log regression coefficient using the following model for each vertex (in vertexwise-based analysis) or brain region (in DKT atlas based analysis).Scaling calculation model:
$$log_{10}Y \sim \beta*log_{10}X$$
Here Y is the surrounding surface area of one vertex or the cortical surface area of some region, X is the surface area of the located brain hemisphere, and β is the scaling coefficient. A coefficient of 1 indicates linear scaling. A coefficient significantly larger than 1 indicates “positive” scaling. And a coefficient significantly less than 1 indicates “negative” scaling. Multiple comparison is corrected using false discovery rate, thresholded to 0.1.
Results
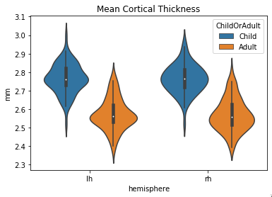
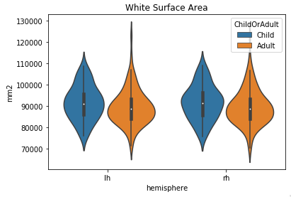
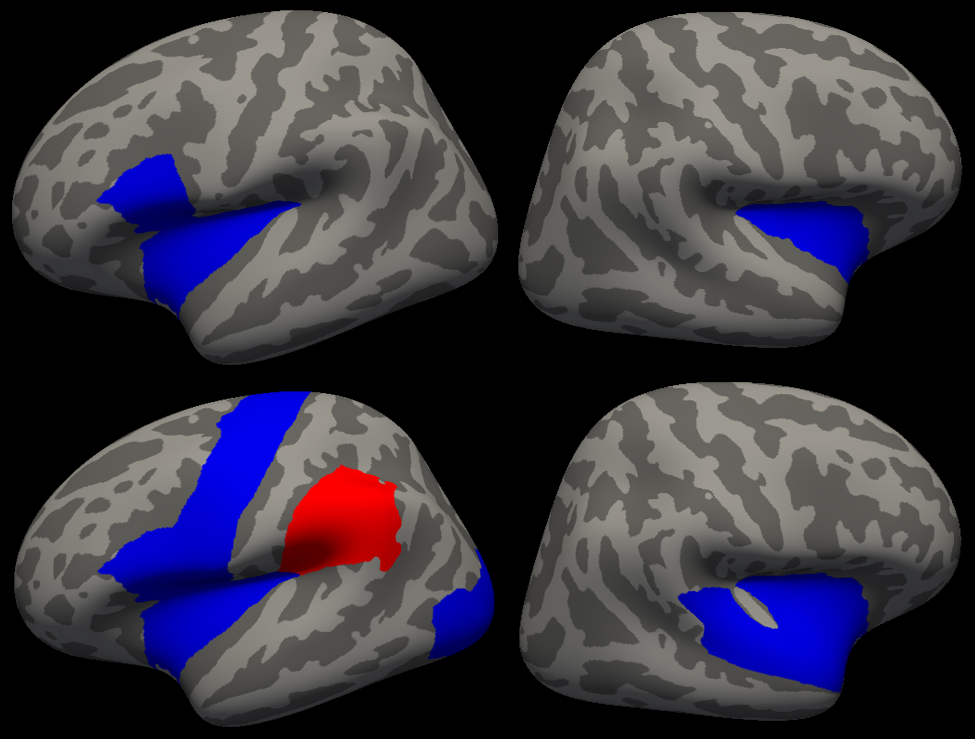
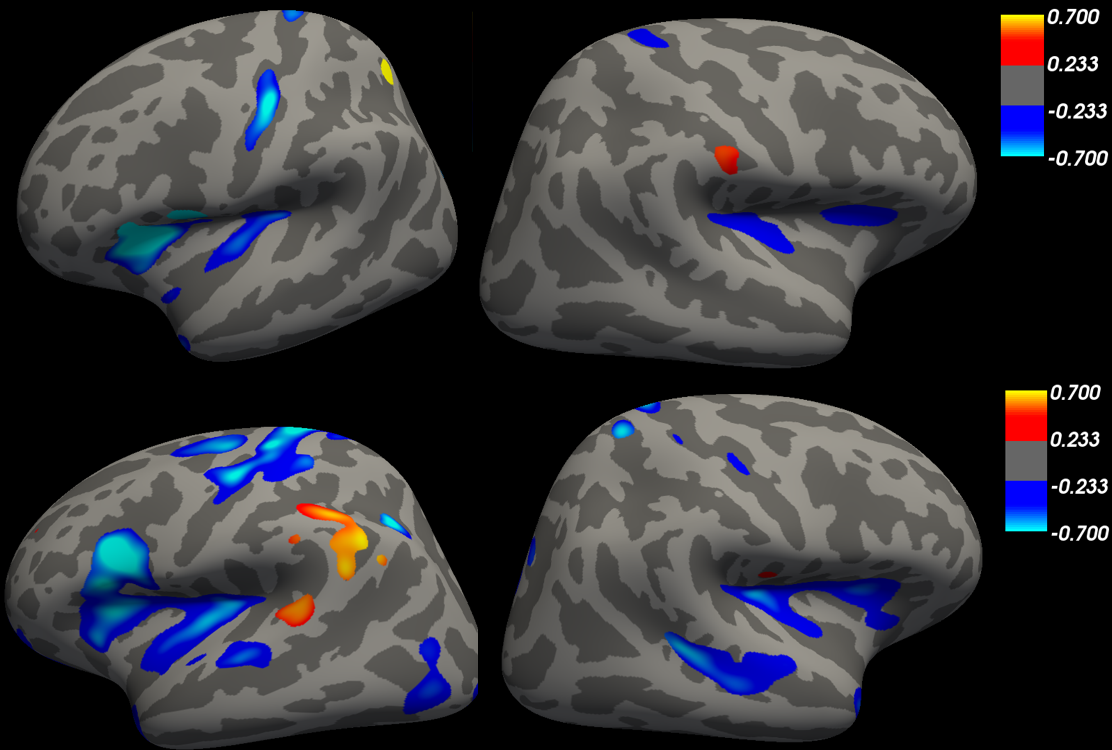
Cortical surface (grey matter) was significantly thicker in children than in adults (see Fig.1), whereas white surface area (boundary between grey and white matter) is almost identical between the two groups (see Fig.2). Nonlinear scaling areas were more widely distributed in adults than in children (see Fig.3 & Fig.4), which was observed using both group analysis methods (parcellation-based and vertexwise-based), verifying the reliability of both methods. Additionally, regions showing differences in scaling may be associated with individual difference in cognitive development.Discussion
Consistent with previous findings, we found that not all brain regions expand linearly proportional to total brain size. For example, bilateral insula regions show less than proportional expansion. In contrast to previous findings, however, we found fewer regions that show nonlinear scaling, which may be due to having a smaller sample size. Moreover, we found age group differences in scaling pattern. For example, supramarginal region shows significant positive scaling in adulthood but not in childhood. We suggest that individual brain regional growth is affected by “initial” brain size. That is, for regions that show significant positive scaling in adulthood but not in childhood, the bigger the brain is in childhood, the greater the proportion of growth.Conclusion
Studies4,5 have investigated developmental changes of cortical surface area and characterized regional trajectories at the group level. As far as we know, no study examined initial brain size as a variable to predict individual brain developmental changes. Here we found relative brain size at a certain age might affect individual brain development, which makes it possible to predict individual regional brain changes to a finer degree.Acknowledgements
This study was supported by National Natural Science Foundation of China (31771210), and Science and Technology Commission of Shanghai Municipality (17JC1404105).References
1. Reardon, P. K., Seidlitz, J., Vandekar, S., Liu, S., Patel, R., Park, M. T. M., ... & Giedd, J. N. (2018). Normative brain size variation and brain shape diversity in humans. Science, 360(6394), 1222-1227.
2. Fischl, B. (2012). FreeSurfer. Neuroimage, 62(2), 774-781.
3. Klein, A., & Tourville, J. (2012). 101 labeled brain images and a consistent human cortical labeling protocol. Frontiers in neuroscience, 6, 171.
4. Ducharme, S., Albaugh, M. D., Nguyen, T. V., Hudziak, J. J., Mateos-Pérez, J. M., Labbe, A., ... & Brain Development Cooperative Group. (2015). Trajectories of cortical surface area and cortical volume maturation in normal brain development. Data in brief, 5, 929-938.
5. Remer, J., Croteau-Chonka, E., Dean III, D. C., D’Arpino, S., Dirks, H., Whiley, D., & Deoni, S. C. (2017). Quantifying cortical development in typically developing toddlers and young children, 1–6 years of age. Neuroimage, 153, 246-261.
Figures