4652
Parcellation of the neonatal cortex using Surface-based Melbourne Children's Regional Infant Brain atlases (M-CRIB-S)1Developmental Imaging, Murdoch Childrens Research Institute, Parkville, Australia, 2Department of Medicine, Monash Unviersity, Melbourne, Australia, 3Murdoch Childrens Research Institute, Parkville, Australia, 4Royal Womens Hospital, Parkville, Australia, 5University of Melbourne, Parkville, Australia, 6Monash Unviersity, Clayton, Australia
Synopsis
Longitudinal studies measuring changes in cortical morphology over time are best facilitated by parcellation schemes compatible across all life stages. The Melbourne Children's Regional Infant Brain (M-CRIB) and M-CRIB 2.0 atlases provide voxel-based parcellations of the cerebral cortex compatible with the Desikan-Killiany (DK) and the Desikan-Killiany-Tourville (DKT) cortical labelling schemes.
The curvature template registration targets, average surfaces, labelling training data, and pipeline execution scripts are available at (https://www.github.com/DevelopmentalImagingMCRI/MCRIBS).
Introduction
Longitudinal studies measuring changes in cortical morphology over time are best facilitated by parcellation schemes compatible across all life stages. The Melbourne Children's Regional Infant Brain (M-CRIB) and M-CRIB 2.0 atlases provide voxel-based parcellations of the cerebral cortex compatible with the Desikan-Killiany (DK) and the Desikan-Killiany-Tourville (DKT) cortical labelling schemes. However, there is still a need for a surface-based approach for parcellating neonatal images using these atlases. We introduce surface-based versions of the M-CRIB and M-CRIB 2.0 atlases, termed M-CRIB-S(DK) and M-CRIB-S(DKT), with a pipeline for automated parcellation utilizing FreeSurfer (1) and developing Human Connectome Project (dHCP) (2, 3) tools.Methods
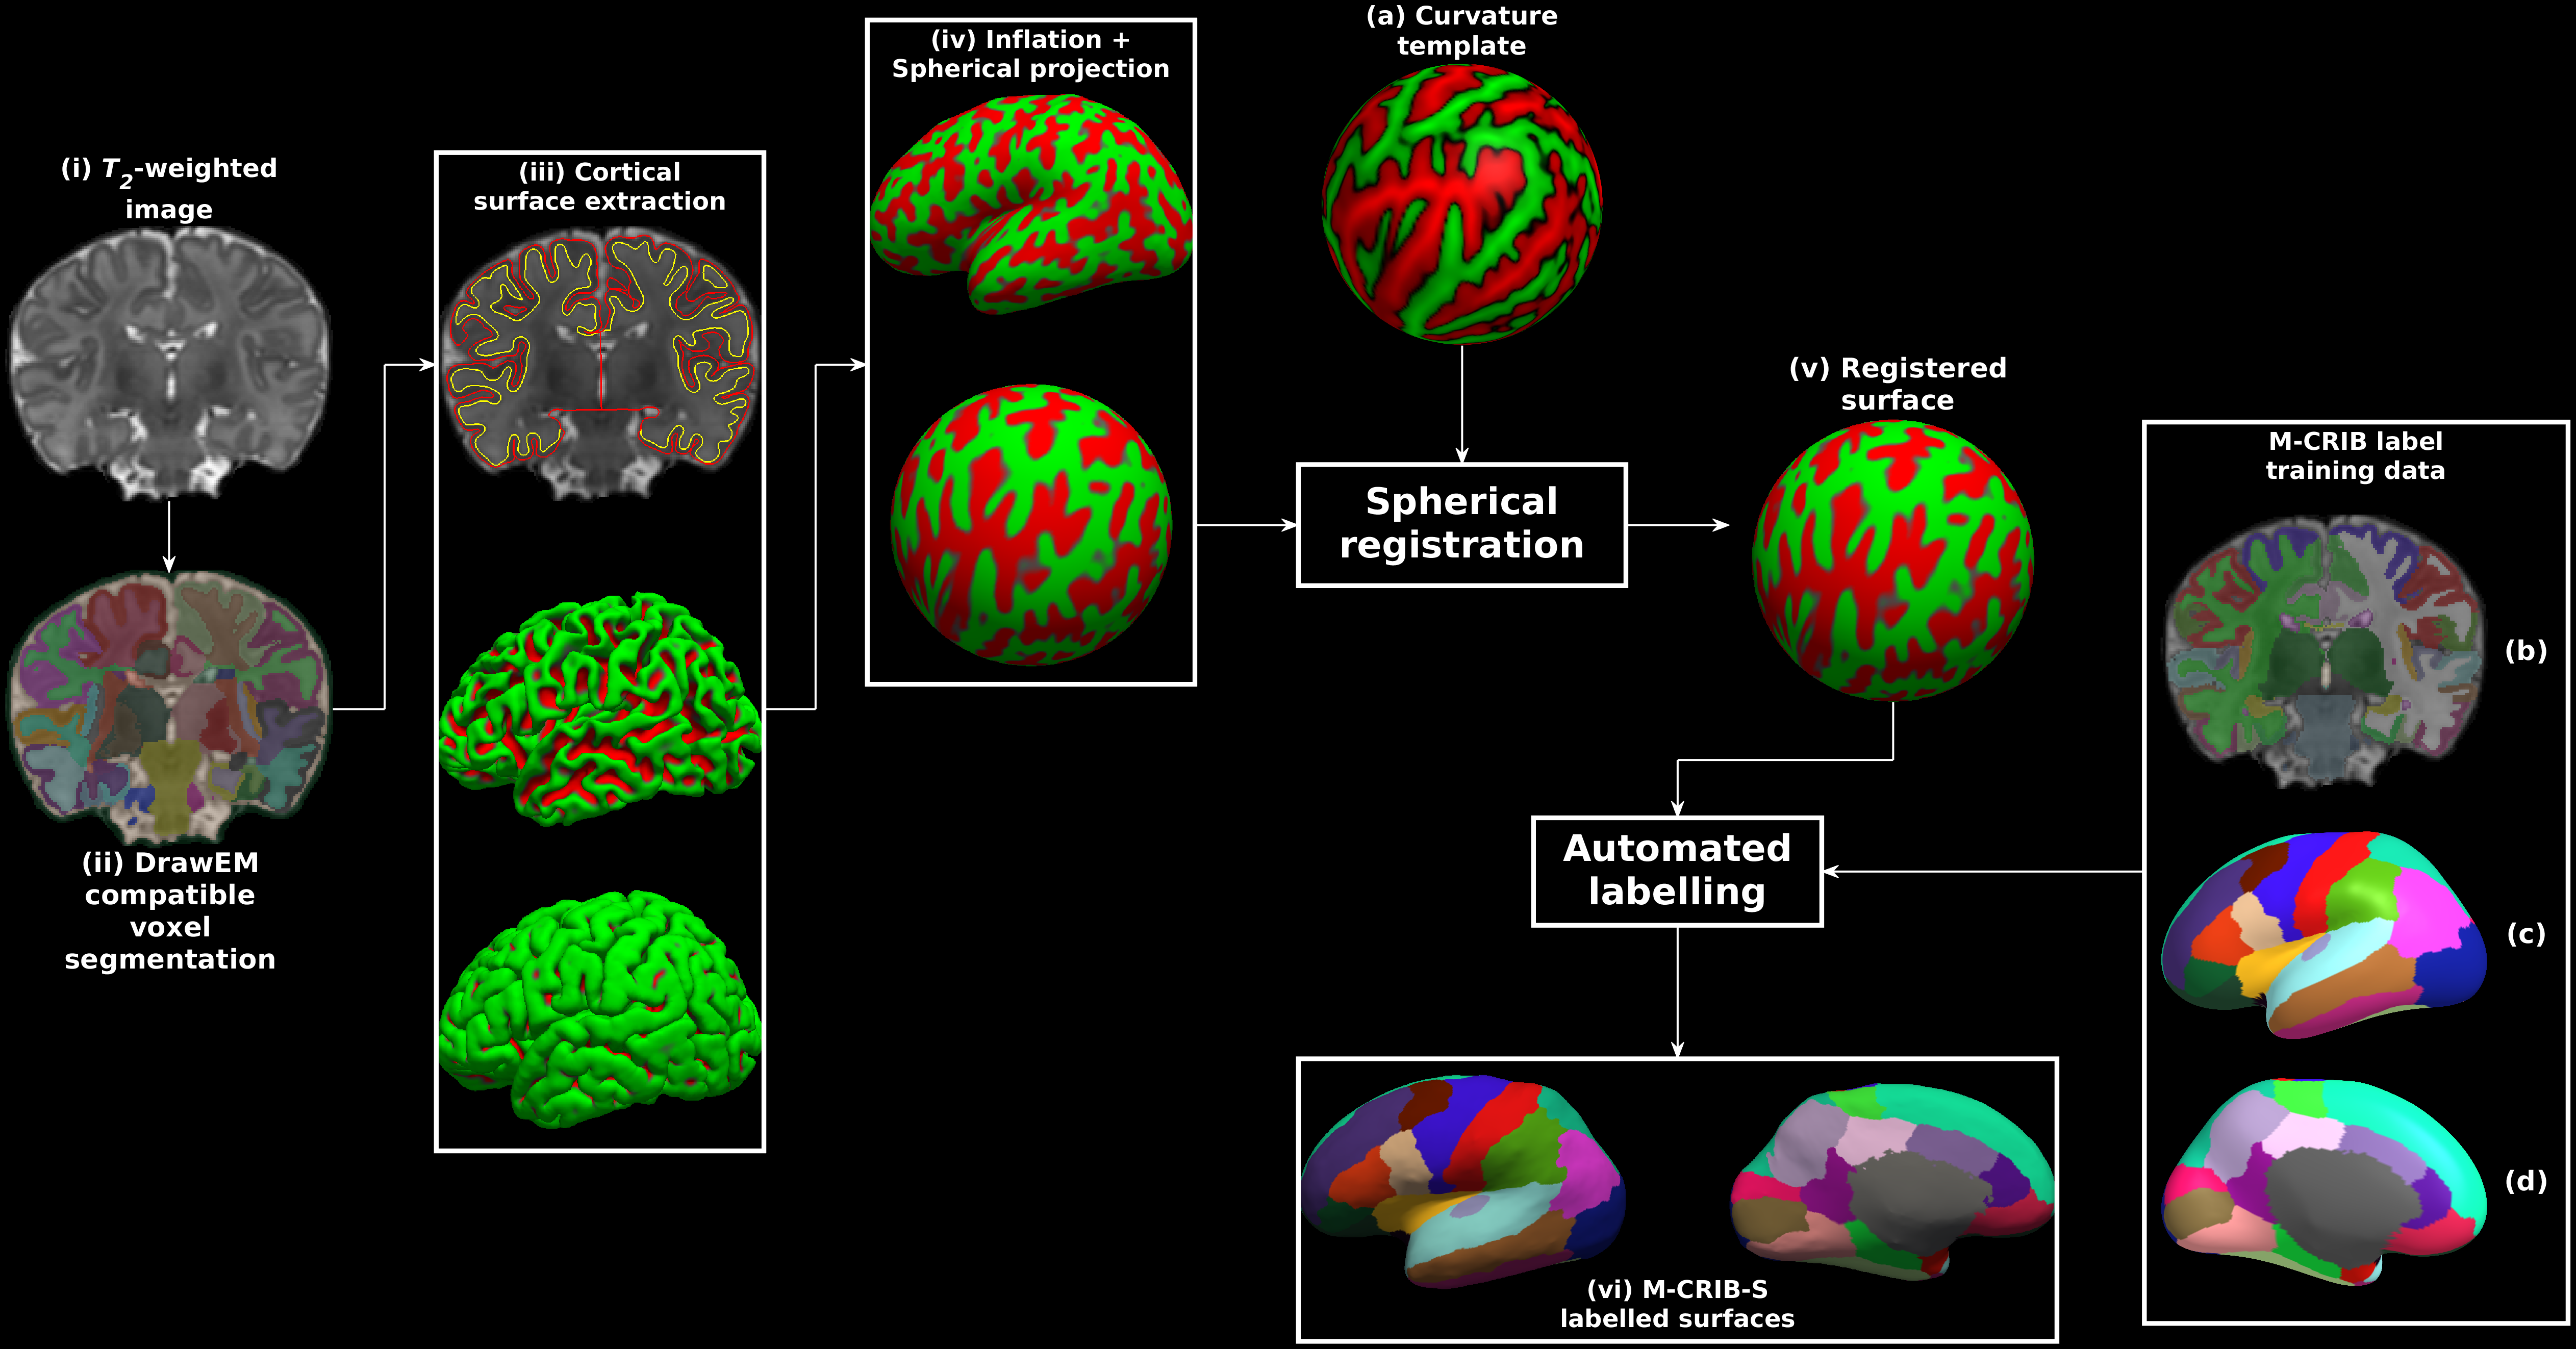
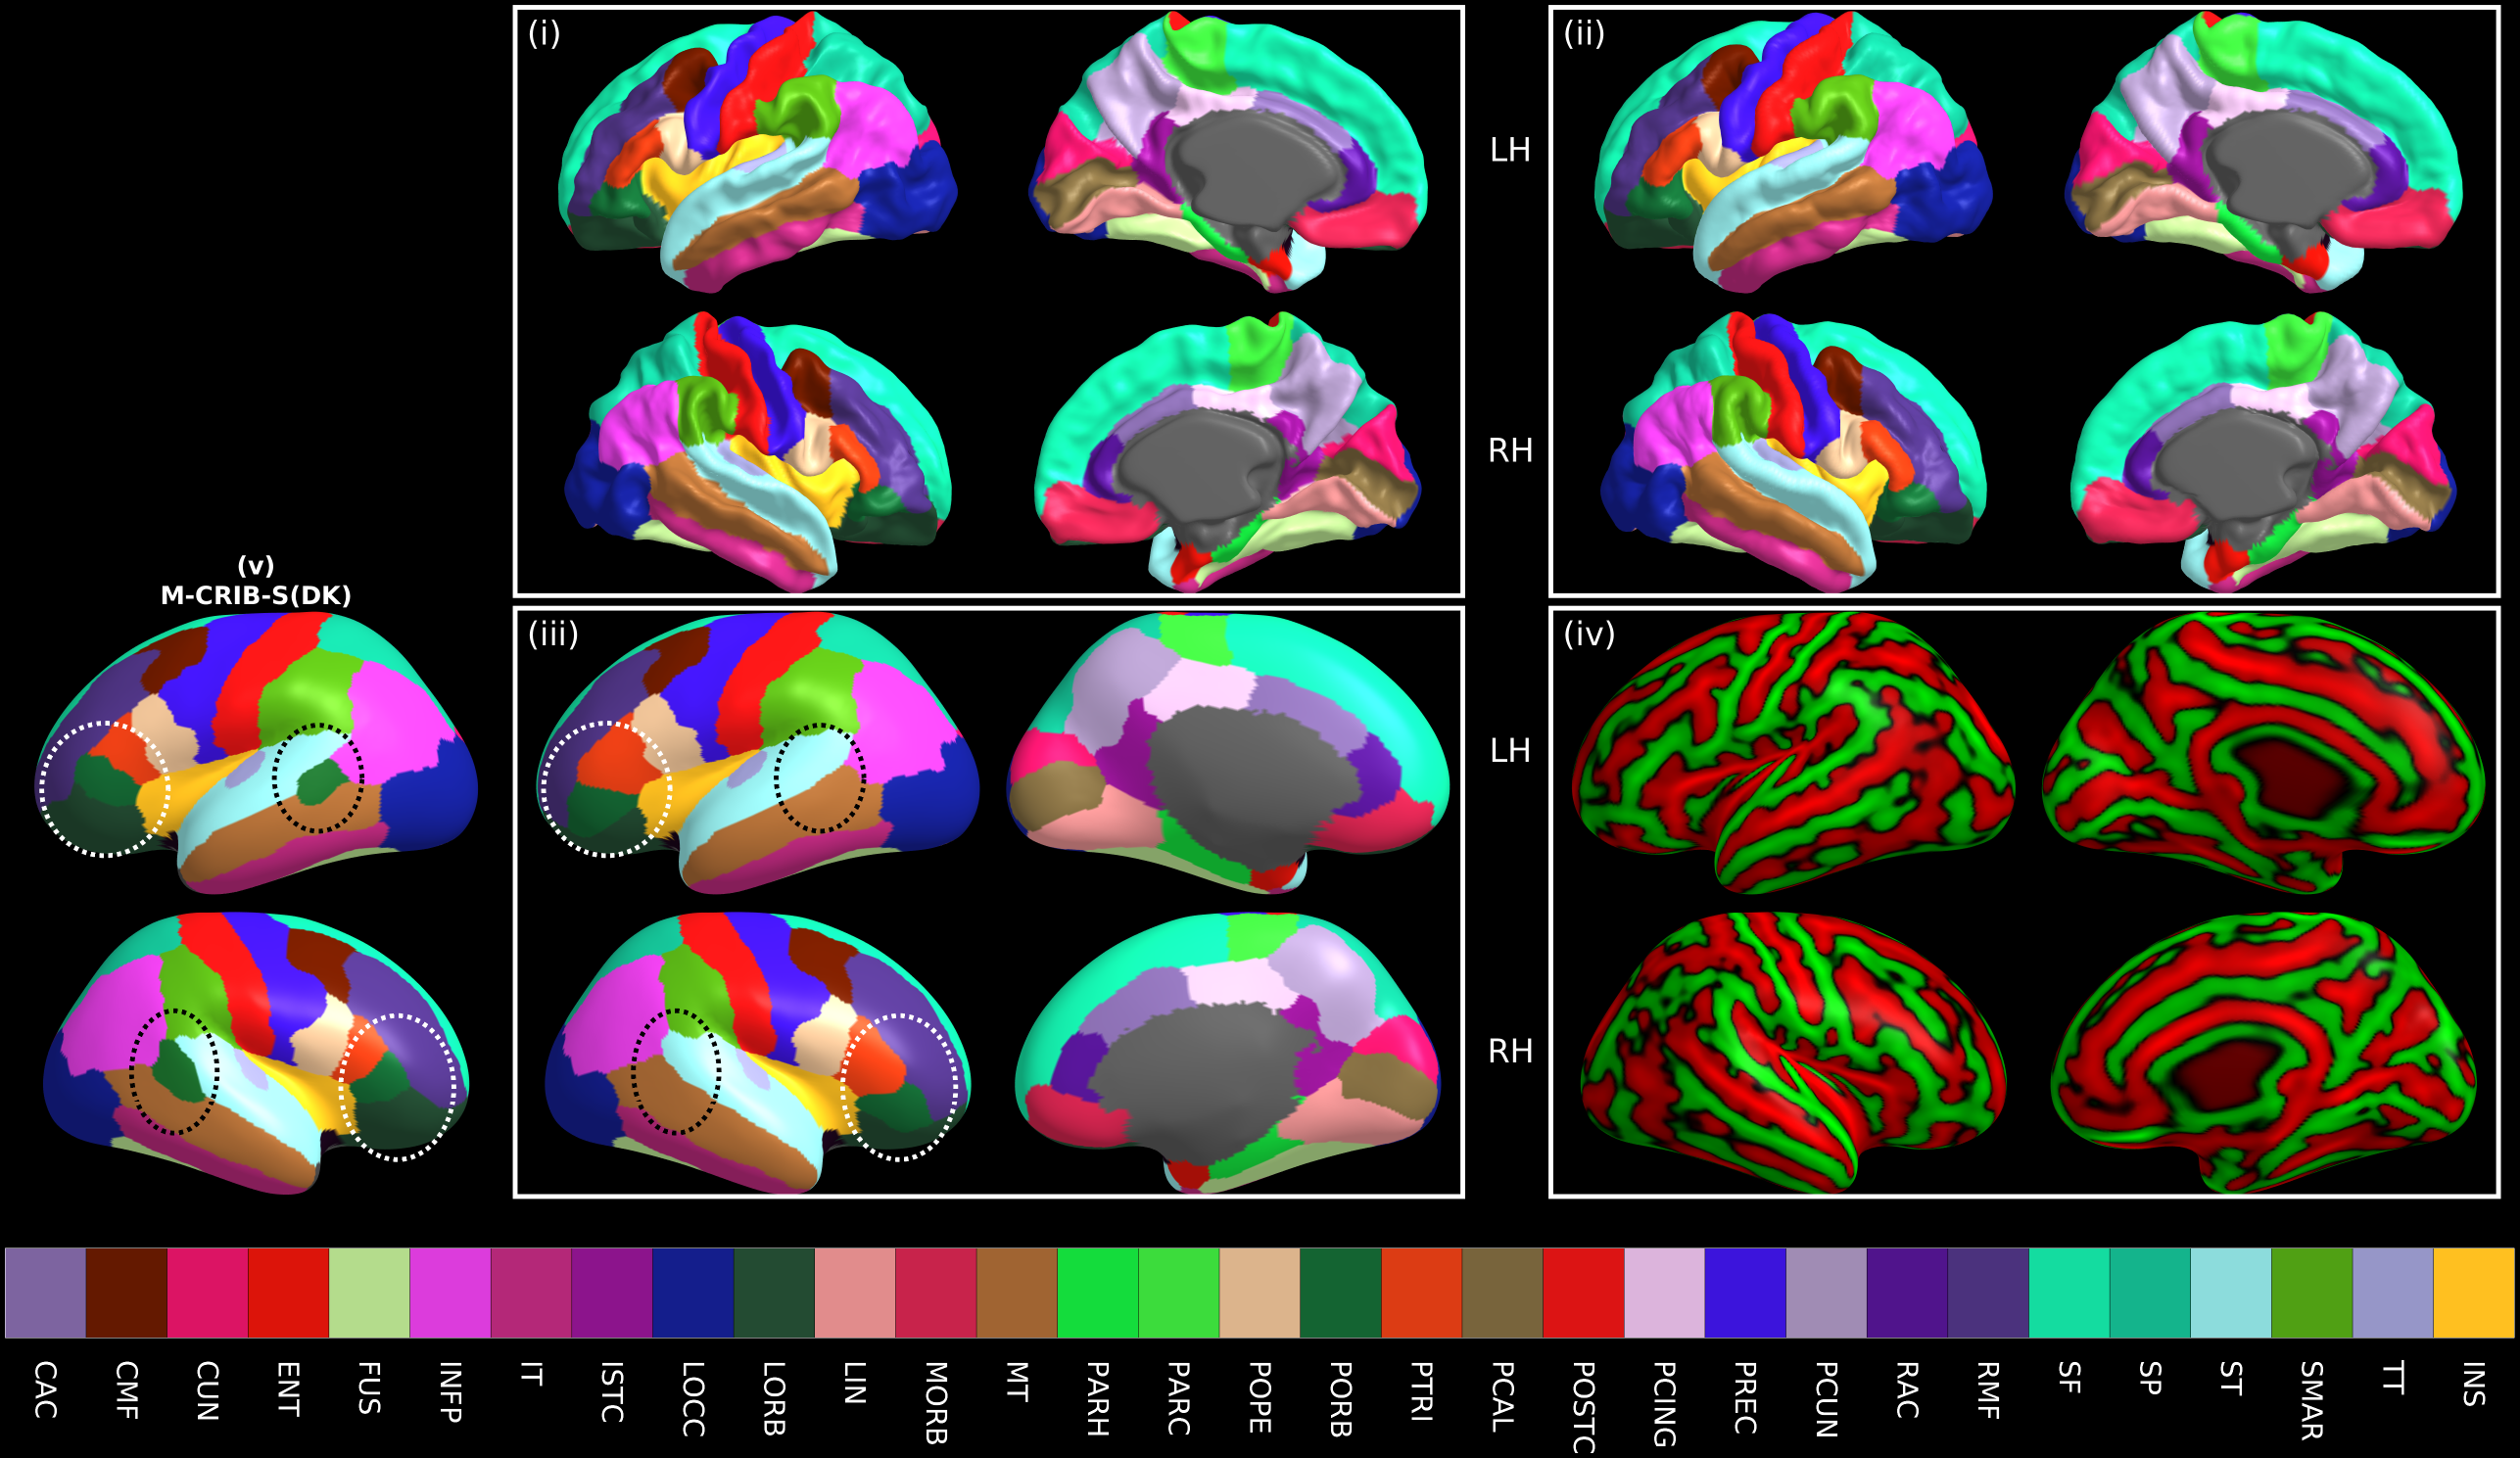
Longitudinal studies measuring changes in cortical morphology over time are best facilitated by parcellation schemes compatible across all life stages. The Melbourne Children's Regional Infant Brain (M-CRIB) and M-CRIB 2.0 atlases provide voxel-based parcellations of the cerebral cortex compatible with the Desikan-Killiany (DK) and the Desikan-Killiany-Tourville (DKT) cortical labelling schemes. However, there is still a need for a surface-based approach for parcellating neonatal images using these atlases. We introduce surface-based versions of the M-CRIB and M-CRIB 2.0 atlases, termed M-CRIB-S(DK) and M-CRIB-S(DKT), with a pipeline for automated parcellation utilizing FreeSurfer (1) and developing Human Connectome Project (dHCP) (2, 3) tools. Methods A total of 58 term-born (≥ 37 weeks’ gestation), healthy neonates (40.2 - 44.9 weeks post-menstrual age (PMA) at scan, M = 42.4, SD = 1.2, 26 female) were scanned as control subjects as part of preterm birth studies (4, 5). This cohort was subdivided into the following two subsets: labelled and unlabelled subsets. The labelled set comprised the ten subjects (40.29 – 43.00 weeks’ PMA at scan, M = 41.71, SD = 1.31, 4 female) of the M-CRIB atlas (6, 7). The unlabelled subset consisted of the remaining 48 subjects (40.2 – 44.9 weeks’ PMA at scan, M = 42.6, SD = 1.3, 22 female). . T2-weighted images were acquired with a turbo spin echo sequence (7, 8). The proposed processing pipeline and M-CRIB-S training data is graphically described in Figure 1. Each image in the unlabelled dataset (Figure 1(i)) was segmented into cerebral white and grey matter (including lobar sub-divisions), cerebellum and various subcortical grey matter structures automatically using the DrawEM software package (9, 10). Inner and outer cortical boundary surfaces were extracted using the Deformable module (3). The FreeSurfer tools mris_inflate and mris_sphere (11) are construct inflated and spherical versions of the white matter surfaces, respectively. Surface templates, comprised of all labelled and unlabelled subjects, were constructed using the curvature-based spherical mapping, alignment and averaging method as previously described (1, 11). This enabled average white, pial and inflated surfaces to be constructed using the FreeSurfer tool mris_make_average_surface, by resampling surfaces onto the 6th order common icosahedron. For the 10 cases in the labelled dataset, the volumetric M-CRIB labels were projected to the corresponding white matter surface vertices. Parcellation training sets were constructed using the labelled set for each M-CRIB-S(DKT) and M-CRIB(DK) cortical label, using the method of Fischl et al. (12). The M-CRIB-S(DKT) parcellation of the average white surface is shown in Figure 1(c) and 1(d). Using both labelled and unlabelled datasets, we derived group-averaged white, pial, and inflated surfaces along with curvature and sulcal depth maps in a common spherical space (see Figure 2). Novel T2-weighted images can be parcellated using the M-CRIB-S atlas data using the sequence of processing steps depicted in Figure 1. Automatic parcellation accuracy was quantified within a Leave-One-Out (LOO) cross-validation framework. Dice measures and Hausdorff distances were used to quantify label overlap and boundary discrepancies, respectively.Results
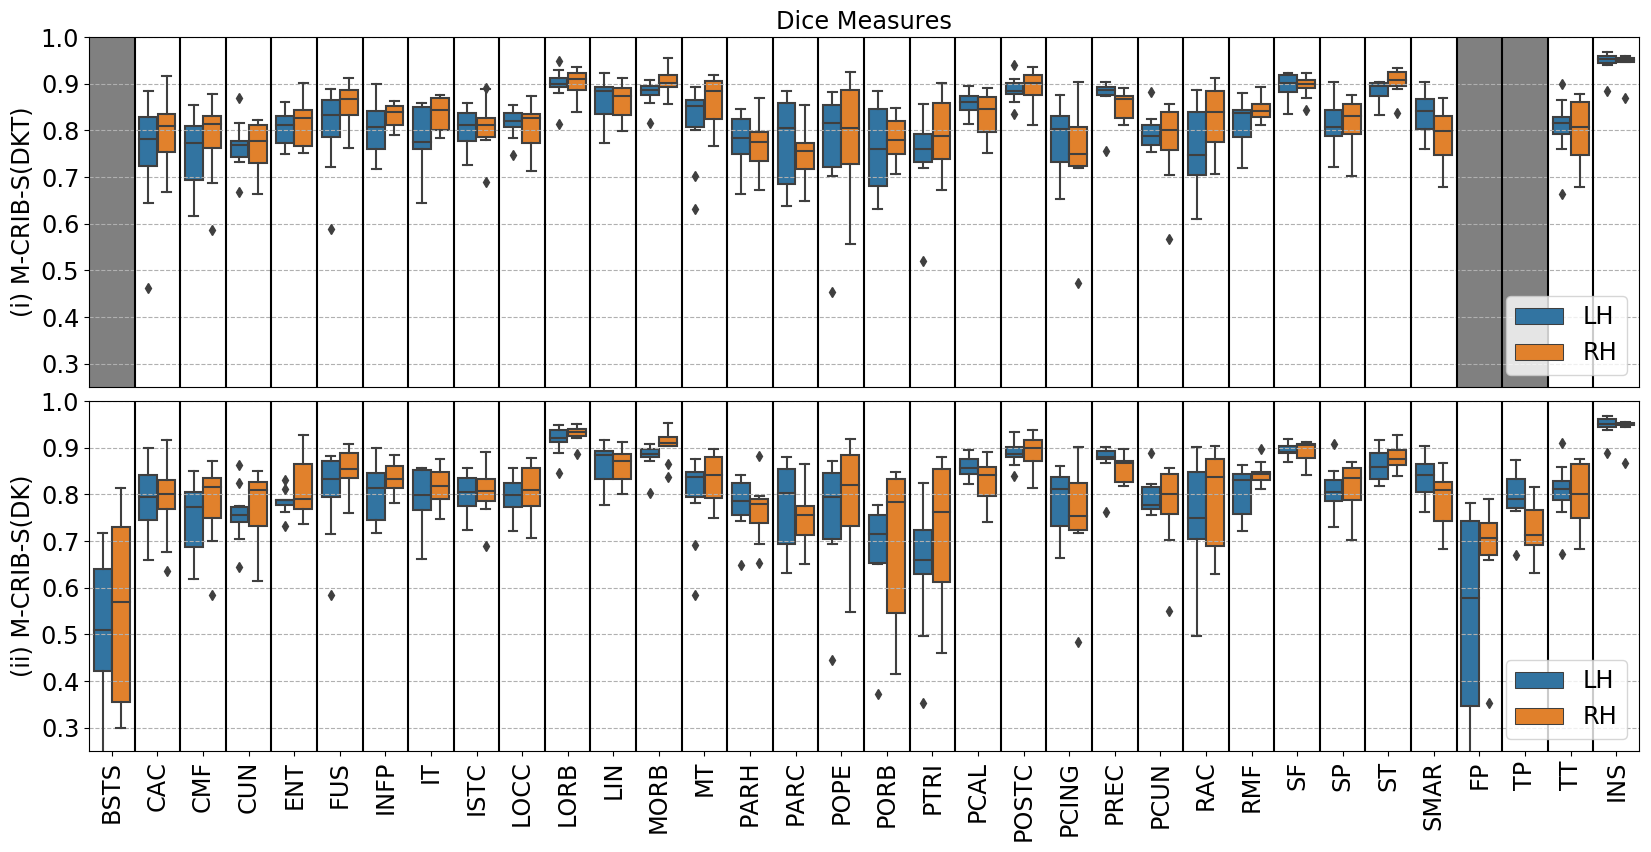
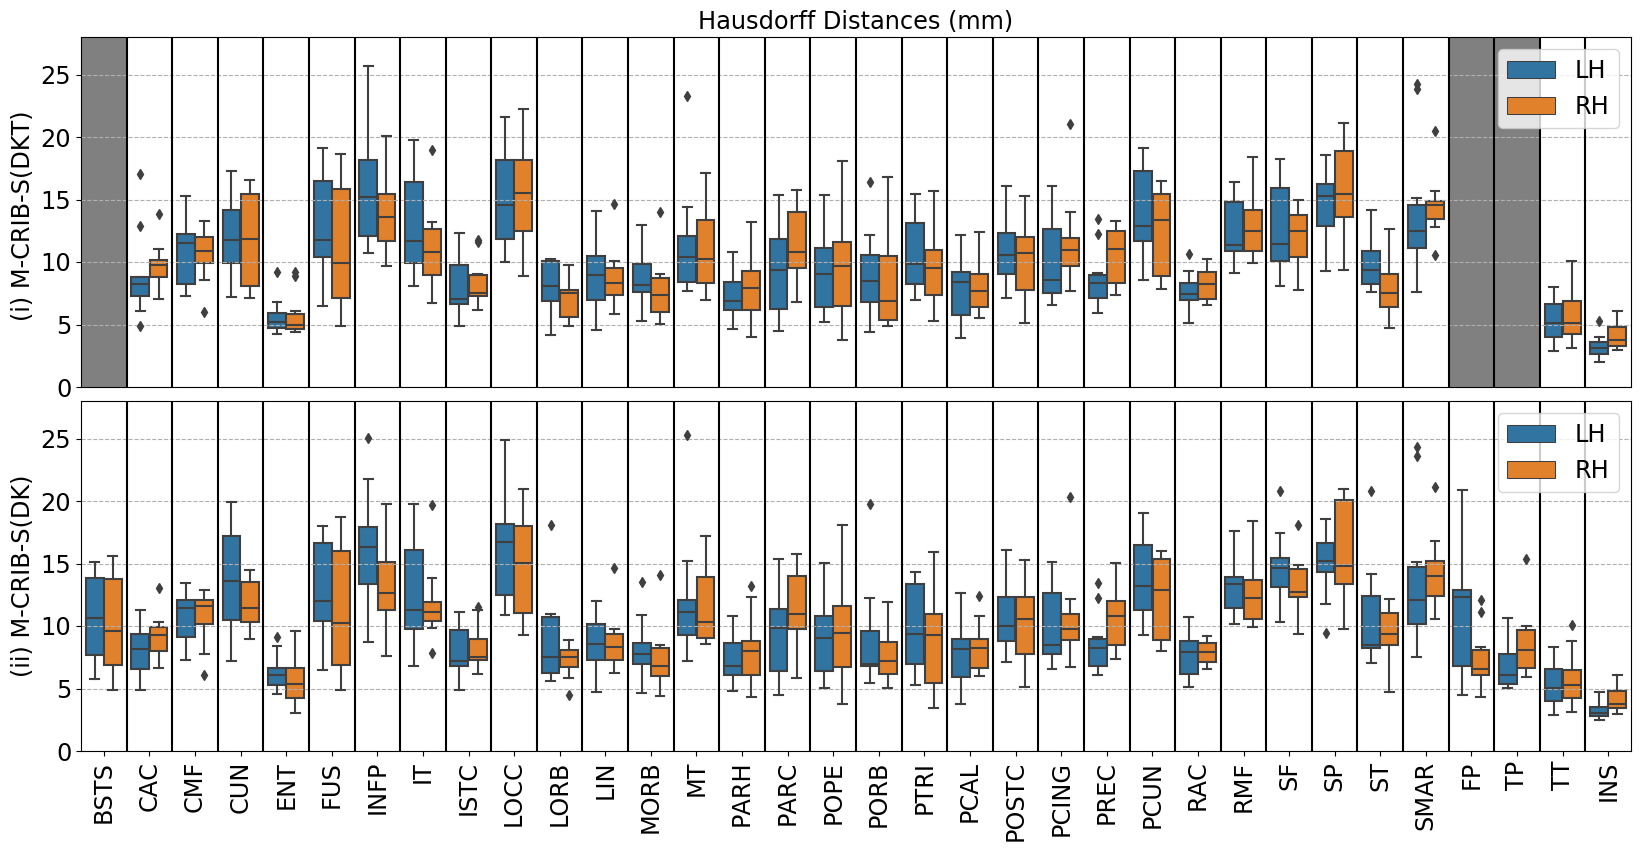
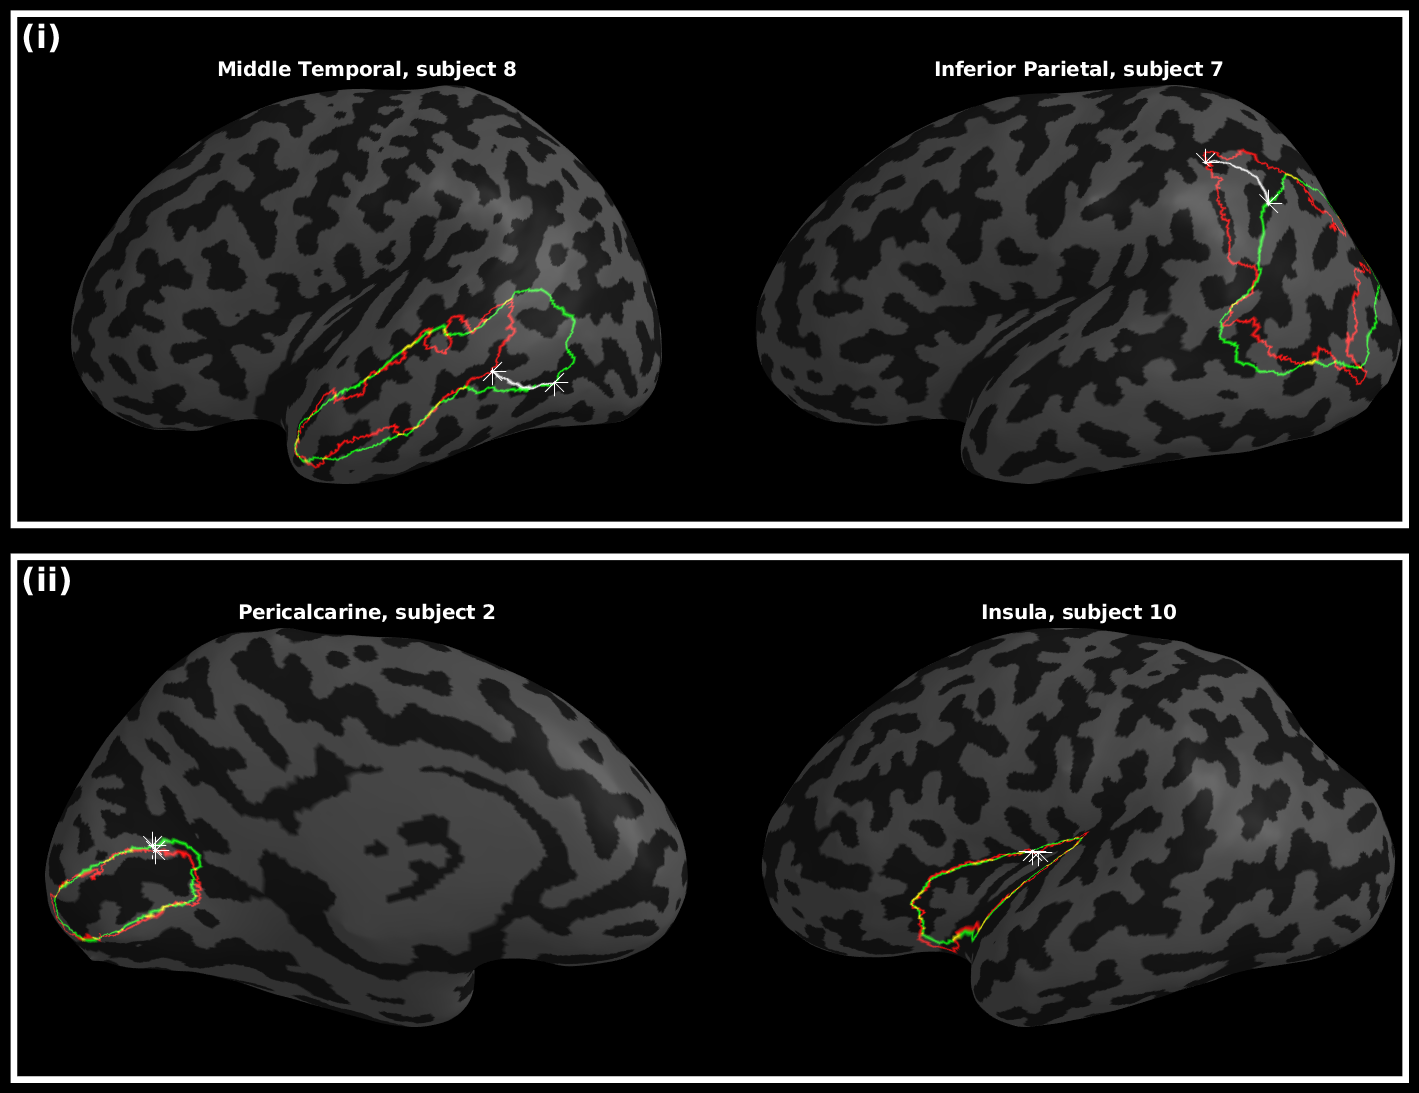
Figure 3 displays regional mean Dice measures. Dice scores for both atlases were generally high (0.79 - 0.83). For the M-CRIB-S(DKT) parcellation scheme, mean Dice measures were (left: [0.75-0.94], mean = 0.82, SD = 0.05; right: [0.75-0.94], mean = 0.83, SD = 0.05). For the M-CRIB-S(DK) parcellation scheme mean Dice measures were (left: [0.50-0.95], mean = 0.79, SD = 0.10; right: [0.55-0.94], mean = 0.80, SD = 0.07). Figure 4 shows per-region mean Hausdorff distances. For the M-CRIB-S(DKT) parcellation scheme, per-region mean Hausdorff distances were (left: [3.27-16.18mm] mean: 10.22 mm, SD = 2.99 mm; right: [4.11-15.91mm], mean: 10.13 mm, SD = 2.77 mm). For the M-CRIB-S(DK) parcellation scheme, Hausdorff distances were (left: [3.23-16.39mm], mean = 10.3 mm, SD = 3.08 mm; right: [4.11-15.96mm], mean = 9.96 mm, SD = 2.67 mm). Individual measurements of per-subject and per-label Hausdorff distances ranged from 1.9 - 25.6 mm in M-CRIB-S(DKT) and 2.4 - 25.3 mm in M-CRIB-S(DK). Figure 5 shows some examples of individual worst- and best-case Hausdorff distances between ground truth and estimated labels.Conclusion
We presented the M-CRIB-S(DKT) and M-CRIB-S(DK) atlases: surface-based versions of the volumetric M-CRIB and M-CRIB 2.0 atlases. We also presented an automated pipeline that involves segmentation of novel T2-weighted neonatal images, extraction of cortical surfaces, followed by cortical parcellation with the M-CRIB-S(DK) and M-CRIB-S(DKT) atlases, which are neonatal versions of the adult DK and DKT atlases. The curvature template registration targets, average surfaces, labelling training data, and pipeline execution scripts are available at (https://www.github.com/DevelopmentalImagingMCRI/MCRIBS). Cross-validated accuracy was found to be high, with worst-case discrepancies only present in regions with known high variability of anatomy.Acknowledgements
We gratefully acknowledge support from members of the Victorian Infant Brain Studies (VIBeS) group, Developmental Imaging group, and Melbourne Children’s MRI Centre at the Murdoch Children’s Research Institute, and thank the families who participated in the study. This work was supported in part by the Australian National Health and Medical Research Council (NHMRC) (Project Grant ID 1028822 and 1024516; Centre of Clinical Research Excellence Grant ID 546519; Centre of Research Excellence Grant ID 1060733; Senior Research Fellowship ID 1081288 to P.J.A.; Early Career Fellowship ID 1053787 to J.L.Y.C., ID 1053767 to A.J.S., ID 1012236 to D.K.T.; Career Development Fellowship ID 1108714 to A.J.S., ID 1085754 to D.K.T.), Murdoch Children’s Research Institute Clinical Sciences Theme Grant, the Royal Children’s Hospital, the Department of Paediatrics at the University of Melbourne, the Victorian Government Operational Infrastructure Support Program, and The Royal Children’s Hospital Foundation.References
1. Fischl, B., FreeSurfer. NeuroImage, 2012. 62(2): p. 774-781.
2. Makropoulos, A., et al., The developing human connectome project: A minimal processing pipeline for neonatal cortical surface reconstruction. Neuroimage, 2018. 173: p. 88-112.
3. Schuh, A., et al. A deformable model for the reconstruction of the neonatal cortex. in 2017 IEEE 14th International Symposium on Biomedical Imaging (ISBI 2017). 2017.
4. Spittle, A.J., et al., Neurobehaviour between birth and 40 weeks' gestation in infants born <30 weeks' gestation and parental psychological wellbeing: predictors of brain development and child outcomes. BMC Pediatrics, 2014. 14: p. 111.
5. Walsh, J.M., et al., Moderate and late preterm birth: effect on brain size and maturation at term-equivalent age. Radiology, 2014. 273(1): p. 232-40.
6. Alexander, B., et al., Desikan-Killiany-Tourville Atlas Compatible Version of M-CRIB Neonatal Parcellated Whole Brain Atlas: The M-CRIB 2.0. Front Neurosci, 2019. 13: p. 34.
7. Alexander, B., et al., A new neonatal cortical and subcortical brain atlas: the Melbourne Children's Regional Infant Brain (M-CRIB) atlas. Neuroimage, 2017. 147: p. 841-851.
8. Loh, W.Y., et al., A New MRI-Based Pediatric Subcortical Segmentation Technique (PSST). Neuroinformatics, 2016. 14(1): p. 69-81.
9. Makropoulos, A., et al., Regional growth and atlasing of the developing human brain. Neuroimage, 2016. 125: p. 456-478.
10. Makropoulos, A., et al., Automatic whole brain MRI segmentation of the developing neonatal brain. IEEE Trans Med Imaging, 2014. 33(9): p. 1818-31.
11. Fischl, B., et al., High-resolution intersubject averaging and a coordinate system for the cortical surface. Hum Brain Mapp, 1999. 8(4): p. 272-84.
12. Fischl, B., et al., Automatically Parcellating the Human Cerebral Cortex. Cerebral Cortex, 2004. 14(1): p. 11-22.
Figures