4651
Spatiotemporal patterns of sulcal pits in the fetal brain1Newborn Medicine, Boston Children's Hospital, Boston, MA, United States, 2Pediatric Neurology, Tufts Medical Center, Boston, MA, United States, 3Neurology, Boston Children's Hospital, Boston, MA, United States, 4Pediatrics, Washington University in St. Louis, St. Louis, MO, United States
Synopsis
Sulcal pits is known to represent the first cortical folds emerging in early fetal life. However, little is known about sulcal pits in the fetal brain. Since fetal brain showed dynamic changes of cortical folding during the second half of gestation, it is necessary to investigate spatial and temporal patterns of sulcal pits in the fetal brain. We analyzed spatial distribution and quantified emergence timing of pits using 48 typically developing fetuses. Sulcal pits were uniformly distributed in the fetal brain, and their timing of emergence are regionally different. It demonstrates sulcal pits are important landmarks of human brain development.
Introduction
In the human brain, complex folding pattern of cortical sulci is a result of neurodevelopment. Recently sulcal pits have been proposed as locally deepest points of cortical sulci that are thought to represent the first folds1–5. Sulcal pits show uniform spatial distribution in the mature brain, and the uniform pit distribution is hypothesized to be influenced by a stable human-specific protomap which is thought to be associated with functional localization of human cerebral cortex. Because the protomap is predetermined in early fetal stages under genetic controls6–12, it is necessary to investigate pit distribution in the fetal brain to enhance our understandings of brain development. The fetal brain shows dynamic changes in cortical folding such as shape and relative position of cortical sulci during the second half of gestation13,14. Thus, it needs to be determined whether sulcal pits in the fetal brain are uniformly distributed against the dynamic folding changes.Furthermore, timing of sulcal emergence has been employed to estimate gestational week13,14 and it might be affected by rapid growth and regional expansion of functional areas15,16. Since multiple sulcal pits exist in the most of sulci that may be associated with subdivisions of functional areas, quantifying the timetable of pit emergence may provide more regional information of functional localization in human brain development.
To date, the temporal and spatial patterns of sulcal pits have not been investigated in fetal brains. Thus, we quantified and analyzed the timing of emergence and spatial distribution of sulcal pits using 48 typically developing fetuses.
Methods
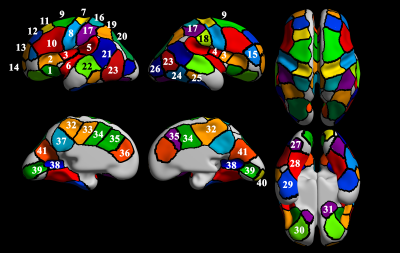
The study was approved by the local Institutional Review Board at Boston Children’s Hospital (BCH) and Tufts Medical Center (TMC). A total of 48 TD fetuses were included in this study (male/female: 30/18, age: 26.7 ± 2.9 gestational week (GW) [mean ± standard deviation (SD)], ranged from 22.0 to 32.0 GW). The brain MR images were acquired on a 3T Skyra scanner (BCH) or Phillips 1.5 T scanner (TMC) using a T2-weighted HASTE (Half-Fourier Acquisition Single-Shot Turbo Spin-Echo) sequence with 1 mm in-plane resolution (FOV = 256mm, time repetition = ~1.5s (BCH) or 12.5s (TMC), time echo = ~120ms (BCH) or 180ms (TMC), and slice thickness = 2~4mm). For statistical analysis, we divided the 48 fetuses into three subgroups (n = 16 (male/female: 10/6) for each) by GW based on histogenic processes during fetal brain development (Gearly: 22.0 ~ 24.7 GW, Gmid: 25.1 ~ 28.0 GW, and Glate: 28.6 ~ 32.0 GW)17–22.Applying our fetal MR image processing pipeline23–25, we extracted hemispheric triangular surface meshes of the cortical plate. The surface meshes were geometrically smoothed and then aligned to 28 GW template surface using a 2D sphere-to-sphere warping method24,26. The aligned surfaces had vertex-wise correspondence among the individual surfaces. We then extracted sulcal pits on the aligned surfaces based on mean curavature24. To define consistent regions of sulcal pits across the fetuses, a cluster map was generated by our previous technique (Figure 1)2.
Based on the clusters, we analyzed spatiotemporal pattern of sulcal pits. First, we performed chi-square tests to estimate the timing of pit emergence in each cluster between Gearly and Gmid and between Gmid and Glate. Second, spatial distribution of sulcal pits was tested after reducing 3D coordinates of sulcal pits in each cluster to 1D coordinates using tangent plane, principal component analysis (Figure 2). The difference in the position of sulcal pits among the subgroups was investigated using a Kruskal-Wallis test. Similarity of the spatial variance of sulcal pits across the subgroups were tested by Pearson’s correlation analysis was performed with the SD values of sulcal pit positions from all clusters in the whole brain between two subgroups. In all the statistical analysis, we set the significance level at the corrected p value of 0.05 after false discovery rate (FDR) correction.
Results
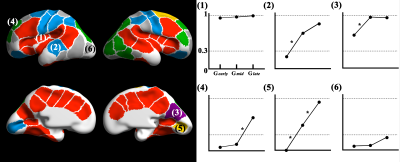
We obtained regionally different timing of pit emergence which may indicate different regional-specific maturation of each subdivision of the functional area (Figure 3). Also, we found three different emerging patterns across the clusters: (1) clusters with high pit presence rate (>0.3) in Gearly, (2) clusters with increase of pit presence between Gearly and Gmid, and (3) clusters where sulcal pits may emerge in later fetal life. For all clusters, the Kruskal-Wallis test showed no significant difference in pit position among the groups (FDR corrected p > 0.05). Spatial variance across fetal brains showed significant correlation between Gearly and Gmid (r = 0.59 and p < 0.001), Gearly and Glate (r = 0.50 and p = 0.001), and Gmid and Glate (r = 0.70 and p < 0.001).Discussion
We found timing of pit emergence is regionally different across the fetal clusters (from the central to peripheral regions); and the position and spatial variance of the sulcal pits are not significantly changed with brain development. Our findings support spatial distribution of sulcal pits predetermined in early fetal life and maintained throughout human lifetime. In conclusion, spatiotemporal characteristics sulcal pits are important landmarks of the human brain development and would be used as potential biomarkers for detecting abnormal cortical maturation in early fetal stage.Acknowledgements
This work was supported by the Eunice Kennedy Shriver National Institute of Child Health & Human Development of the National Institutes of Health (NIH) (R21HD094130, and U01HD087211), National Institute of Biomedical Imaging and Bioengineering of the NIH (R01EB017337), the National Institute of Neurological Disorders and Stroke of the NIH (K23NS101120), American Heart Association (19IPLOI34660336), and Swiss National Science Foundation (P300PB_167804). The content is solely the responsibility of the authors and does not necessarily represent the official views of the NIH.References
1. Auzias, G., Brun, L., Deruelle, C. & Coulon, O. Deep sulcal landmarks: Algorithmic and conceptual improvements in the definition and extraction of sulcal pits. NeuroImage 111, 12–25 (2015).
2. Im, K. et al. Spatial distribution of deep sulcal landmarks and hemispherical asymmetry on the cortical surface. Cereb. Cortex N. Y. N 1991 20, 602–611 (2010).
3. Le Guen, Y. et al. Genetic Influence on the Sulcal Pits: On the Origin of the First Cortical Folds. Cereb. Cortex N. Y. N 1991 1–12 (2017) doi:10.1093/cercor/bhx098.
4. Lohmann, G., von Cramon, D. Y. & Steinmetz, H. Sulcal variability of twins. Cereb. Cortex N. Y. N 1991 9, 754–763 (1999).
5. Meng, Y., Li, G., Lin, W., Gilmore, J. H. & Shen, D. Spatial distribution and longitudinal development of deep cortical sulcal landmarks in infants. NeuroImage 100, 206–218 (2014).
6. Chen, C.-H. et al. Hierarchical Genetic Organization of Human Cortical Surface Area. Science 335, 1634 (2012).
7. Miller, J. A. et al. Transcriptional landscape of the prenatal human brain. Nature 508, 199–206 (2014).
8. O’Leary, D. D. M., Chou, S.-J. & Sahara, S. Area Patterning of the Mammalian Cortex. Neuron 56, 252–269 (2007).
9. Piao, X. et al. G Protein-Coupled Receptor-Dependent Development of Human Frontal Cortex. Science 303, 2033–2036 (2004).
10. Rakic, P. Genetic Control of Cortical Convolutions. Science 303, 1983–1984 (2004).
11. Rubenstein, J. L. R. & Rakic, P. Genetic Control of Cortical Development. Cereb. Cortex 9, 521–523 (1999).
12. Stahl, R. et al. Trnp1 Regulates Expansion and Folding of the Mammalian Cerebral Cortex by Control of Radial Glial Fate. Cell 153, 535–549 (2013).
13. Garel, C., Chantrel, E., Elmaleh, M., Brisse, H. & Sebag, G. Fetal MRI: normal gestational landmarks for cerebral biometry, gyration and myelination. Childs Nerv. Syst. ChNS Off. J. Int. Soc. Pediatr. Neurosurg. 19, 422–425 (2003).
14. Habas, P. A. et al. Early folding patterns and asymmetries of the normal human brain detected from in utero MRI. Cereb. Cortex N. Y. N 1991 22, 13–25 (2012).
15. Ronan, L. & Fletcher, P. C. From genes to folds: a review of cortical gyrification theory. Brain Struct. Funct. 220, 2475–2483 (2015).
16. Welker, W. Why Does Cerebral Cortex Fissure and Fold? in Cerebral Cortex 3–136 (Springer, Boston, MA, 1990). doi:10.1007/978-1-4615-3824-0_1.
17. Bystron, I., Blakemore, C. & Rakic, P. Development of the human cerebral cortex: Boulder Committee revisited. Nat. Rev. Neurosci. 9, 110–122 (2008).
18. Chi, J. G., Dooling, E. C. & Gilles, F. H. Gyral development of the human brain. Ann. Neurol. 1, 86–93 (1977).
19. Krsnik, Ž., Majić, V., Vasung, L., Huang, H. & Kostović, I. Growth of Thalamocortical Fibers to the Somatosensory Cortex in the Human Fetal Brain. Front. Neurosci. 11, 233 (2017).
20. Huang, H. et al. Anatomical Characterization of Human Fetal Brain Development with Diffusion Tensor Magnetic Resonance Imaging. J. Neurosci. 29, 4263–4273 (2009).
21. Vasung, L., Raguz, M., Kostovic, I. & Takahashi, E. Spatiotemporal Relationship of Brain Pathways during Human Fetal Development Using High-Angular Resolution Diffusion MR Imaging and Histology. Front. Neurosci. 11, 348 (2017).
22. Draganova, R. et al. Sound frequency change detection in fetuses and newborns, a magnetoencephalographic study. NeuroImage 28, 354–361 (2005).
23. Tarui, T. et al. Disorganized Patterns of Sulcal Position in Fetal Brains with Agenesis of Corpus Callosum. Cereb. Cortex 28, 3192–3203 (2018).
24. Yun, H. J. et al. Automatic labeling of cortical sulci for the human fetal brain based on spatio-temporal information of gyrification. NeuroImage 188, 473–482 (2019).
25. Im, K. et al. Quantitative Folding Pattern Analysis of Early Primary Sulci in Human Fetuses with Brain Abnormalities. Am. J. Neuroradiol. 38, 1449–1455 (2017).
26. Robbins, S., Evans, A. C., Collins, D. L. & Whitesides, S. Tuning and comparing spatial normalization methods. Med. Image Anal. 8, 311–323 (2004).
Figures


