4650
Grey matter hypertrophy and atrophy in early-blind adolescents: a surface-based morphometric study1Radiology, Shenzhen Mental Health Center/Shenzhen Kangning Hospital, Shenzhen, China, 2Shenzhen Mental Health Center/Shenzhen Kangning Hospital, Shenzhen, China, 3GE Healthcare, Beijing, China, 4Beijing Intelligent Brain Cloud, Inc, Beijing, China, 5The First Affiliated Hospital of Jinan University, Guangzhou, China
Synopsis
Numerous studies have explored brain structural abnormalities in blind people. However, most of them were based on volumetric measures, using voxel-based morphology, or in a specific region of interest, which may conceal fine anatomic details in other features. This study investigated alterations in cortical morphologies (thickness, volume and surface area) in early-blind adolescents (EBAs) using a surface-based morphometric method. Our results showed that there was disuse atrophy, compensatory and experience-related neural plasticity in the cerebral cortex of EBAs due to the visual deprivation.
Introduction
Number of studies have explored brain structural abnormalities in blind people. However, most of them were based on volumetric measures, using voxel-based morphology (VBM), or in a specific region of interest, which may conceal fine anatomic details in other features, such as cortical thickness and surface area. In current study, we investigated alterations in cortical morphologies (thickness, volume and surface area) in early-blind adolescents (EBAs) using an advanced surface-based morphometric method.Method
High-resolution structural T1-weighted images (T1WI) of 23 early-blind adolescents (EBA group; 15 males and 8 females; age range 11-18, 14.80±2.07 years) with onset age <1 year and 21 age- and gender-matched normal-sighted controls (NSC group; 11 males and 10 females; age range 11-19, 14.56±2.59 years) were acquired. The preprocessings of T1WI were conducted using FreeSurfer version 6.0 in accordance with a standard cross-sectional pipeline (http://surfer.nmr.harvard.edu), including non-uniform intensity normalization, removal of non-brain tissue, transformation to Talairach space, segmentation of gray/white matter tissue, triangular tessellation, subcortical segmentation, and cortical parcellation. Then, for each hemisphere the General Linear Model (GLM) with vertex-wise analyses of surface morphometric measurements, including cortical thickness (CT), cortical volume (CV), and surface area (SA), were performed in EBA and NSC groups. Statistical maps were generated using FreeSurfer’s Query, Design, Estimate, Contrast (QDEC) interface. Finally, the cortical maps were visualized by overlaying significant cortical areas onto semi-inflated cortical surfaces without smoothing. Multiple comparisons were corrected with Monte Carlo Simulation using a vertex-level p-value set at < 0.01, and cluster-level threshold p < 0.05. In addition, the association between cortical morphometric measures and age in both groups, and blindness duration in EBA group was also examined using the Statistical Package for the Social Sciences (SPSS) software (version 23.0; IBM Corporation, NY, USA).Results
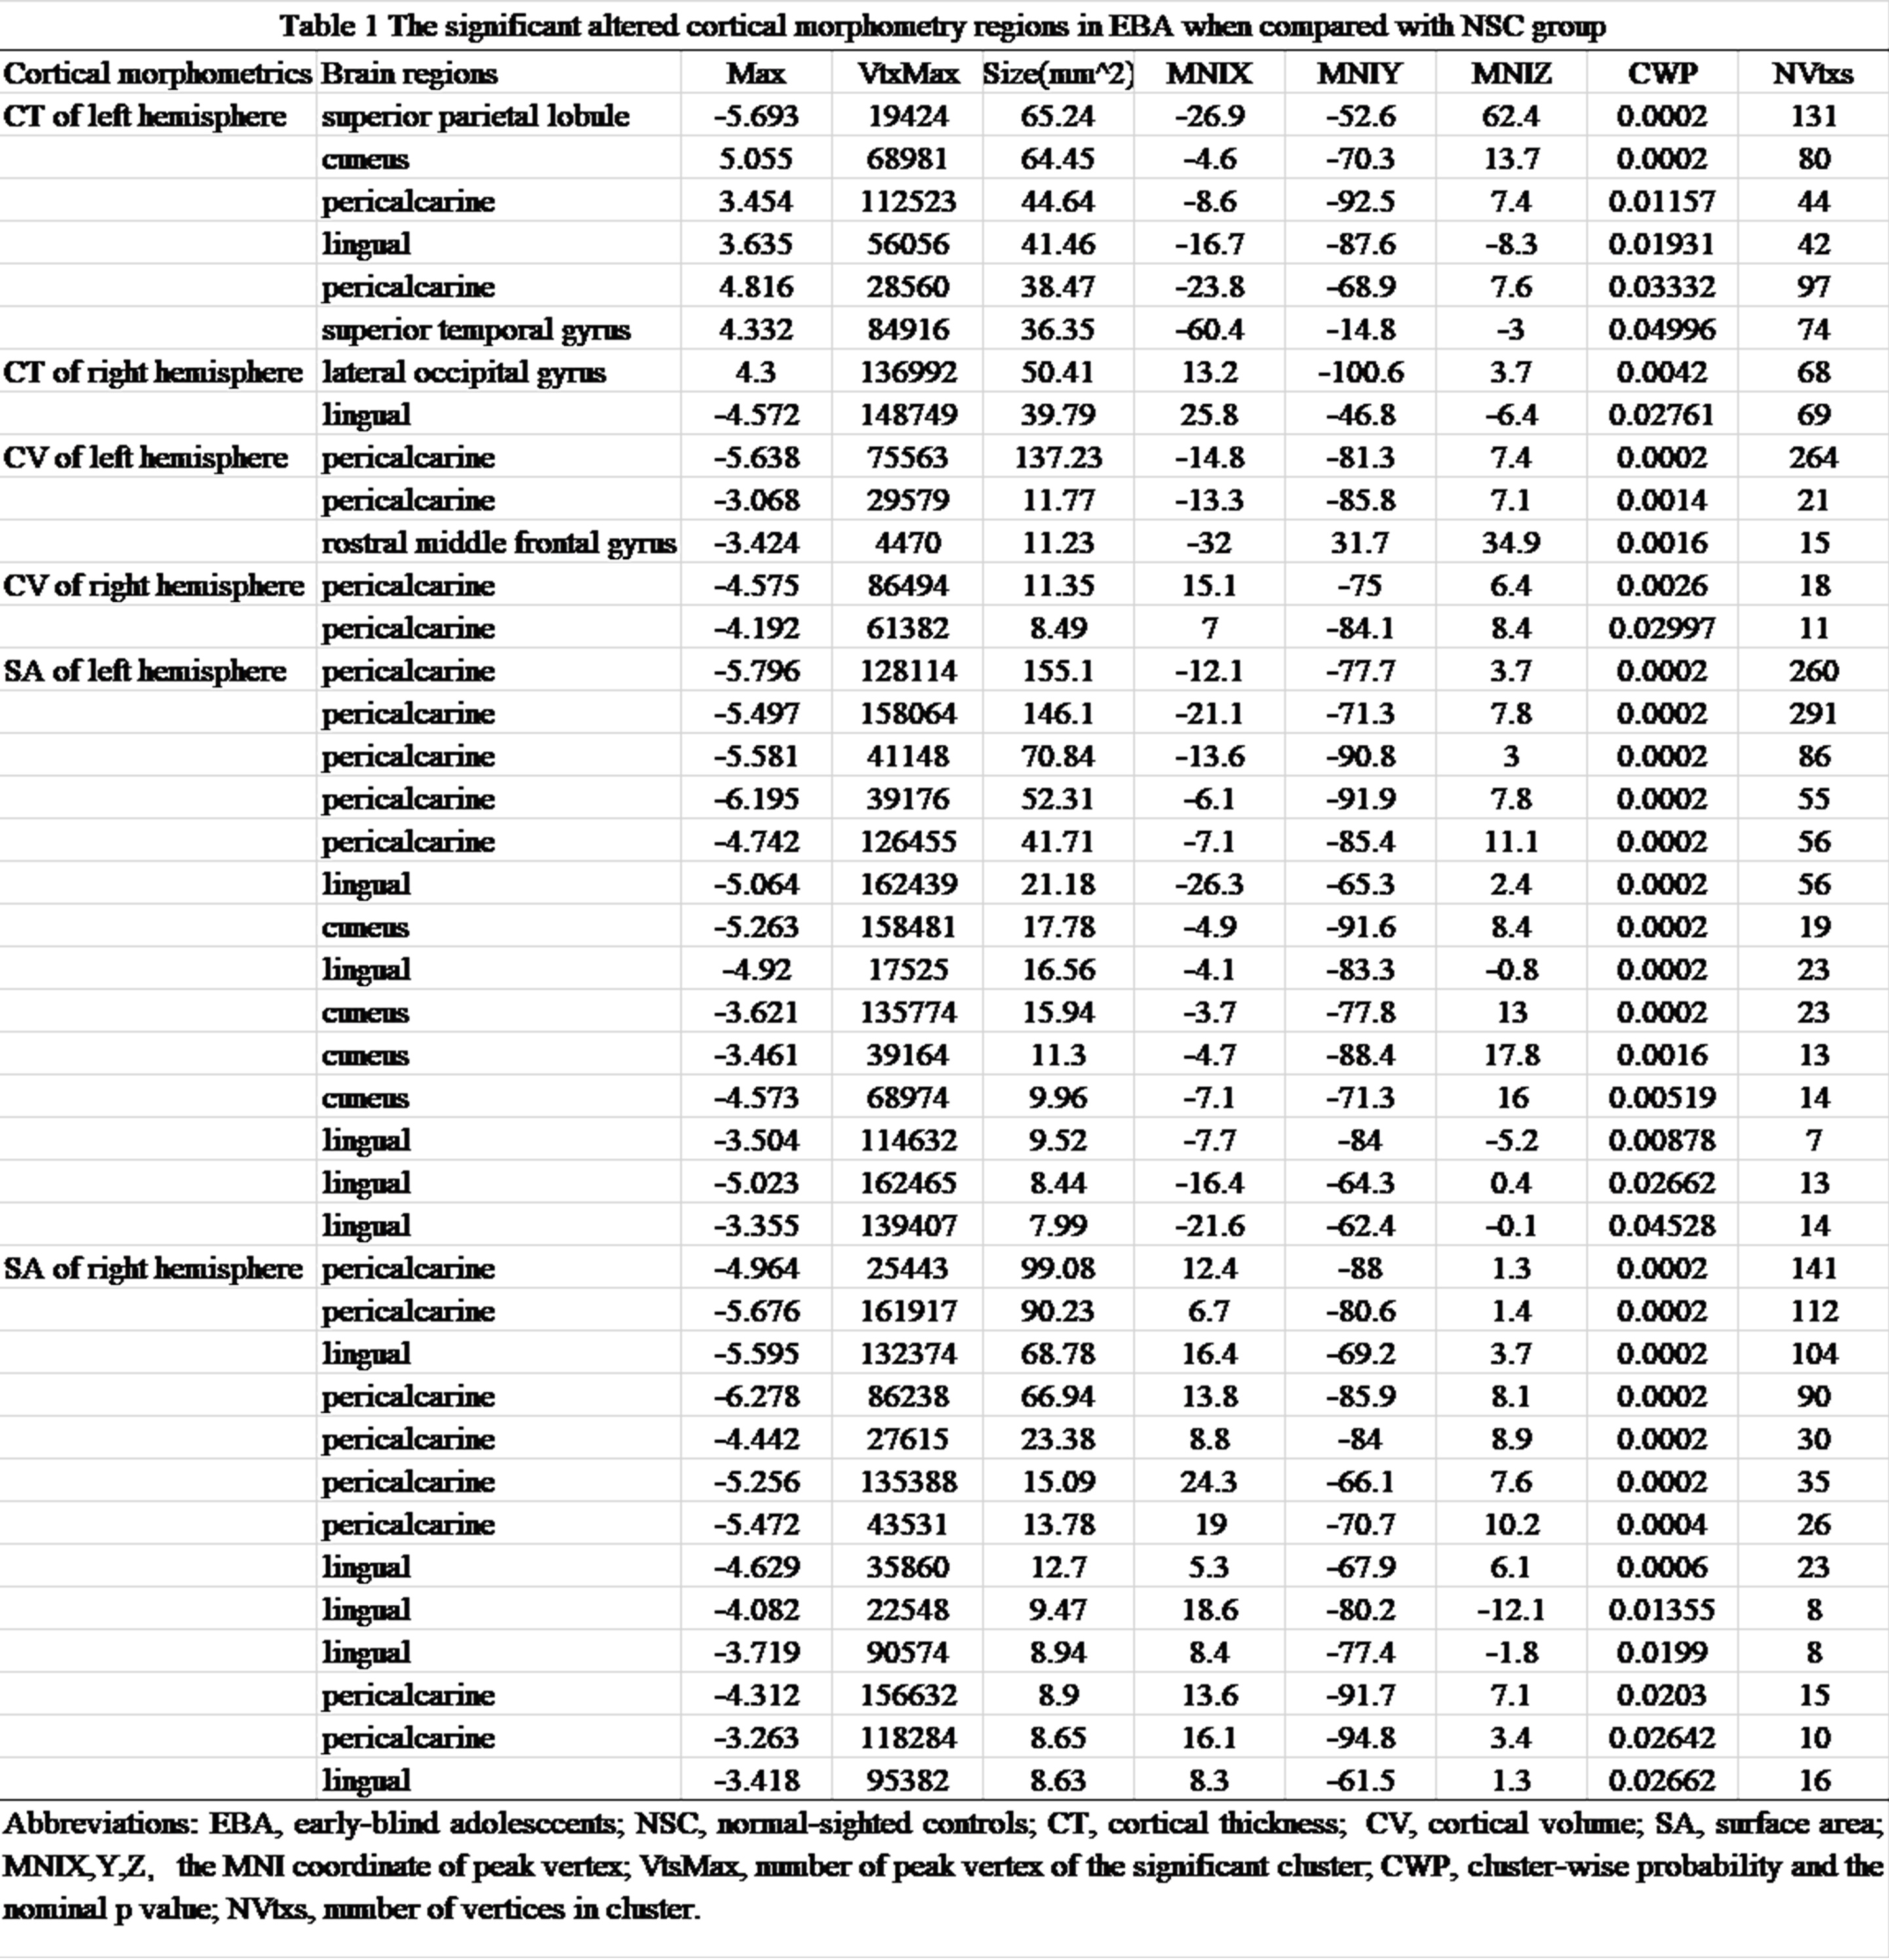
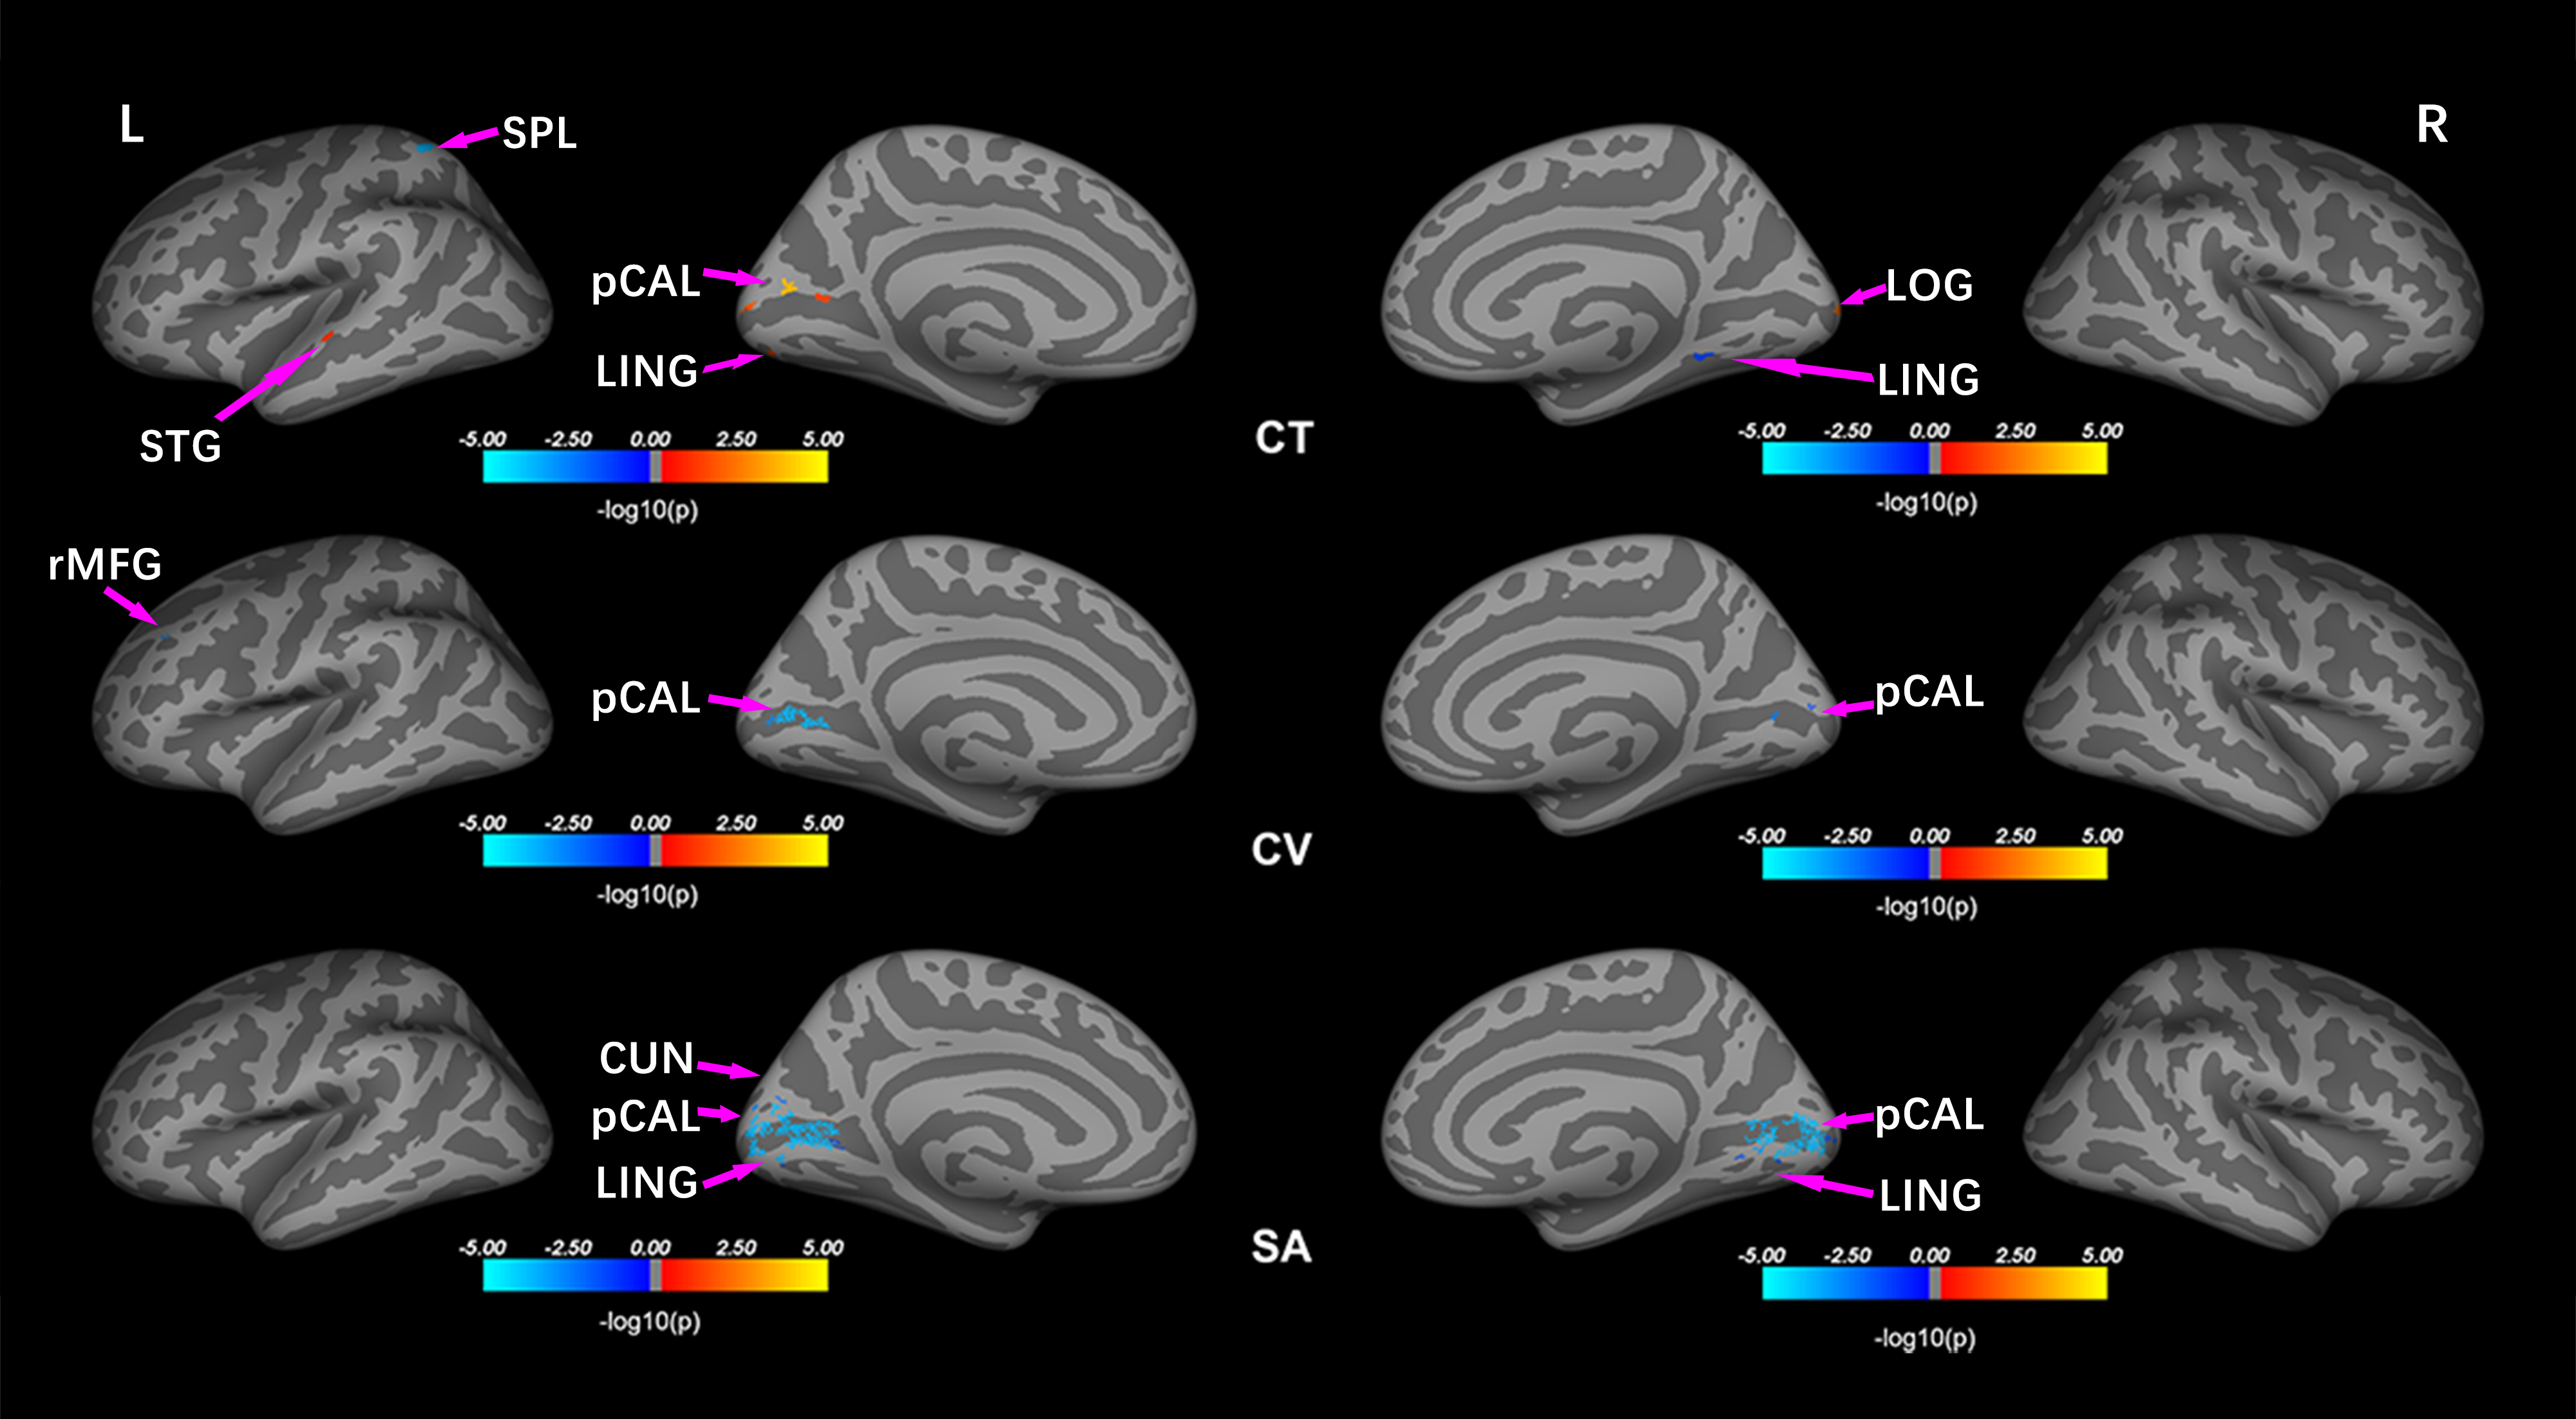
Compared to controls, EBAs had significantly increased CT in the left pericalcarine (pCAL.L), cuneus (CUN.L), superior temporal gyrus (STG.L), and right lateral occipital gyrus (LOG.R), as well as decreased CT in left superior parietal lobule (SPL.L) and right lingual gyrus (LING.R). In terms of CV, EBAs had significant CV loss in bilateral pCAL and left rostral middle frontal gyrus compared with NSCs. There were no regions demonstrated significant higher CV in EBAs than NSCs. For the SA, EBAs had significant reduced SA in bilateral pCAL and LING, and CUN.L compared to NSCs. No higher SA was observed in EBAs in comparison with NSCs. (Table 1, Figure 1) Additionally, no correlations were found between each of cortical morphometric measures and clinical variables in both groups.Discussion and conclusion
This study investigated potential alterations of cortical morphologies in EBAs. We utilized a whole cortical surface-based method and identified several main findings: 1) EBA had cortical grey matter hypertrophy in left primary visual area (pCAL.L), STG.L, CUN.L and right high-level visual areas (LOG.R), and atrophy in SPL.L and LING.R; 2) In EBA group, reduced CV and SA were mainly located in bilateral primary visual area which is in line with our previous VBM result.1 The STG is involved in auditory comprehension process,2 and the SPL considered as a part of dorsal attention network, is associated with spatial cognition, sensorimotor, attention, and working memory.3,4 The thickening STG and thinning SPL in EBA reflect compensatory reorganization and disuse atrophy, respectively, due to the absence of visual information. Moreover, as a high-level visual area, the LOG plays a key role in object recognition by integrating visual and spatial information.5 The hypertrophy in this region may reveal experience-related reorganization in blind people, who process more spatial information from auditory and tactile sense rather than visual input.Taken together, this study discovered cortical changes in adolescents with early-blindness using multiple morphological measurements. Our results showed that there was disuse atrophy, compensatory and experience-related neural plasticity in the cerebral cortex of EBAs due to the visual deprivation.
Acknowledgements
No acknowledgement found.References
1. Hou F, Liu X, Zhou Z, et al. Reduction of Interhemispheric Functional Brain Connectivity in Early Blindness: A Resting-State fMRI Study. Biomed Res Int. 2017:6756927. Epub 2017/06/01.
2. DeWitt I, Rauschecker JP. Convergent evidence for the causal involvement of anterior superior temporal gyrus in auditory single-word comprehension. Cortex. 2016,77:164-166. Epub 2015 Aug 28.
3. Koenigs M, Barbey AK, Postle BR, et al. Superior parietal cortex is critical for the manipulation of information in working memory. The Journal of Neuroscience. 2009, 29(47), 14980–14986.
4. Wolpert DM, Goodbody SJ, and Husain M. Maintaining internal representations: The role of the human superior parietal lobe. Nature Neuroscience. 1998, 1(6), 529–533.
5. Guggenmos M, Thoma V, Cichy RM, et al. Non-holistic coding of objects in lateral occipital complex with and without attention. Neuroimage. 2015,107:356-363.
Figures