4649
Application of radiomics for predicting poor psychomotor outcome in preterm neonates using brain MRI1Division of Mechanical and Biomedical Engineering, Ewha Womans University, Seoul, Korea, Republic of, 2Department of Radiology, Eunpyeong St. Mary’s Hospital, College of Medicine, The Catholic University of Korea, Seoul, Korea, Republic of, 3Department of Radiology, Seoul St. Mary's Hospital, College of Medicine, The Catholic University of Korea, Seoul, Korea, Republic of
Synopsis
To predict poor psychomotor development in preterm neonates who underwent MRI at term-equivalent age, we implemented radiomics feature analysis of white matter on T1-and T2-weighted images. A total 1920 features were derived, and optimal number of features were selected. The area under the ROC curve (AUC) for the diagnostic abilities of the radiomics analysis were 0.657, 0.814, and 0.690, using T1-weighted images, T2-weighted images, and both T1- and T2-weighted images, respectively. In conclusion, radiomics for term-equivalent age brain MRI can be useful for predicting poor psychomotor outcome in preterm neonates.
Purpose
Preterm neonates are at high risk of psychomotor deficits.1 Although white matter injury of preterm neonates is known to be related to poor neurodevelopmental outcome,2 precise diagnosis of the injury and prediction of individual outcome is still challenging. The objective of our study was to apply radiomics for predicting poor psychomotor development in preterm neonates using their brain MRI taken at term-equivalent age.Methods
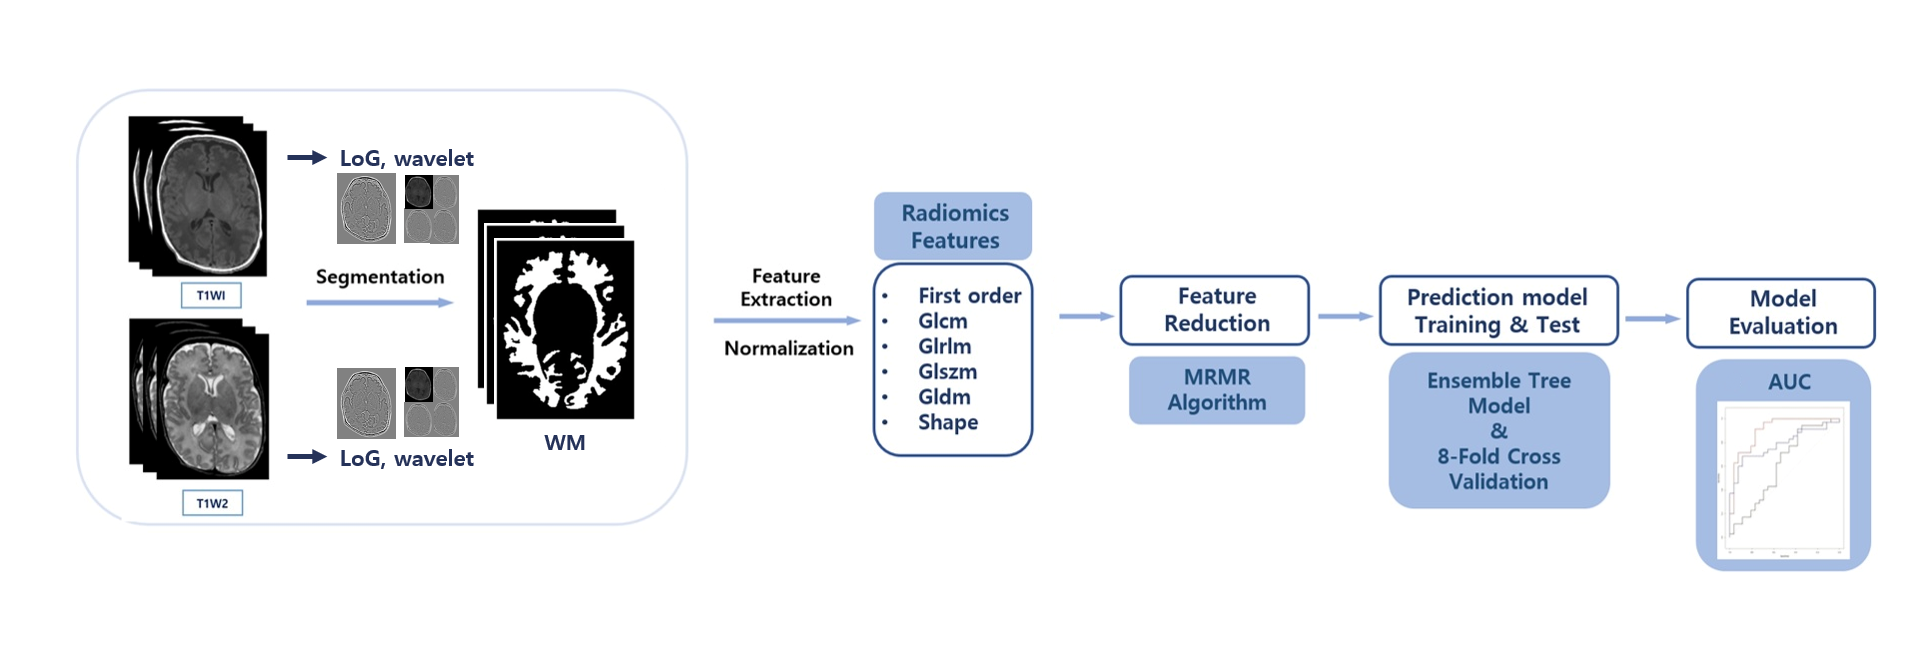
Forty-six preterm neonates who underwent brain MRI at term-equivalent age from September 2017 to December 2018, were enrolled in this prospective study. Neonates who had known risk factors with poor neurodevelopmental outcome such as brain structural abnormality on preceding examination or grade 3 or higher intracranial hemorrhages, were excluded from the study enrollment. Neonates underwent neurodevelopmental assessments at 6 months corrected age. Multiparametric quantitative MRI data were acquired using multi-echo, multi-delay saturation recovery spin echo sequence QRAPMASTER, with 4 saturation delays and 2 echoes.3 The saturation delays were at 130, 500, 1370, and 2970 msec with a repetition time of 4452 msec. The echo times were 22 and 128 msec. Each acquisition led to 8 images per section with different combinations of saturation delay times and echo times. Slice thickness was 5 mm, FOV was 200 x 200 mm, matrix was 320 x 224, section thickness/gap were 5.0/0.0 mm, and the number of sections were 20 to 28. The scanning time was 5 minutes. Synthetic T1- and T2-weighted images were generated and used for the analysis. Regions of interest (ROIs) for white matter were determined based on T2-weighted images first through automated-segmentation software and further fine-tuned manually under a pediatric radiologist’s supervision.Figure 1 shows the entire process of radiomics feature analysis. A total of 960 features were extracted from each of T1- and T2-weighted images using python-based libraries.4 The original, wavelet-transformed, and Laplacian of Gaussian-filtered (LoG) images were used to extract features related to First Order (19), Shape (16), Gray Level Co-occurrence Matrix (GLCM, 23), Gray Level Run Length Matrix (GLRLM, 16), Gray Level Size Zone Matrix (GLSZM, 16), and Gray Level Dependence Matrix (GLDM, 14). Ensemble tree model was used as a prediction model for the binary classification of psychomotor developmental index (PDI) that was assessed using Bayley Scales of Infant and Toddler Development-II. PDI less than 85 score was defined as poor outcome and PDI 85 score or higher was defined as normal outcome.5 While the classifier was executed by 8-folds cross validation on the training and test dataset, Minimum Redundancy Maximum Relevance (MRMR) algorithm was used to rank relevant features. The best number of features for classification was found for each of T1- and T2-weighted images as well as combination of T1- and T2-weighted images through exhaustive search. The optimal AUC was calculated for each of the three cases (T1-weighted images only, T2-weighted images only, and combination of both of the images).
Results
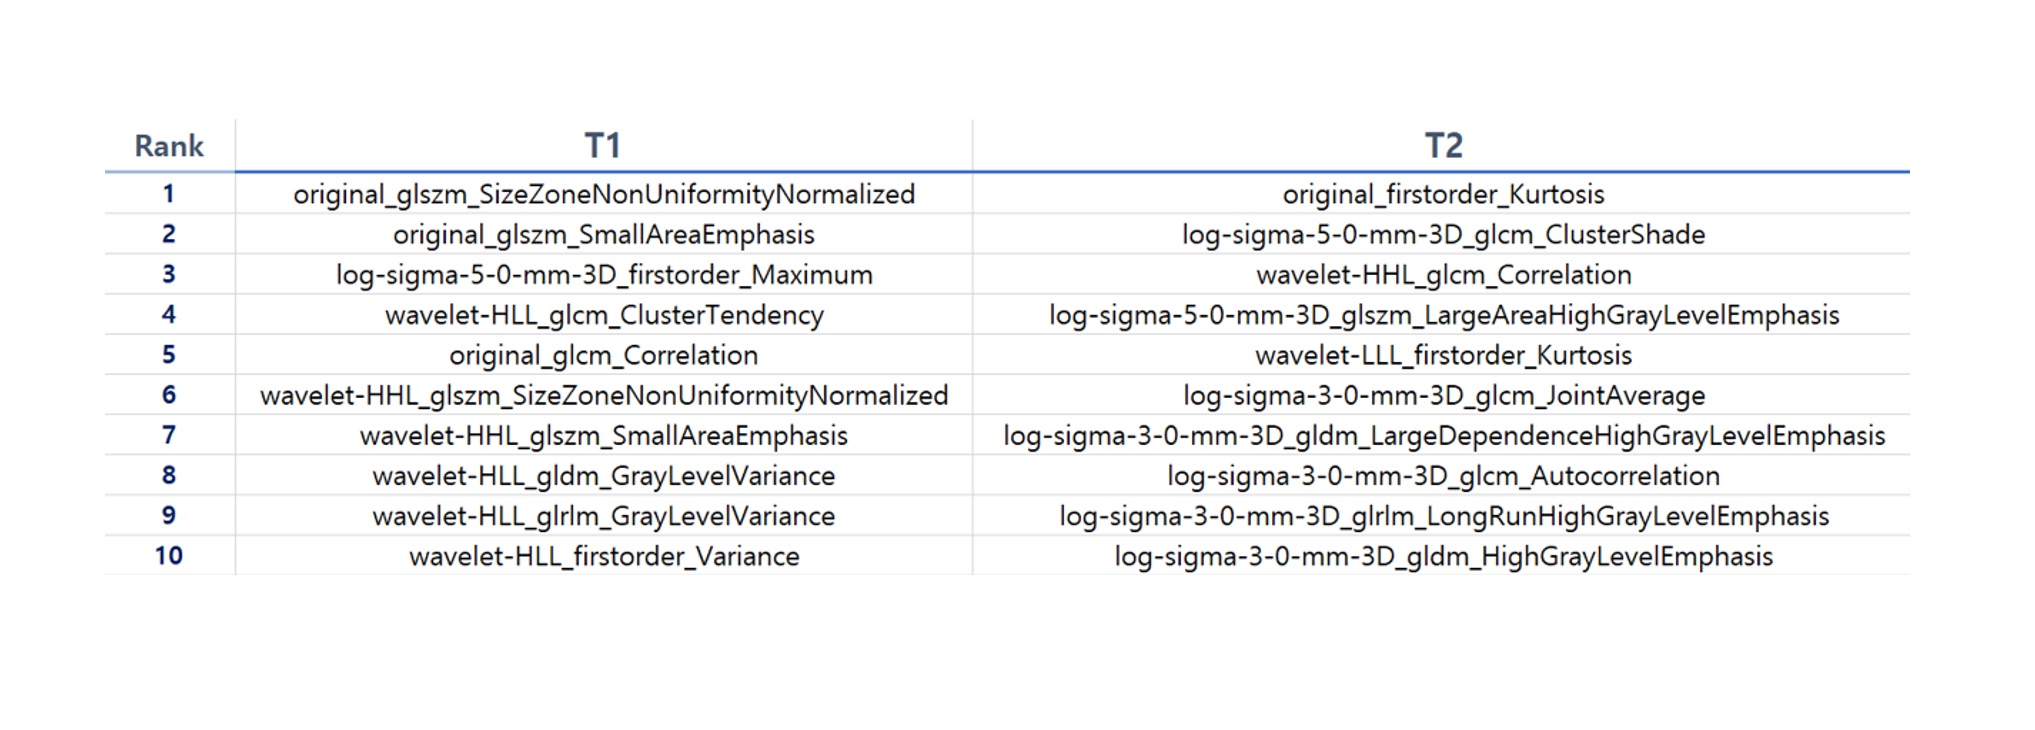
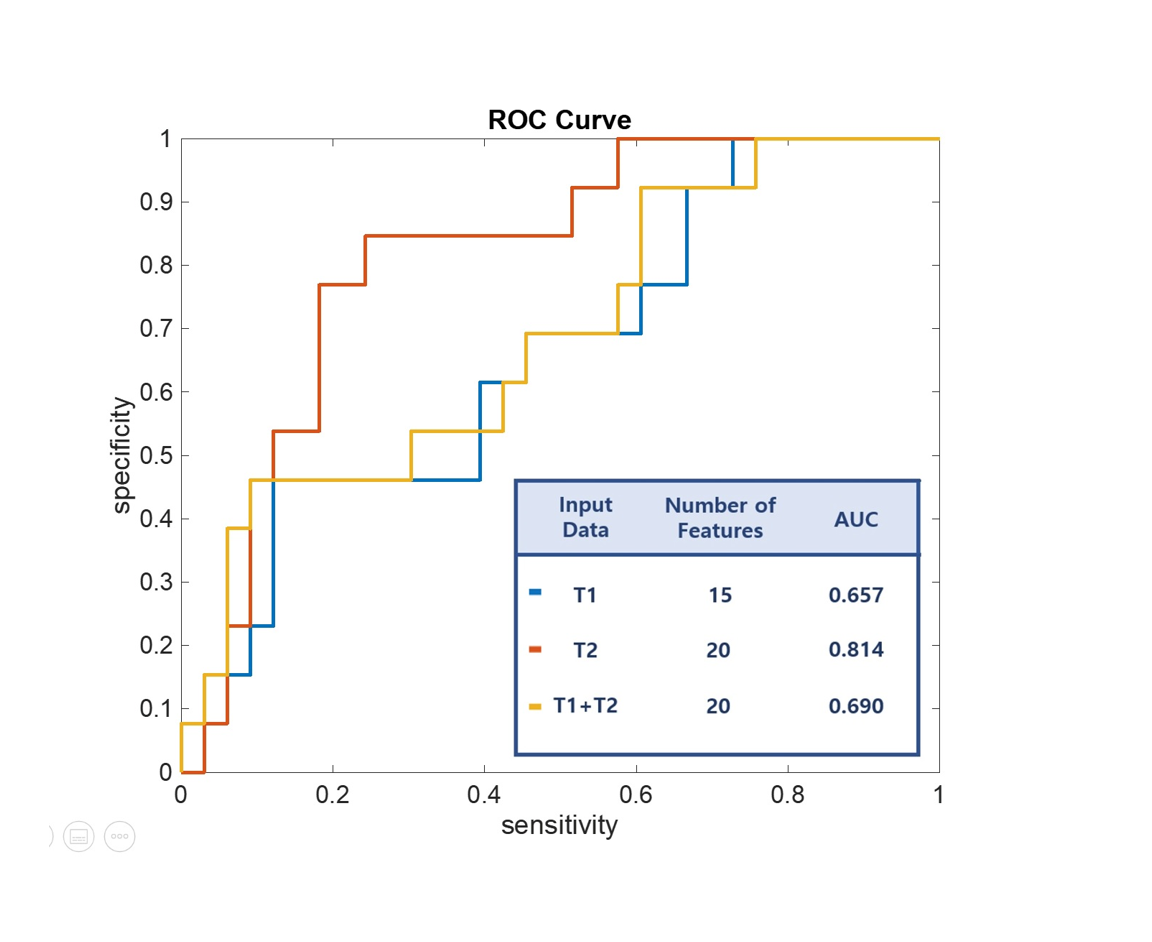
The top ten features that were relevant to predict poor outcome using T1- and T2-weighted images are shown in Figure 2. The most significant feature was side-zone non-uniformity of GLSZM of the original images using T1-weighted images and first-order Kurtosis of the original images using T2-weighted images. Wavelet-transform-based features were ranked high for T1-weighted images, while LoG-based features were ranked high for T2-weighted images. For the AUC assessment, the top 15, 20, and 20 features were used using T1-weighted images, T2-weighted images, and both T1- and T2-weighted images, respectively. The highest AUC of 0.814 was obtained using T2-weighted images for prediction of poor outcome in preterm neonates (Figure 3). The AUCs using T1-weighted images and both T1- and T2-weighted images were 0.657 and 0.690, respectively.Discussion
In this prospective cohort of preterm neonates, we demonstrated that radiomics feature of white matter on T1- and T2-weighted images can be used to predict poor neurodevelopmental outcome in preterm neonates using their brain MRI. The study result is especially meaningful as the radiomics analysis predicted the outcome of the preterm neonates who did not show structural abnormality or other known risk factors of poor outcome such as intracranial hemorrhages. These findings should assist families of preterm neonates and will improve our ability to identify neonates for early developmental interventions.Acknowledgements
This study was funded in part by the National Research Foundation of Korea Grant funded by the Korean Government (2017R1D1A1B03034768).References
1. Saigal S, Doyle LW. An overview of mortality and sequelae of preterm birth from infancy to adulthood. Lancet. 2008;371(9608):261–269.
2. Adams E, Chau V, Poskitt KJ, et al. Tractography-based quantitation of corticospinal tract development in premature newborns. The Journal of pediatrics. 2010;156(6):882-888
3. Kim HG, Moon WJ, Han J, et al. Quantification of myelin in children using multiparametric quantitative MRI: a pilot study. Neuroradiology. 2017;59(10):1043–1051.
4. van Griethuysen, J. J. M., Fedorov, A., et al. Computational Radiomics System to Decode the Radiographic Phenotype. Cancer Research. 2017;77(21), e104–e107.
5. Guo, T., Duerden, E. G., Adams, E., et al. Quantitative assessment of white matter injury in preterm neonates: Association with outcomes. Neurology. 2017;88(7):614–622.
Figures