4648
Morphometric Similarity Better Predicts Later Cognition in Paediatric Traumatic Brain Injury than Single Structural Features1School of Life and Health Sciences & Aston Neuroscience Institute, Aston University, Birmingham, United Kingdom, 2Department of Clinical Neurophysiology, Birmingham Women’s and Children’s Hospital NHS Foundation Trust, Birmingham, United Kingdom, 3Brain and Mind Research, Clinical Sciences, Murdoch Children’s Research Institute, Melbourne, Australia, 4Department of Psychology, Royal Children’s Hospital, Melbourne, Australia, 5School of Psychology, Faculty of Health, Melbourne Burwood Campus, Deakin University, Geelong, Victoria, Australia
Synopsis
Neuroanatomical correlates of long-term cognitive impairment after a paediatric traumatic brain injury are not established. Acutely acquired T1w MPRAGE MRI scans were used to calculate morphometric similarity between cortical areas. A supervised learning approach showed that, after cross-validation, morphometric similarity explained 12% variance in cognitive functioning two-years post-injury, beyond that of individual structural features. Thus, morphometric similarity is a useful approach to understand the diffuse effects of neurological insult on the still-developing brain and how this may predict later neuropsychological functioning.
Introduction
Paediatric traumatic brain injury (pTBI) often results in lasting cognitive impairment, particularly executive dysfunction. Identification of those individuals who will experience clinically-significant impairment is a key goal of neuroimaging in this field1. However, evidence of the neuroanatomical correlates of this executive function (EF) impairment is limited to studies that treat morphometry of multiple ROIs as distinct, independent features, rather than as a complex network of an interrelated whole. Morphometric similarity captures the meso-scale similarity between cortical areas as the statistical association between multiple morphometric features2, as an index of whole-brain, meso-scale cortical oragnisation. Morphometric similarity may be an effective biomarker of pTBI because; i) morphometric similarity varies as a function of neurodevelopmental disorders3-5, ii) is in keeping with recent characterisations of TBI as a diffuse disorder of connectivity6 and iii) can be estimated from a relatively restricted MRI acquisition7 (T1w MPRAGE only). Therefore, morphometric similarity across the cortex presents a novel analytical tool with which to investigate the neuroanatomical changes that occur post pTBI8 which are related to later cognitive impairment. We aimed to compare morphometric similarity between pTBI patients and controls to investigate whether a pattern of morphometric similarity was predictive of later cognition.Methods
MRI brain (Siemans Trio Tim 3T) scans were acquired in the early post-injury period (1-88 days) in 83 child survivors of pTBI and 33 typically developing (TD) controls. The standard acquisition sequence included a sagittal three-dimensional (3D) MPRAGE [TR = 1900 ms; TE = 2.15 ms; IR prep = 900 ms; parallel imaging factor (GRAPPA) 2; flip angle 9 degrees; BW 200 Hz/Px; 176 slices; resolution 1 × 1 × 1 mm], sagittal 3D T2Weighted non-selective inversion preparation SPACE (Sampling Perfection with Application-optimised Contrast using different flip-angle Evolution) [TR = 6000 ms; TE = 405 ms; inversion time (TI) = 2100 ms; water excitation; GRAPPA Pat2; 176 slices; 1 × 1 × 1 mm resolution matched in alignment to the 3D vT1-weighted sequence]. MPRAGE T1 images were preprocessed using the validated Freesurfer (v6.0) pipeline for skull-stripping, 3D segmentation, and tissue-class boundary estimation9. FLAIR sequences were used to optimize classification of tissue boundaries. Cortical thickness measurements were calculated for regions of the Desikan-Killiany atlas10. Morphometric features (parcellated to the Desikan-Killany atlas) included cortical thickness, surface area, mean curvature, gaussian curvature, folding index, curvature index and grey matter volume for each participant can be expressed as a set of n vectors of length 10, with each vector as a different anatomical region (n = 68), and each element of the vector a different morphometric measure. Each of these morphometric features is normalized across the 68 regions, using Z-scores (demeaned and SD scaled) and a correlation matrix is generated for each participant.Each element of the matrix is the morphometric similarity between these regions, quantified as the correlation between the feature vectors for every possible pairwise combinations of regions. These matrices were density thresholded and for each node/ROI, we calculated both nodal degree and nodal strength as indexes of the magnitude of morphometric similarity. Executive functioning (EF) was measured two years post injury using standard neuropsychological tasks and parent-report measures (i.e. Behaviour Rating Inventory of Executive Functions - BRIEF11). Partial least squares regression12 was used as a supervised learning approach to predict EF from nodal degree and nodal strength. We conducted similar predictions using the individual morphometric features at each region as the predictors, to determine whether morphometric similarity provided greater information for prediction than the individual features alone.Results
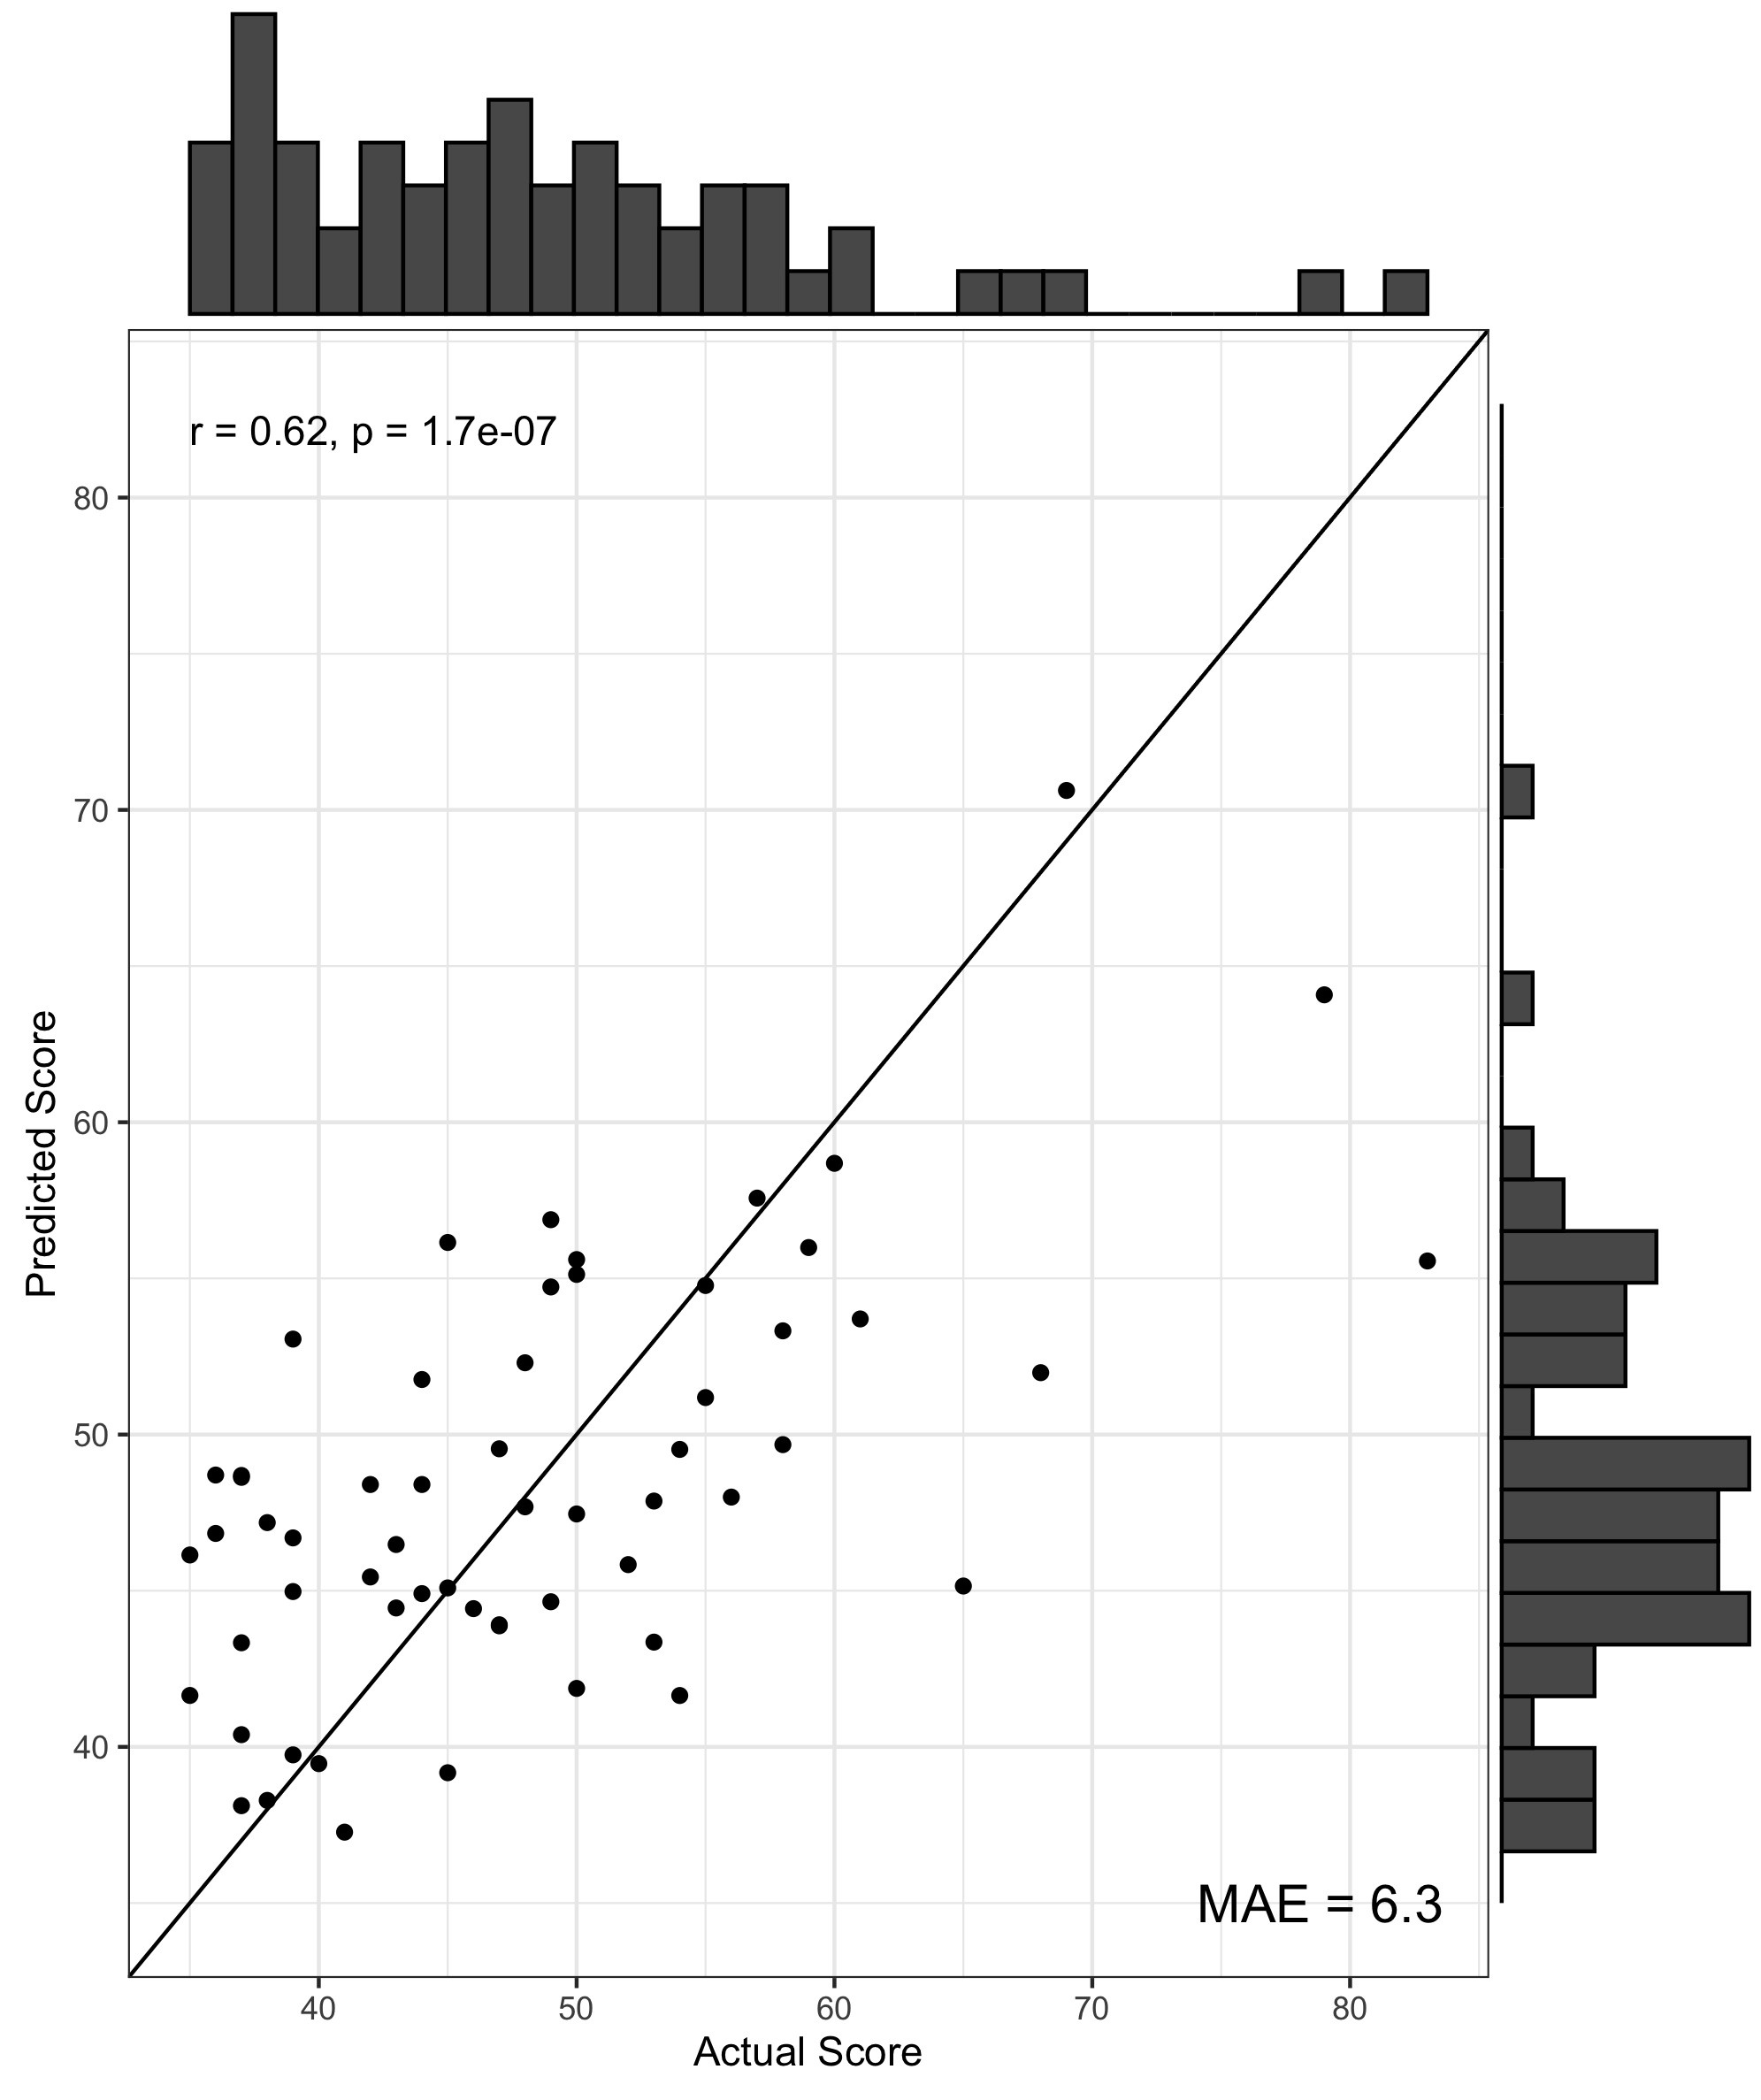
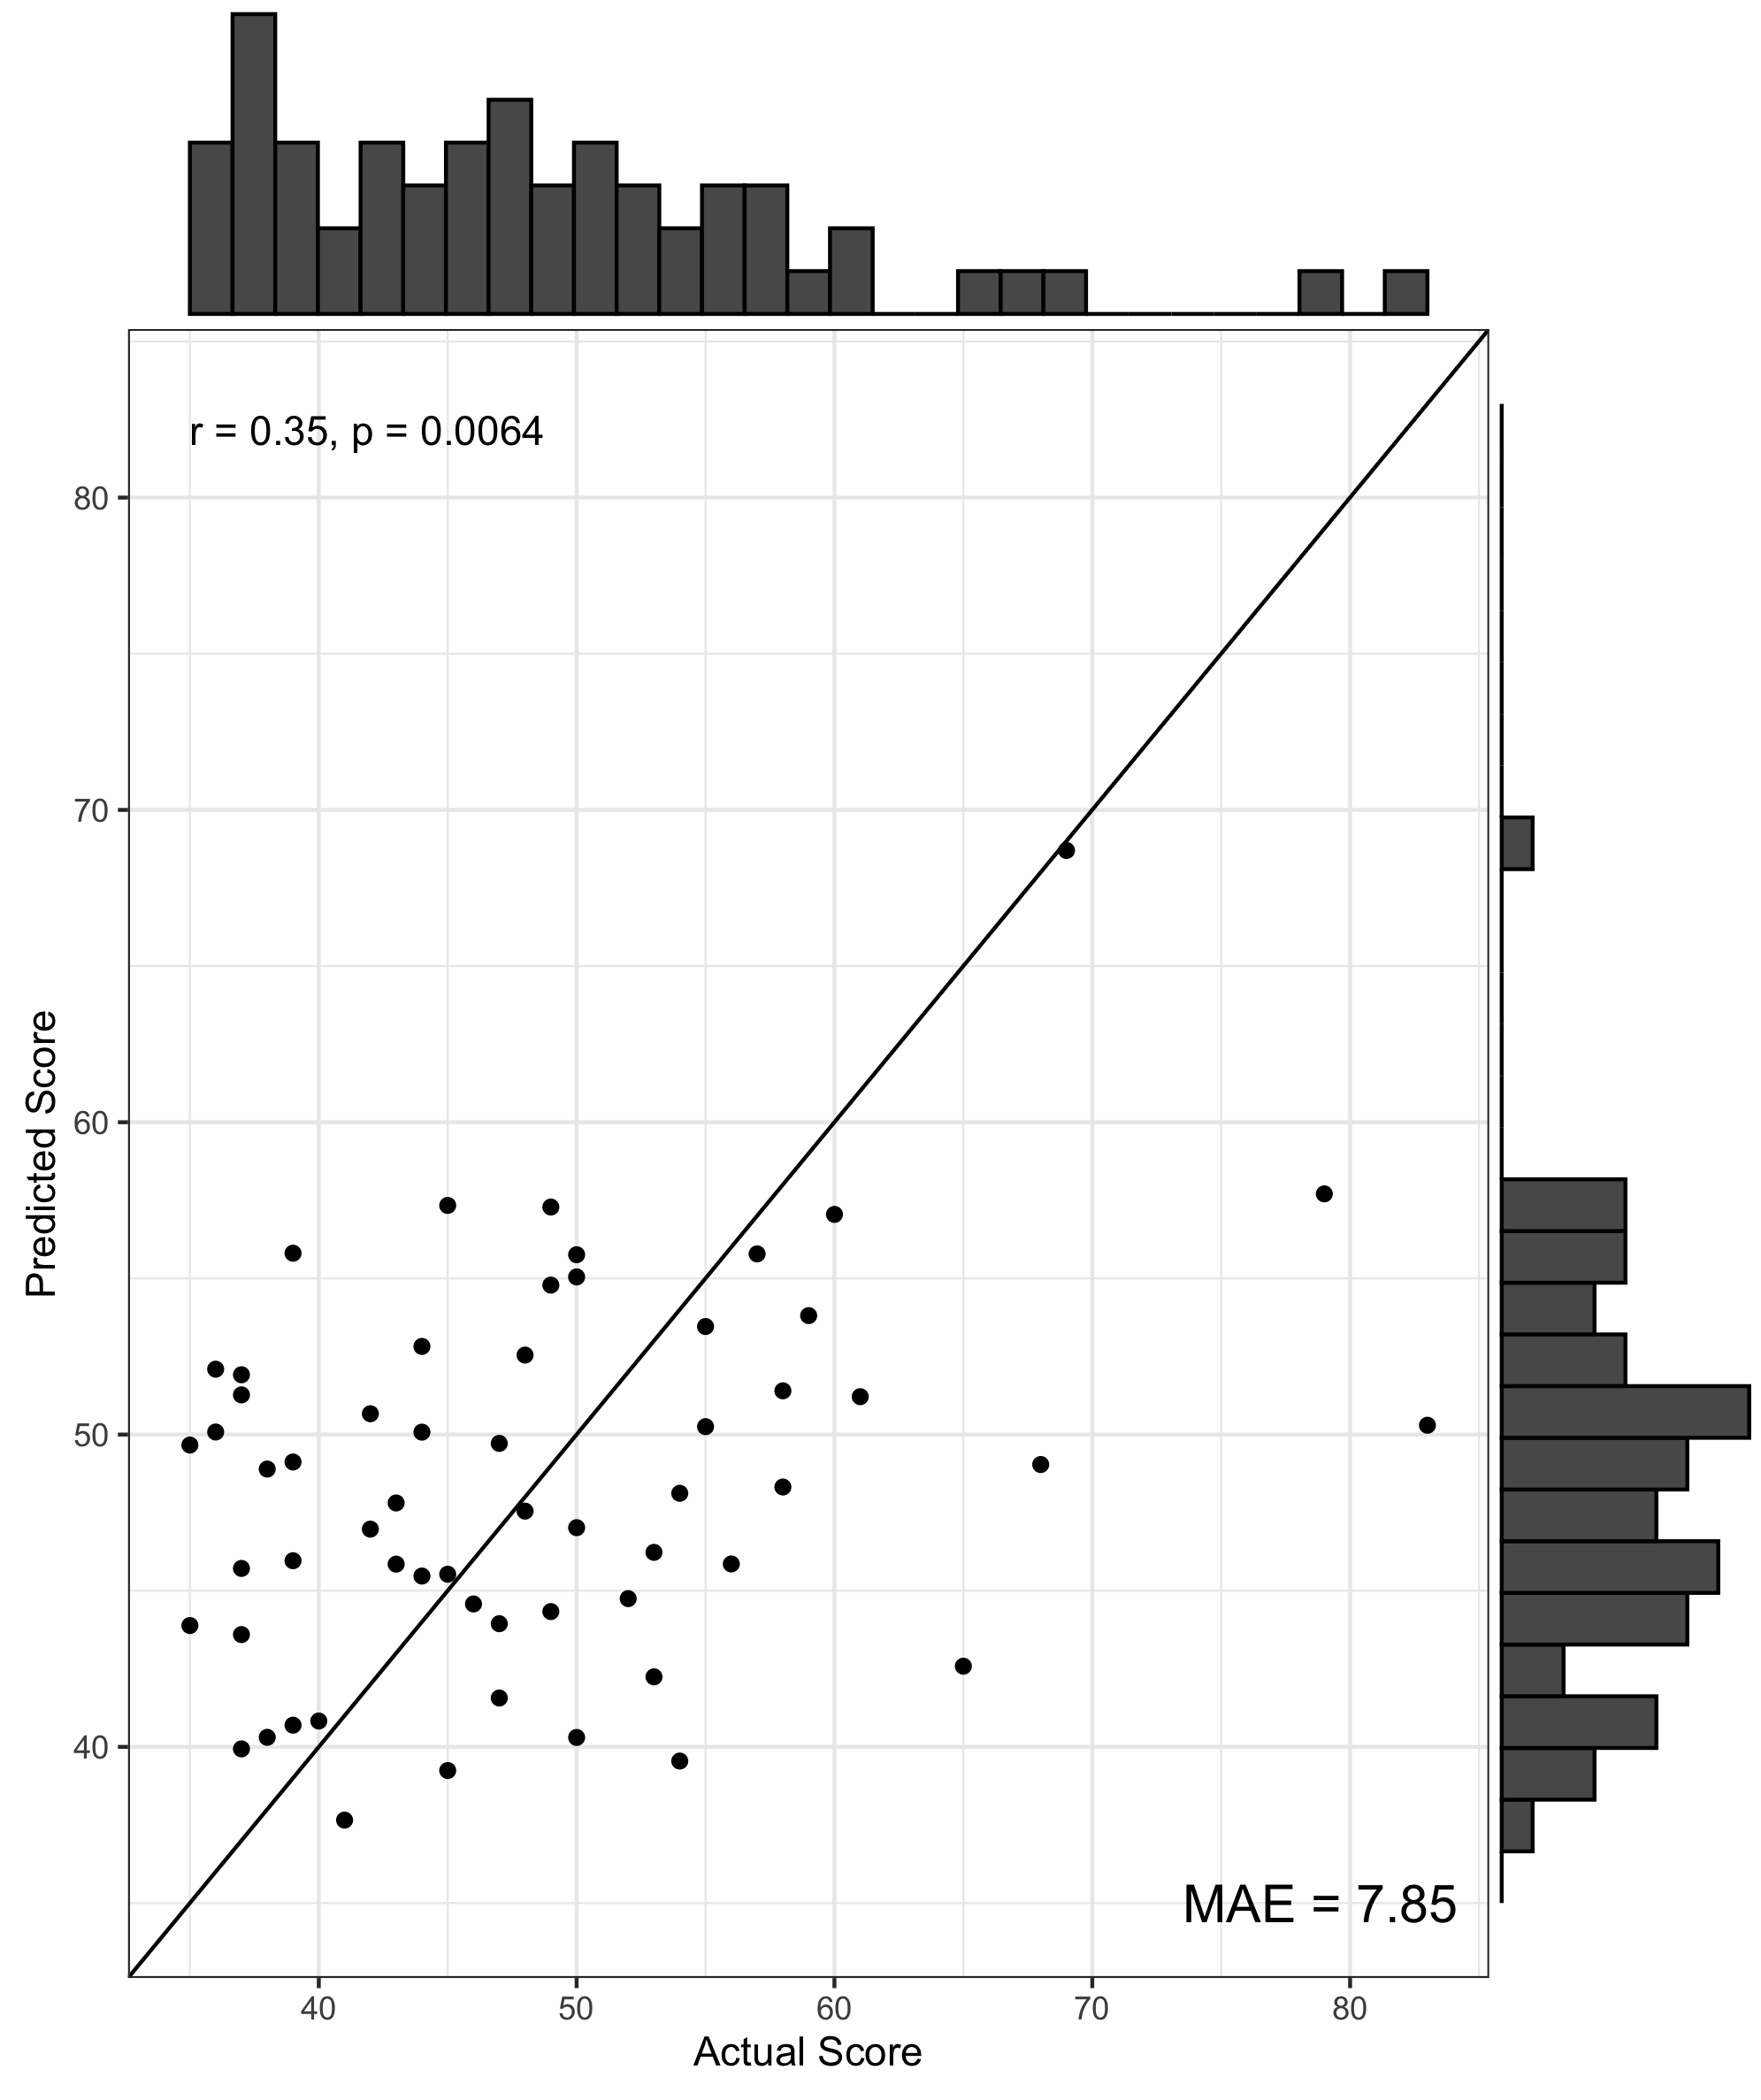
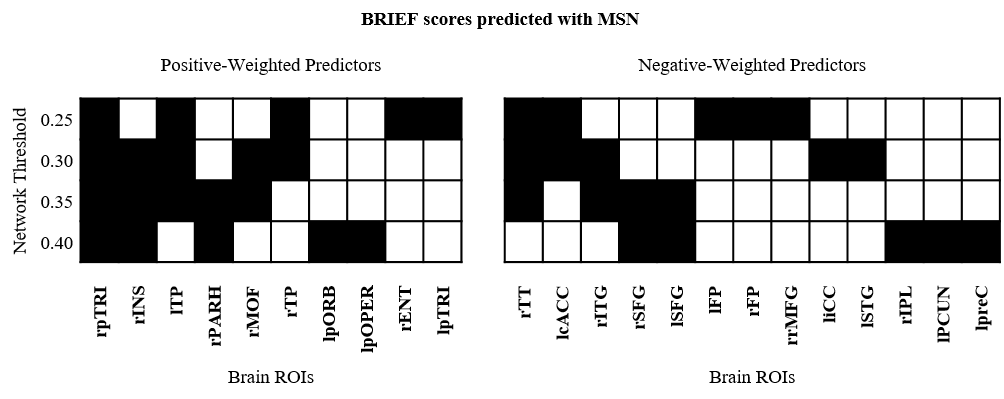
We found no significant differences in morphometric similarity between pTBI patients and controls, even across multiple subgroup analyses (e.g. injury severity, impaired vs unimpaired). However, across multiple network densities, a model of nodal degree predicted parent-reported EF in patients. In these models, highly significant positive correlations were found between actual and predicted BRIEF scores, with the PLS models explaining around 40% variance in BRIEF scores (R2 = .36 - .42), with a relatively low error between predicted and actual scores (MAE = 6.08-6.49, Figure 1). When cross-validated using a leave-one-out approach the PLS model still explained around 10% variance in BRIEF (R2 = .07 - .12, MAE = 7.85-8.25, Figure 2). Regions with the strongest predictive utility (top five positive and negatively weighted predictors) were found across fronto-temporal regions (Figure 3). PLS models using individual morphometric features explained less variance in parental-reported EF than those using MS (R2 = .02 - .04, MAE = 8.03 -7.82).Discussion and Conclusion
Our results show convergence with previous work utilising multivariate methodologies to investigate the neuroanatomical correlates of EF, both using individual features in neurodevelopmental cohorts13 and morphometric similarity in an adult population14. These results highlight that the morphometric similarity approach is a methodology with which we can capture information about the brain’s complex, meso-scale structural organization, and quantify the disruption to the highly programmed developmental trajectory of the cortex in populations where this can be disrupted. The current study highlights that morphometric similarity not only provides additional insights to brain morphometry compared to previous approaches, but also possesses the potential to predict more accurately clinically relevant, functional outcomes.Acknowledgements
AW is supported by a European Research Council Consolidator Fellowship (ERC-CoG2015-PROBIt-682734).References
1. Irimia A, Wang B, Aylward SR, et al. Neuroimaging of structural pathology and connectomics in traumatic brain injury: Toward personalized outcome prediction. NeuroImage Clinical 2012;1:1-17.
2. Seidlitz J, Vasa F, Shinn M, et al. Morphometric Similarity Networks Detect Microscale Cortical Organization and Predict Inter-Individual Cognitive Variation. Neuron 2018;97:231-247 e237.
3. Zheng W, Eilamstock T, Wu T, et al. Multi-feature based network revealing the structural abnormalities in autism spectrum disorder. IEEE Transactions on Affective Computing 2019:1-1.
4. Galdi P, Blesa M, Sullivan G, et al. Neonatal Morphometric Similarity Networks Predict Atypical Brain Development Associated with Preterm Birth. 2018;10842:47-57.
5. Seidlitz J, Nadig A, Liu S, et al. Transcriptomic and Cellular Decoding of Regional Brain Vulnerability to Neurodevelopmental Disorders. BioRxiv 2019.
6. Hannawi Y, Stevens RD. Mapping the Connectome Following Traumatic Brain Injury. Current Neurology and Neuroscience Reports 2016;16.
7. King DJ, Wood A. Clinically-Feasible Brain Morphometric Similarity Network Construction Approaches with Restricted Magnetic Resonance Imaging Acquisitions and their Relationship with Cognition. PsyArXiv 2019.
8. King DJ, Ellis KR, Seri S, Wood AG. A systematic review of cross-sectional differences and longitudinal changes to the morphometry of the brain following paediatric traumatic brain injury. NeuroImage: Clinical 2019:101844.
9. Fischl B. FreeSurfer. NeuroImage 2012;62:774-781.
10. Desikan RS, Segonne F, Fischl B, et al. An automated labeling system for subdividing the human cerebral cortex on MRI scans into gyral based regions of interest. NeuroImage 2006;31:968-980.
11. Gioia GA, Isquith PK, Guy SC, Kenworthy L. Behavior Rating Inventory of Executive Function. Odessa, FL: Psychological Assessment Resources, 2000.
12. Bertrand F, Maumy-Bertrand M. plsRglm: Partial least squares linear and generalized linear regression for processing incomplete datasets by cross-validation and bootstrap techniques with R. Arxiv 2018.
13. Ziegler G, Dahnke R, Winkler AD, Gaser C. Partial least squares correlation of multivariate cognitive abilities and local brain structure in children and adolescents. NeuroImage 2013;82:284-294.
14. He N, Rolls ET, Zhao W, Guo S. Predicting human inhibitory control from brain structural MRI. Brain imaging and behavior 2019.
Figures