4647
Age-related changes of the extracerebral space in normal infants observed with 3D T2 MR images1Baoji Central Hospital, Baoji, China, 2MR Research China, GE Healthcare, Beijing, China
Synopsis
External hydrocephalus (EH) can cause poor prognosis, but there is no consensus exists on diagnostic criteria for pathological EH in infants and young children. In this study, we measured extracerebral space of 212 healthy subjects on different anatomical slices and their age correlation were analyzed. The results demonstrated that extra cerebral space measured at different position on axial plane features similar age-related changes. The results of this study may be a valuable reference in diagnosis of external hydrocephalus.
Introduction
During infancy, active brain development can cause the volume and shape of skull, brain change significantly between adjacent months, and the extracerebral space of corresponding parts will also change accordingly. External hydrocephalus (EH) is a special type of hydrocephalus, which is defined as the rapid increase of head circumference in infants without intracranial pressure, accompanied by the widening of corresponding extracerebral space, with or without mild enlargement of ventricles1, which can cause adverse prognosis2. Therefore, it is of great clinical significance to distinguish benign from pathological widening of the extracerebral space. However, to date, there is no consensus exists on diagnostic criteria for pathological external hydrocephalus. There is a partial overlap between benign extracerebral space widening and pathological (EH) in terms of diagnostic criteria3. Utilizing high resolution 3D magnetic resonance imaging (MRI) technique, in this study, we studied the age-related changes of the normal children's extracerebral space. By studying the age-related distribution of these distance markers, we hope to identify the pattern of extracerebral space underline the brain development for healthy infants. With the hypothesis that the distance markers for pathological external hydrocephalus would be classified outside of aforementioned pattern, our results could also be provided as a basis for differentiating benign from pathological enlargement of extracerebral space in clinical practices.Methods
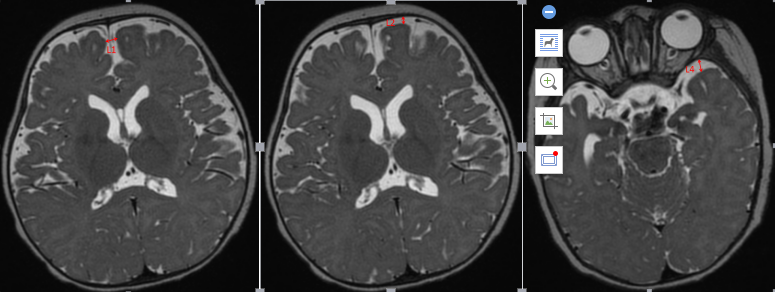
The Institutional Review Board approved this study and all the written informed consents were obtained from parents of infants and children. 212 healthy infants without any neurological impairment were included. The ages of the subjects ranged from 0 to 36 months with a median age of 8 months. All subjects underwent magnetic resonance (MR) examination on a 3.0T MRI scanner (Discovery 750W; GE Medical system, Milwaukee, WI)) equipped with an 8-channel brain coil. A sagittal 3D T2 fast spin echo sequence with variable flip angle (3D CUBE) was used to cover whole brain. The detailed scan parameters of CUBE were: XXX. The sagittal T2 images were later reconstructed to axial images. The measurement was taken at width of the left and right anterior frontal space, the left and right anterior temporal space and the width of the longitudinal cerebral fissure were measured at the level of the interventricular foramen (Montessori's foramen) on the reconstructed axial T2WI(Figure 1). The average value was taken at each part of each side twice. Using SPSS18.0 statistical software, the data of each group's extracerebral space were tested by single sample Kolmogorov Smirnov test, and the results were expressed as mean ± standard deviation; using scatter plot to fit loess curve, quadratic regression curve and 95% confidence interval, the change rule of the width of each group's extracerebral space with age was observed; all statistical results were statistically significant with P < 0.05 as the difference Significance.Result
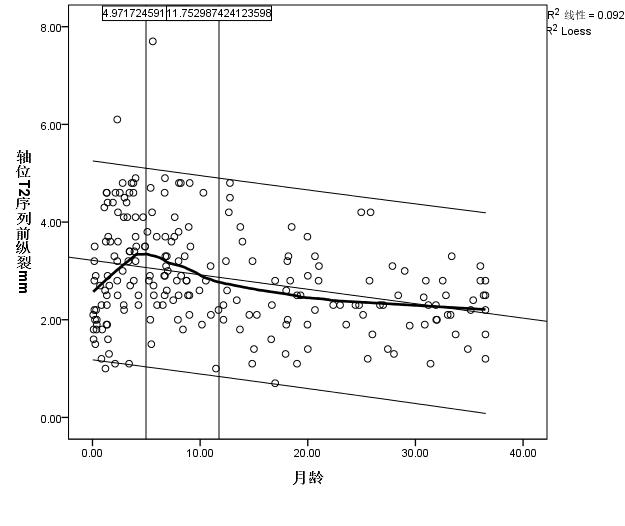
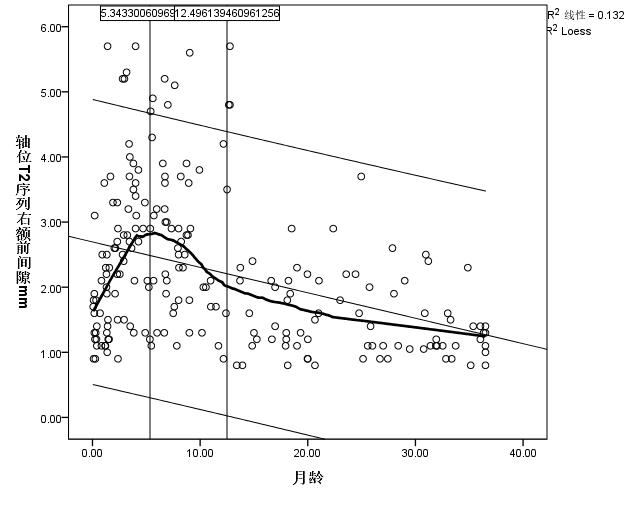
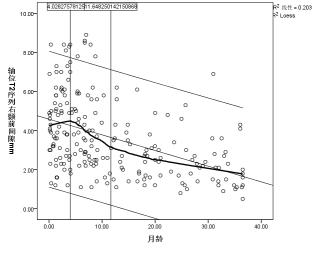
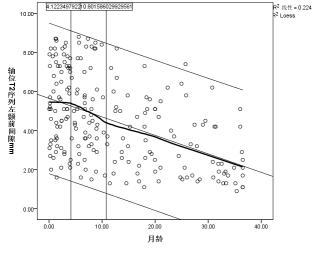
Axial position of T2 cube sequence was used to measure the age-related changes of the extracerebral space: the curves of age-related changes of the anterior longitudinal fissure, the right prefrontal space, the left prefrontal space, the right prefrontal space, and the left prefrontal space all increased first and then decreased, and finally became stable, with two turning points: the first turning point was at the peak of the curve (5.0 months, 5.3 months, 4.9 months, 4.0 months, and 4.1 months), the second turning point The break point is located at the place where the curve tends to be gentle (11.7months, 12.5months, 15.2months, 11.6months and 10.8months).(Figure 2a-e)Discussion and Conclusion
Most previous study measured the extracranial space through distance markers solely on axis plane or coronal plane. Previous studies indicated that although they seem to have similar trends, they do differ from one another. From this perspective, high resolution 3D measurement maybe preferred, because axial as well as coronal plane can be obtained in one acquisition, which may help in accurate measurement of extracerebral space.Our results have shown that there are two distinct changes in the extracerebral space measured at axial positions with month age. The extracerebral space increases with age, turn to downwards after reaching the first turning point, after the second turning point, the extracerebral space seems no longer changes significantly, for example, after age of 1.5 years.The change of extracerebral space was first widened, then narrowed, and finally tended to balance with the increase of age. The results of this study may be a valuable reference in diagnosis of external hydrocephalus.
Acknowledgements
No acknowledgement found.References
1.Tucker J, Choudhary AK, Piatt J. Macrocephaly in infancy: benign enlargement of the subarachnoid spaces and subdural collections[J]. J Neurosurg Pediatr. 2016,18(1):16-20.
2.Zahl SM, Egge A, Helseth E, et al. Benign external hydrocephalus: a review, with emphasis on management[J]. Neurosurg Rev. 2011,34(4): 417-432.
3.Halevy A, Cohen R, Viner I, et al. Development of Infants With Idiopathic External Hydrocephalus[J]. J Child Neurol 2015,30(8): 1044-1047.
Figures