4646
The ratio of T1 and T2 signals of MRI improves the diagnostic value of early hyperbilirubinemia brain damage in neonates1The First Affiliated Hospital of Dalian Medical University, Dalian, China, 2GE Healthcare, Beijing, China
Synopsis
Exposure to high levels of bilirubin can cause severe motor symptoms and cerebral palsy. The aim of this study was to analyze the diagnostic value for early brain damage caused by hyperbilirubinemia (HB) in neonates using T1-weighted imaging (T1WI) and T2-weighted imaging (T2WI).
Introduction
Bilirubin encephalopathy (BE) is the most serious complication of hyperbilirubinemia. Currently, there is no specific diagnostic indicators for early monitoring of its occurrence. The purpose of this study was to analyze the diagnostic value of quantitative values for early brain injury caused by hyperbilirubinemia (HB) in neonates using T1-weighted imaging (T1WI) and T2-weighted imaging (T2WI).Methods
Seventy-five cases of neonates with HB were retrospectively collected from October 2014 to March 2019 by PACS system, including 46 males and 29 females, median age of 9 days, mean weight (3.38±0.47) kg. All children were divided into two groups based on their globus pallidus(GP) T1WI signal intensity: including normal signal intensity group (HBn group ( Figure 1 ): 46 patients, 29 males, 17 females, median age of 9 days, mean weight (3.38±0.47) kg) and high signal intensity group (HBh group ( Figure 1 ) : 29 patients, 17 males and 12 females, median age 8 days, mean weight (3.36± 0.46) kg). In addition, forty-four healthy subjects (CON group) who matched the HB group by gender, age and weight were recruited, including 32 males and 12 females, with median age of 8 days and mean weight of (3.40±0.55) kg. The maximum levels of GP and frontal white matter (FWM )on T1WI and T2WI were selected and the ROI was manually selected. The signal intensity values of GP and FWM on both sides were measured three times to obtain the average value ( Figure 2 ); and the GP/FWM average signal intensity ratios of T1 and T2 were calculated (referred to as T1 ratio and T2 ratio). The differences of all parameters were assessed using multiple independent samples Krukal- Wallis H test among the three groups, while the ROC curve was used to determine the diagnostic performance of each parameter.Results
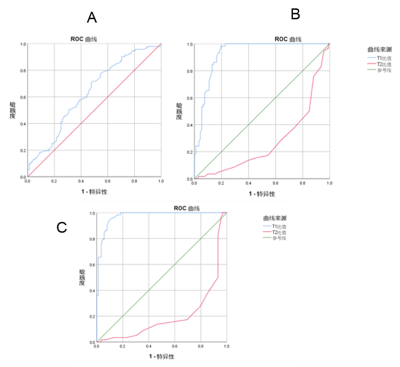
There was significant difference in T1 ratios among three groups (median ratios were 2.135, 2.405, 3.075, P < 0.05 after adjustment). In addition, the ROC curve analysis showed that when the T1 ratio was 2.675 as the threshold, the area under curve (AUC) between HBh group and CON group was the largest (0.973), and the sensitivity and specificity were 0.948 and 0.898, respectively( Figure 3 C). When the T1 ratio between HBn group and HBh group was 2.655, the AUC was the largest (0.926), and the sensitivity and specificity were 0.926 and 0.983, respectively ( Figure3 B). When the T1 ratio between HBn group and CON group was 2.155, the AUC value was the highest (0.633) with the sensitivity and specificity of 0.717 and 0.528, respectively ( Figure3 A). Furthermore, there were significant differences in T2 ratios among three groups (median ratios were 0.700, 0.690, 0.655, P < 0.05 after adjustment). ROC curve analysis showed that when T2 ratio was 0.595 as the threshold, the AUC of HBn group and HBh group was the largest (0.274), with sensitivity of 1.000 and specificity of 0.011 ( Figure3 B). When the T2 ratio between CON group and HBh group was 0.595, the AUC was 0.202, the sensitivity was 1.000, and the specificity was 0.034( Figure3 C). There was no obvious difference between CON group and HBn group (P < 0.05 after adjustment).Discussion and conlclusion
GP involvement is a well-known MRI finding of BE 1, 2. Some scholars used the signal intensity threshold of the GP to determine the occurrence of BE3,but there is lack of accuracy due to many factors. Therefore, in this study, the GP/FWM signal intensity ratio was used as a reference value. Our data indicated significant differences in T1 and T2 ratios between HBn group, HBh group and control subjects. In addition, when the T1 ratio was >2.155, although no lesions were visually observed, quantitative indicators showed early brain damage, with sensitivity and specificity up to 0.717 and 0.528, respectively. The difference in T2 quantized value is a new finding, which is different from previous research results3, 4. This quantitative index not only improves the detection of early lesions, but also provides more information for clinical evaluation of brain damage in the future.To sum up, the relative ratio of T1 and T2 in magnetic resonance imaging can be used to quantitatively diagnose brain damage in neonatal hyperbilirubinemia. This method is especially useful for the detection of early lesions that are invisible to the naked eye.
Acknowledgements
No acknowledgement found.References
1. Katar S, Akay HO, Taskesen M, et al.Clinical and cranial magnetic resonance imaging (MRI) findings of 21 patients with serious hyperbilirubinemia.J Child Neurol, 2008, 23 (4) :415-417.
2. Wu WL, Zhang P, Lou MW, et al.The application of DWI and MRIin bilirubin encephalopathy and hyperbilirubinemia of the newborn.JPract Radiol, 2011, 27 (8) :1242-1244.
3. Ruifang Yan,Dongming Han,Jipeng Ren, et al. Diagnostic value of conventional MRI combined with DTI for neonatal hyperbilirubinemia[J]. Pediatrics & Neonatology,2018,59(2):161-167
4. Xiaoyi Wang,Wulin Wu,Bob L. et al.Studying neonatal bilirubin encephalopathy with conventional MRI, MRS, and DWI[J]. Neuroradiology,2008,50(10) :885-893
Figures


