4645
Fibers and Neuroanatomy in the Left Hemisphere Are More Associated with Neonatal Death and 2-Year Outcome after Hypoxic Ischemic Encephalopathy1Fetal-Neonatal Neuroimaging Data Science Center, Boston Children's Hospital, Boston, MA, United States, 2Beijing University of Chinese Medicine, Beijing, China, 3Department of Pediatrics, Massachusetts General Hospital, Charlestown, MA, United States, 4Harvard Medical School, Boston, MA, United States, 5Department of Psychiatry, Massachusetts General Hospital, Charlestown, MA, United States, 6Department of Radiology, Boston Children's Hospital, Boston, MA, United States, 7Department of Radiology, Massachusetts General Hospital, Charlestown, MA, United States
Synopsis
Hypoxic ischemic encephalopathy affects ~5/1000 neonates and causes neonatal death and 2-year disability. Using neonatal MRI to predict neonatal and 2-year outcomes remains a key open question. However, expert scoring of neonatal MRI, the current norm, only focuses on a few key brain regions based on subjective clinical experience. We objectively and comprehensively examined the associations with neonatal and 2-year outcomes throughout the brain. Our new findings – many voxels, subregions and fibers that are not considered in expert scoring systems, with a left hemisphere dominance, were associated with outcomes – provide new knowledge for future individualized outcome prediction.
Purpose
Hypoxic ischemic encephalopathy (HIE) affects ~5/1000 neonates and cause death and disability[1–4]. Neonatal MRI has been used to infer 2-year outcome [5,6]. However, expert scoring of MRI, the current norm, looks for whether HIE lesions appear in a few key regions, and is subject to prediction errors [2,7]. We aimed to comprehensively and quantitatively portrait the lesion-outcome association at the voxel, subregional, fiber and hemispherical levels, while taking into consideration patient sex, age at MRI and treatment variables.Methods
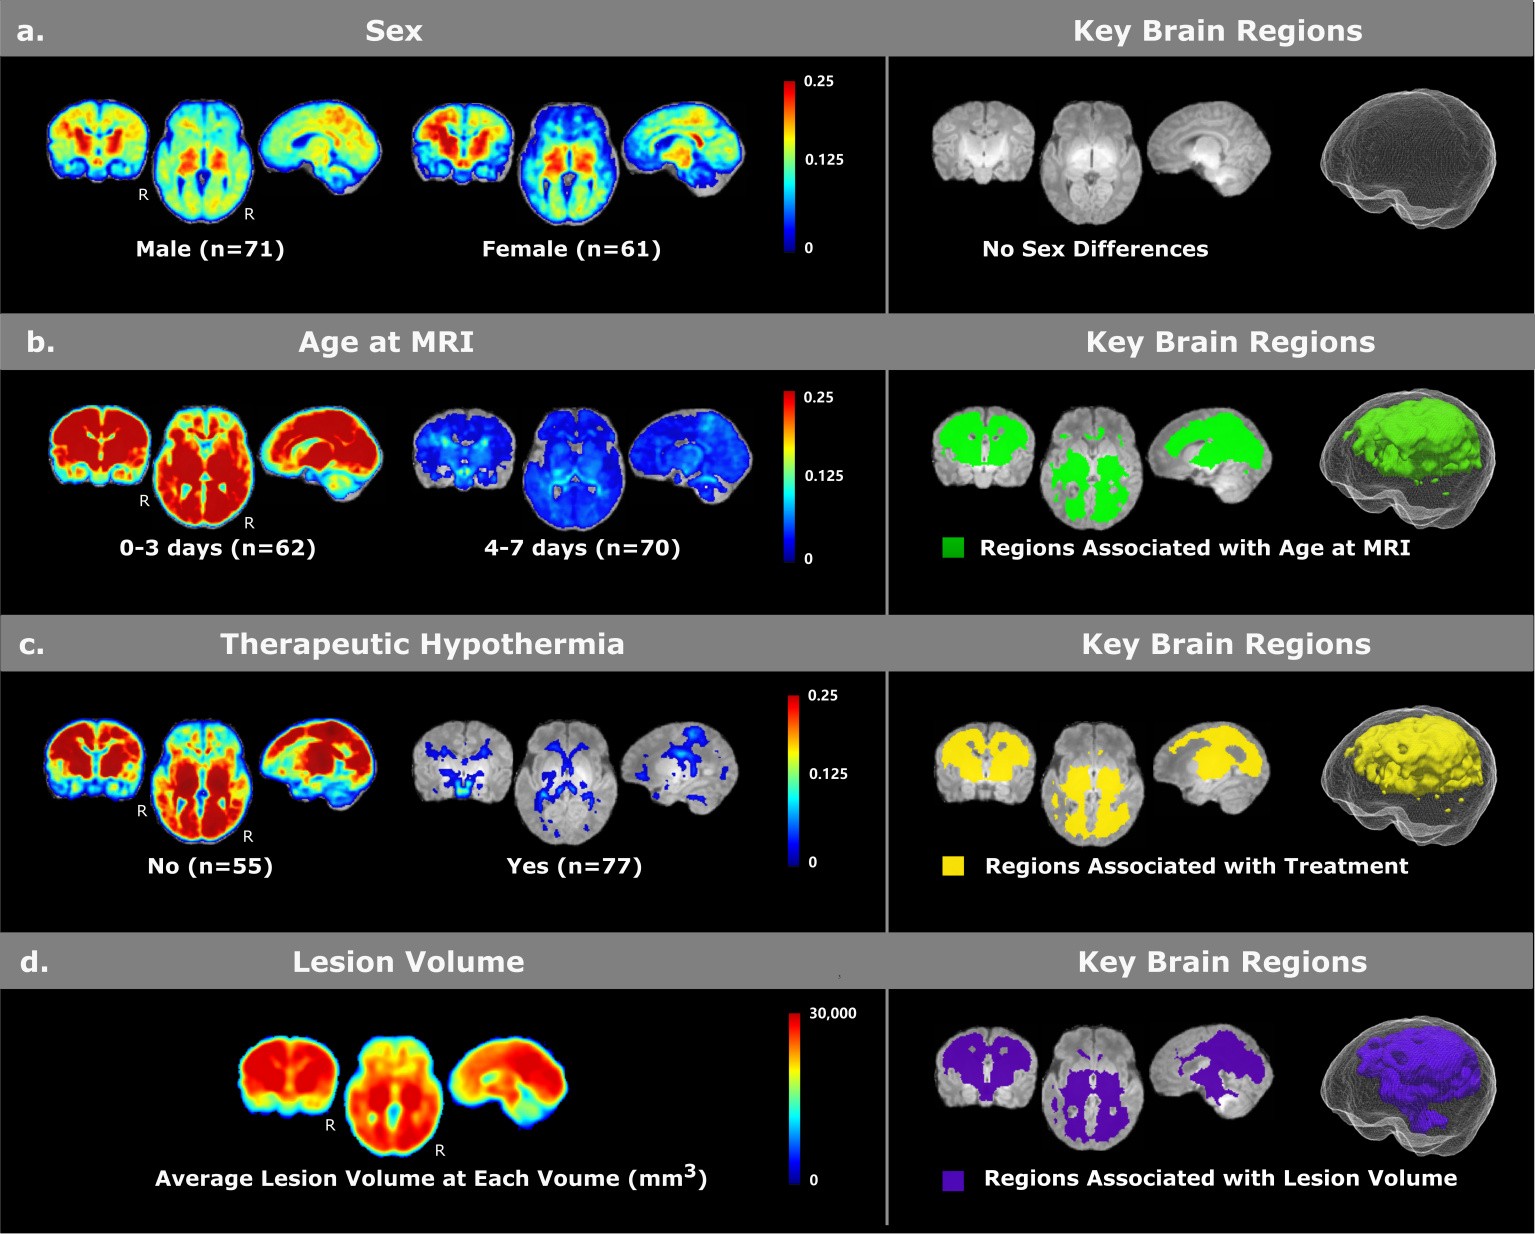
Data. This retrospective, IRB-approved study included 132 HIE patients cared at the Massachusetts General Hospital between 2008 and 2018. Inclusion criteria were: (a) term-born; (b) clinically-confirmed HIE; (c) no other neurologic co-morbidities; (d) structural and diffusion MRI scans with reasonable quality (visually checked by YO) obtained in the first week of life. Patients had a gestational age of 39.07±1.95 weeks, birth weight of 3284.49±610.69g, maternal age of 29.19±6.46 years and head circumferences of 34.15±1.58 cm. N=15 died during neonatal stage, and among 117 survivors, N=28 and N=26 had good and adverse 2-year outcomes respectively.Key Locations (voxel level). Lesions were manually-annotated on the Apparent Diffusion Coefficient maps by expert consensus. Patients’ ADC maps were non-rigidly transformed to our normal neonatal MPRAGE atlas[8], through concatenating same-patient ADC-MPRAGE rigid registration and patient-to-atlas MPRAGE non-rigid registration, by our registration tool[9] that has been extensively-validated for neonates and in the presence of abnormalities[10]. The binary lesion masks transformed to the MPRAGE atlas were averaged voxel-by-voxel to create the probabilistic lesion atlases. The same process was applied to each sub-cohort. We used voxel-wise lesion-symptom mapping (VLSM)[11], a statistical testing framework that studies whether a categorical variable (e.g., male or female, survive or deceased) is significantly associated with lesion presence at each voxel, or whether a continuous variable (e.g., lesion volume) is significantly associated with lesion presence at each voxel[11,12]. Significance at a voxel is defined if the association had p<0.05 after 10000 permutation tests controlling for false positives in multiple comparisons[13,14]. We used VLSM and first studied covariates – whether sex, age at MRI, treatment or not and lesion volume were associated with lesion presence at the voxel levels. Then, controlling for these covariates, we used VLSM and identified voxels significantly associated with neonatal outcome (death/survival) and with 2-year outcome (adverse/normal) among survivors.
Key Locations (regional and fiber levels). We overlaid the voxels found by VLSM on top of the 61 auto-segmented brain structures in our normal atlas in both hemispheres and reported the percentage of each brain structure that intersected with voxels found by VLSM. We also overlaid voxels found by VLSM with 28 major fiber bundles in the John Hopkins fiber atlases for age-matched healthy neonates [15] (after non-rigid transformation to our atlas), and reported the percentage of each fiber that intersected with voxels found by VLSM.
Hemispheric Asymmetry is defined if the same structure/fiber intersected with VLSM-found voxels with more than twice the volume in one hemisphere than in the other hemisphere.
Results
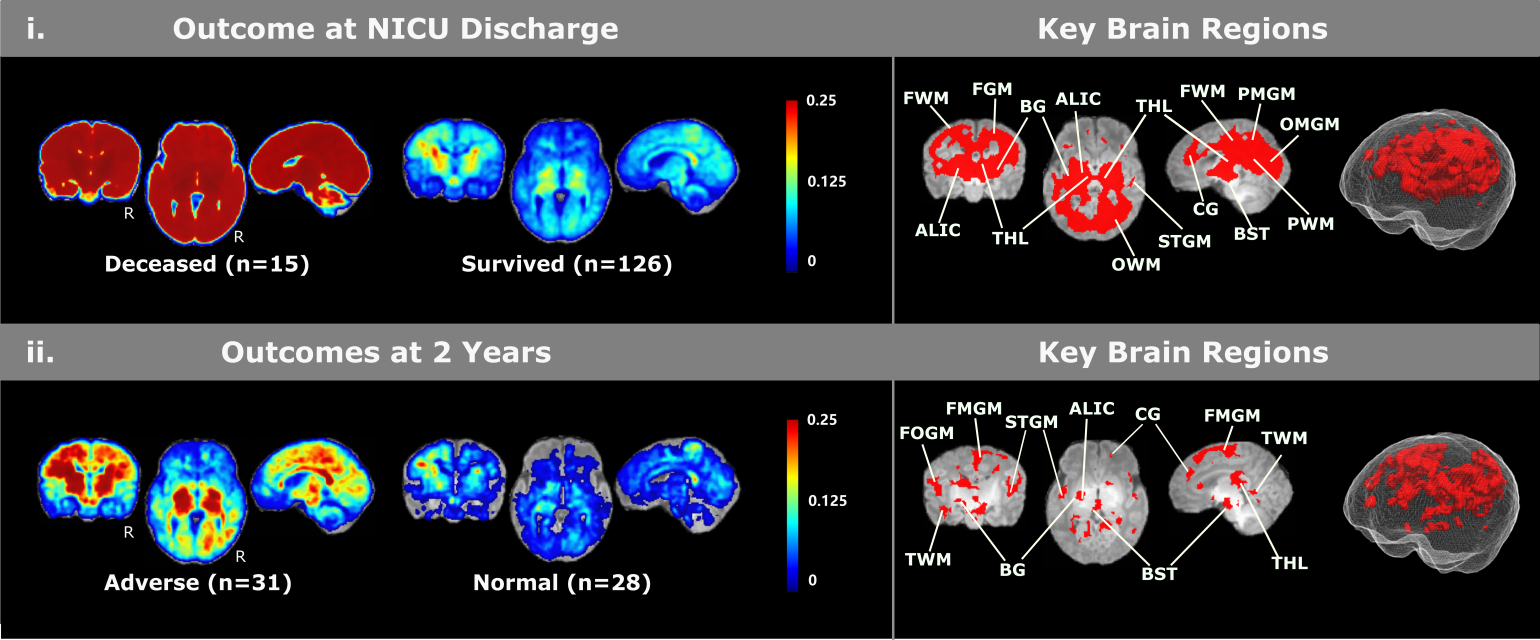
For covariate analyses (Figure 1), we found no sex differences for voxel-wise lesion occurrence (Figure 1a). Patients scanned on days 0-3 had more frequent HIE lesions than those who were scanned on days 4-7 (Figure 1b). Patients who underwent therapeutic hypothermia had less frequent lesions (Figure 1c). We also found that lesion volumes were significantly associated with lesion locations (Figure 1d) – if lesions appear the purple locations in Figure 1d, the patient was more likely to have a larger lesion volume.For lesion-outcome association at the voxel and regional levels (Figure 2, controlling for all four covariates), neonatal death was significantly associated with injuries in thalamus, basal ganglia, cingulate, internal capsules (ICs), frontal, parietal and occipital white matter (WM) as well as frontal, parietal medial and occipital medial gray matter (GM). Survivors with adverse 2-year outcomes had significantly more lesions in ICs, thalami, frontal opercular, parietal lateral and temporal supratemporal GM, and temporal WM.
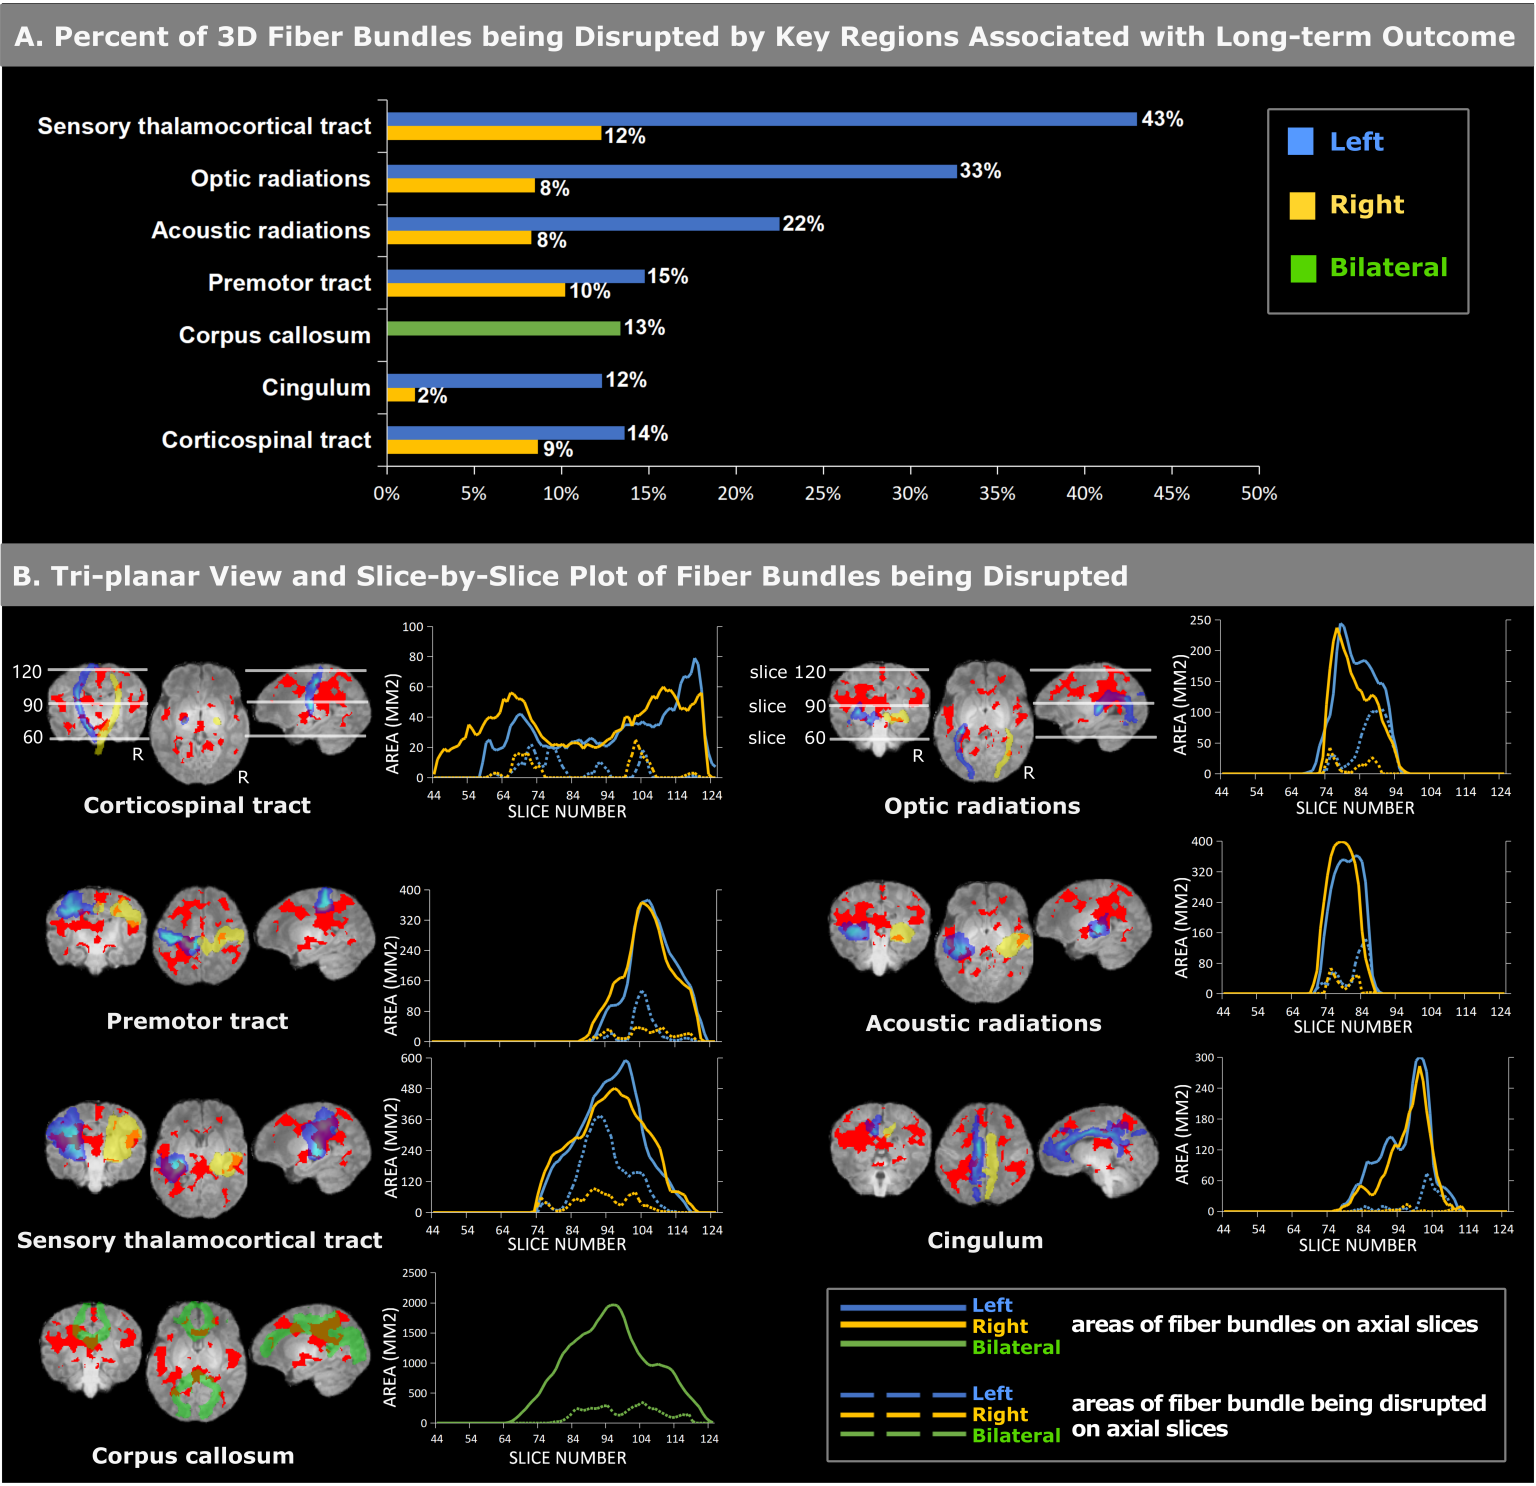
Figure 3 shows the fiber-level association and hemispherical asymmetry. Voxels associated with 2-year outcomes occupied >10% of the volumes of sensory thalamocortical tracts, optic radiations, acoustic radiations, premotor tracts, corticospinal tracts, cingular, and corpus callosum (Figure 3a), and showed a clear left-hemispheric dominance, considering the statistics along the whole fiber bundle (Figure 3a) or visualized slice by slice along the fiber bundles (Figure 3b).
Conclusion
This is the first study quantifying voxel-wise, regional and fiber-wise neural substrates, and the hemispherical asymmetry of neuroanatomic association with neonatal death and 2-year disability after HIE. Our new findings – more regions and fibers than currently scored by experts, and first report of left-ward hemispherical asymmetry – once validated in further larger-scale and multi-site studies, will provide quantitative evidence for individualized outcome prediction, which remains an open issue in HIE that is of great clinical and research interests.Acknowledgements
The work was partially funded by R01EB014947 (PIs: SNM, RLG and PEG), Thrasher Research Fund Early Career Development Award THF13411 (PI: YO), and Harvard Medical School/Boston Children’s Hospital Faculty Career Development Award (PI: YO). The authors would like to acknowledge Instrumentation Grants 1S10RR023401, 1S10RR019307, and 1S10RR023043 for providing support of the high-performance computing environment.References
1. Douglas-Escobar, M.; Weiss, M.D. Hypoxic-ischemic encephalopathy: a review for the clinician. JAMA pediatrics 2015, 169, 397–403.
2. Shankaran, S.; Barnes, P.D.; Hintz, S.R.; Laptook, A.R.; Zaterka-Baxter, K.M.; McDonald, S.A.; Ehrenkranz, R.A.; Walsh, M.C.; Tyson, J.E.; Donovan, E.F. Brain injury following trial of hypothermia for neonatal hypoxic–ischaemic encephalopathy. Archives of Disease in Childhood-Fetal and Neonatal Edition 2012, 97, F398–F404.
3. Tagin, M.A.; Woolcott, C.G.; Vincer, M.J.; Whyte, R.K.; Stinson, D.A. Hypothermia for neonatal hypoxic ischemic encephalopathy: an updated systematic review and meta-analysis. Archives of pediatrics & adolescent medicine 2012, 166, 558–566.
4. Ferriero, D.M. Neonatal brain injury. New England Journal of Medicine 2004, 351, 1985–1995.
5. Finer, N.N.; Robertson, C.M.; Richards, R.T.; Pinnell, L.E.; Peters, K.L. Hypoxic-ischemic encephalopathy in term neonates: perinatal factors and outcome. The Journal of pediatrics 1981, 98, 112–117.
6. Weeke, L.C.; Groenendaal, F.; Mudigonda, K.; Blennow, M.; Lequin, M.H.; Meiners, L.C.; van Haastert, I.C.; Benders, M.J.; Hallberg, B.; de Vries, L.S. A novel magnetic resonance imaging score predicts neurodevelopmental outcome after perinatal asphyxia and therapeutic hypothermia. The Journal of pediatrics 2018, 192, 33-40. e2.
7. Al Amrani, F.; Marcovitz, J.; Sanon, P.-N.; Khairy, M.; Saint-Martin, C.; Shevell, M.; Wintermark, P. Prediction of outcome in asphyxiated newborns treated with hypothermia: Is a MRI scoring system described before the cooling era still useful? european journal of paediatric neurology 2018, 22, 387–395.
8. Ou, Y.; Zöllei, L.; Retzepi, K.; Castro, V.; Bates, S.V.; Pieper, S.; Andriole, K.P.; Murphy, S.N.; Gollub, R.L.; Grant, P.E. Using clinically acquired MRI to construct age‐specific ADC atlases: Quantifying spatiotemporal ADC changes from birth to 6‐year old. Human brain mapping 2017, 38, 3052–3068.
9. Ou, Y.; Sotiras, A.; Paragios, N.; Davatzikos, C. DRAMMS: Deformable registration via attribute matching and mutual-saliency weighting. Medical image analysis 2011, 15, 622–639.
10. Ou, Y.; Akbari, H.; Bilello, M.; Da, X.; Davatzikos, C. Comparative evaluation of registration algorithms in different brain databases with varying difficulty: results and insights. IEEE transactions on medical imaging 2014, 33, 2039–2065.
11. Bates, E.; Wilson, S.M.; Saygin, A.P.; Dick, F.; Sereno, M.I.; Knight, R.T.; Dronkers, N.F. Voxel-based lesion–symptom mapping. Nature neuroscience 2003, 6, 448.
12. Rorden, C.; Karnath, H.-O.; Bonilha, L. Improving lesion-symptom mapping. Journal of cognitive neuroscience 2007, 19, 1081–1088.
13. Meyer, S.; Kessner, S.S.; Cheng, B.; Bönstrup, M.; Schulz, R.; Hummel, F.C.; De Bruyn, N.; Peeters, A.; Van Pesch, V.; Duprez, T. Voxel-based lesion-symptom mapping of stroke lesions underlying somatosensory deficits. NeuroImage: Clinical 2016, 10, 257–266.
14. Reynolds, A.M.; Peters, D.M.; Vendemia, J.M.; Smith, L.P.; Sweet, R.C.; Baylis, G.C.; Krotish, D.; Fritz, S.L. Neuronal injury in the motor cortex after chronic stroke and lower limb motor impairment: a voxel-based lesion symptom mapping study. Neural regeneration research 2014, 9, 766.
15. Oishi, K.; Mori, S.; Donohue, P.K.; Ernst, T.; Anderson, L.; Buchthal, S.; Faria, A.; Jiang, H.; Li, X.; Miller, M.I. Multi-contrast human neonatal brain atlas: application to normal neonate development analysis. Neuroimage 2011, 56, 8–20.
Figures