4640
Structural and Functional changes in ventral and dorsal stream during phonological and haptic language in early and late blind1NMR and MRI facility, All India Institute of Medical Sciences, New Delhi, India, 2RP centre, Opthalmology, All India Institute of Medical Sciences, New Delhi, India
Synopsis
Anatomical and functional MRI data for Braille and phonological noun pair assessment test was acquired in 40 early blind (EB), forty late blind (LB) subjects and thirty sighted controls (SC) in two age groups 6-12 years and 13-19 years (all right-handed). Visual impairment induces structural and functional modification in the visual cortex. Late blind subjects exhibited differences in the V1 13-19 years age range, but not in the 6-12 years age group. Duration of blindness and education influence the extent of plasticity of the V1 and language network.
Introduction
Visual deprivation during different developmental periods leads to different structural and functional alterations in the brain. However, the effects of visual deprivation on the spontaneous functional organization of the brain remain largely unknown. In this study, we used voxel-based functional connectivity density (FCD) analyses to investigate the effects of visual deprivation during different developmental periods on the spontaneous functional organization of the brain1,2. Onset of blindness and age of blindness may play a significant role in cortical thickness of occipital cortex.Objective
To observe the structural alteration and functional connectivity based on the age differences for haptic language task versus phonological task and if any changes persist, then correlation with duration of braille reading to recognise the aspect of alteration for the plasticity in visual area.Methodology
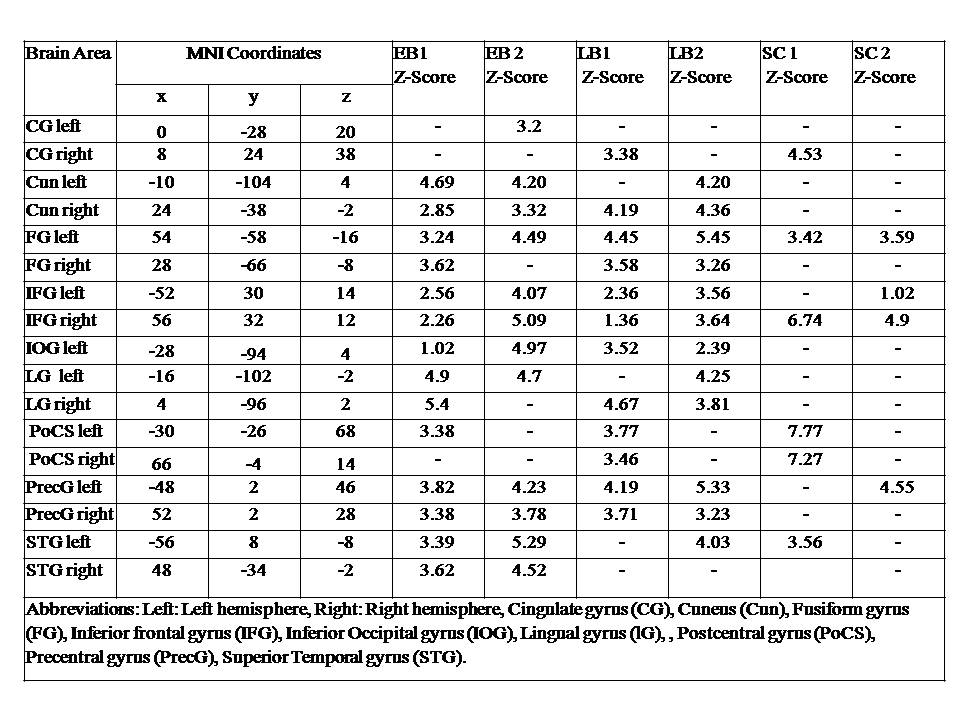
Forty early blind (EB) and Forty late blind (LB) subjects and thirty sighted controls (SC) in two age groups 6-12 years and 13-19 years (all right-handed) were recruited from the clinics of our institute (Table 1). Standard diagnostic and exclusion criteria were followed. Anatomical and functional data for Braille and phonological noun pair assessment test was acquired in a 3T MR scanner (Achieva 3.0T TX, Philips, Netherlands), with the following imaging parameters: slices per slab: 160, distance factor 50%, orientation: sagittal; slice thickness: 1mm; T1:1100ms; TR: 1900ms; TE: 3.37ms; averages: 1; FOV: 256mm, FOV phase: 93.8%; Base resolution: 256; Phase resolution 100; Phase encoding direction: A>>P; Band width: 130 Hz; echo spacing: 8.6ms. Data processing were carried out using SPM12 with the help of CAT12 and CONN toolbox3,4. The clusters were converted from MNI template to the Talairach and Tornoux coordinates, for estimation of anatomical areas5. Two-sample t-test and multiple comparison (post-hoc analysis) (p<0.001, cluster threshold 10) were used for inter-group comparisons.Result
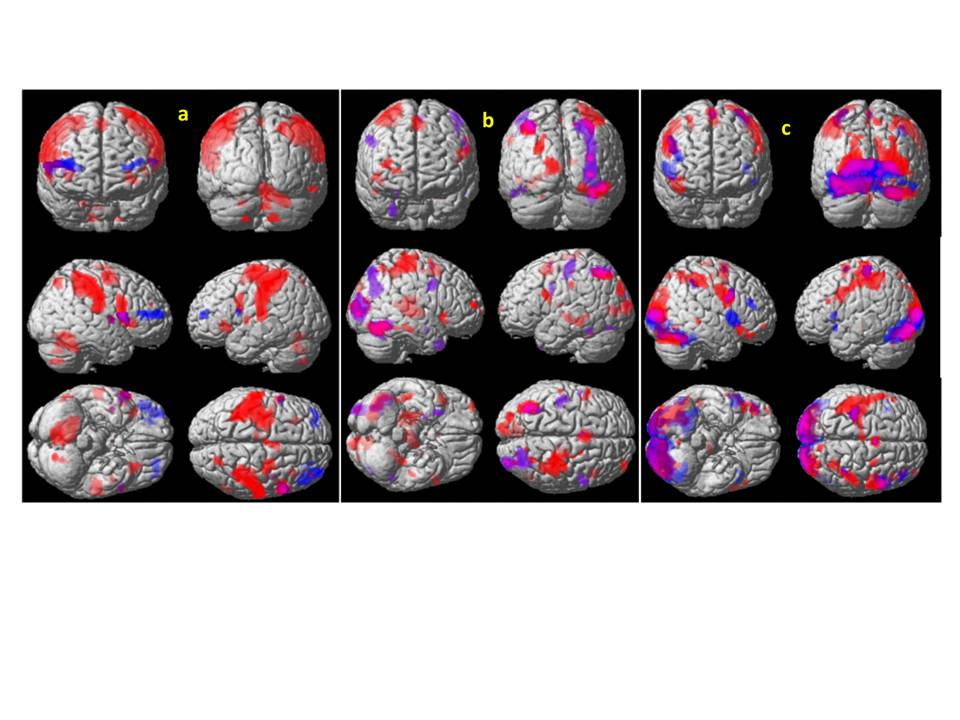
During phonological language task in early blind, bilateral superior frontal gyrus, left hemispheric middle frontal gyrus, para hippocampal gyrus, precuneus, superior temporal gyrus, thalamus and right cerebral cingulate gyrus, medial frontal gyrus exhibited BOLD activation. In late blind, bilateral activation in fusiform gyrus, para hippocampal gyrus, cuneus, post-central gyrus along-with right hemispheric thalamus, superior temporal gyrus, primary and auditory association cortex, dorsal posterior cingulate cortex, somatosensory association cortex, brainstem, lingual gyrus, superior frontal gyrus, and precentral gyrus, and left hemispheric inferior parietal lobule, insula, precuneus, cerebellum, primary somatosensory cortex, associative visual cortex (v3,v4,v5), premotor cortex and supplementary motor area, medial frontal gyrus were associated during the phonological task (Figure 1). During Braille reading task, in late blind bold activation was observed in right cuneus, inferior frontal gyrus, middle frontal gyrus, para hippocampal gyrus, precentral gyrus, superior frontal gyrus, superior temporal gyrus and left hemispheric fusiform gyrus, inferior parietal lobule, lingual gyrus, medial frontal gyrus, middle temporal gyrus, para hippocampal gyrus. Early blind subjects exhibited bilateral activation in superior temporal gyrus, precuneus in the two age groups. Right hemispheric lentiform nucleus, brainstem and left inferior parietal lobule, para hippocampal gyrus and left hemispheric medial frontal gyrus, para hippocampal gyrus, middle occipital gyrus, precuneus, thalamus, cerebellum, middle frontal gyrus were also active in both the groups.Discussion
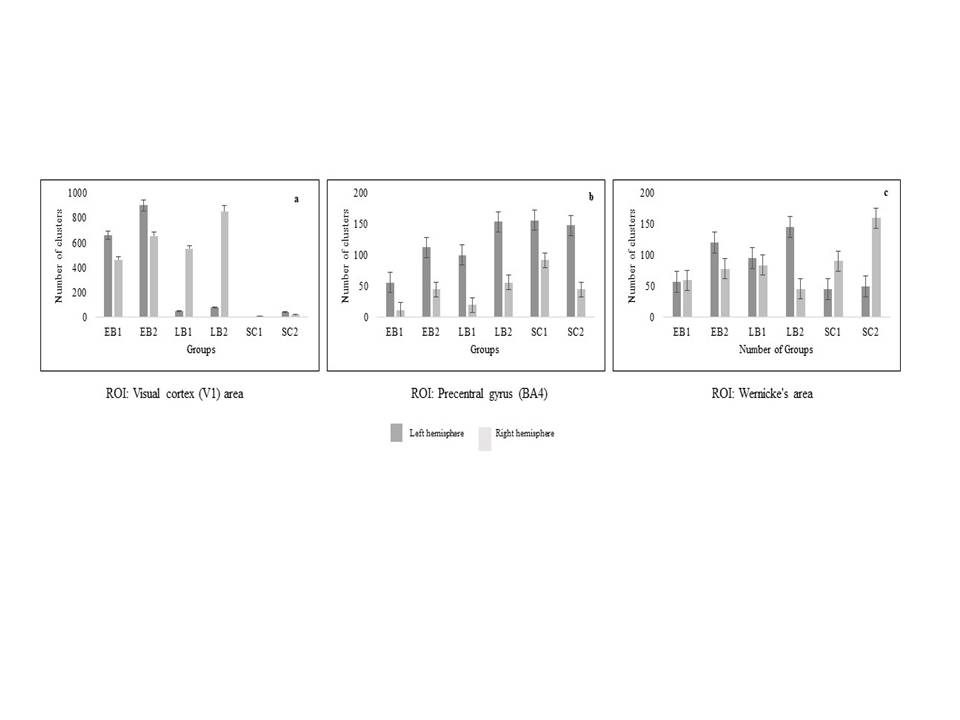
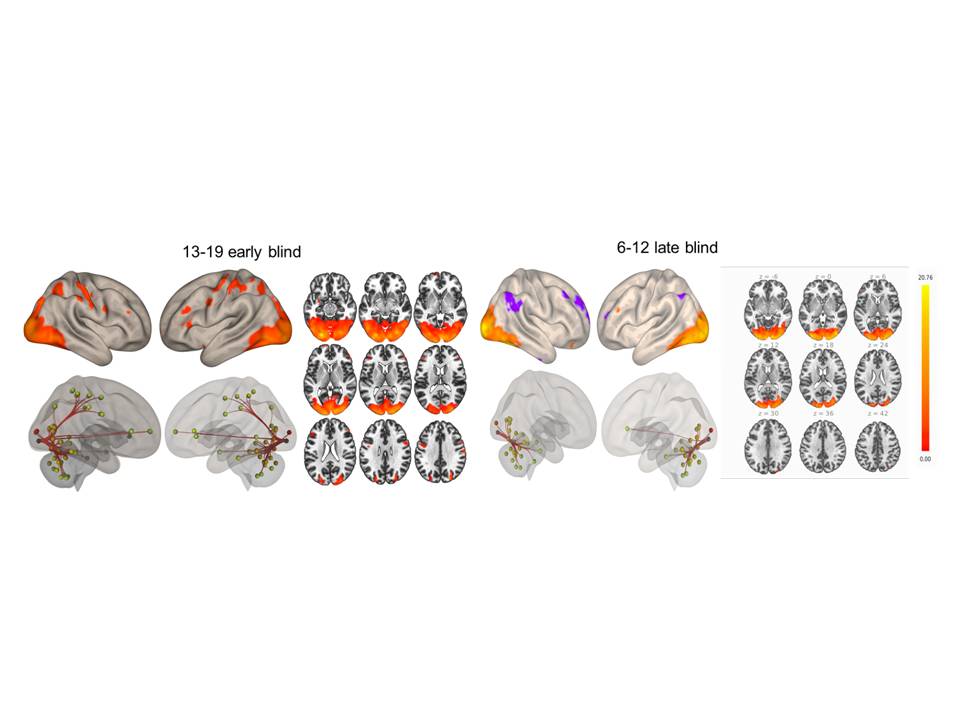
Bilateral activation of middle temporal gyrus and superior temporal gyrus (with left hemispheric dominance) was observed irrespective of age difference in all the groups (p < 0.05, FWE corrected). Visual cortical area response was higher in 13-19 years than 6-12 years of early blind and late blind groups, for the Braille reading and phonological tasks (Figure 2). The Pearson correlation analyses for the visual activation with age is positive for the non-visual language perception in both late and early blind groups (Figure 3). During the Braille reading task, the children group exhibited inferior frontal area (IFG) and Wernicke’s area, whereas adolescent group revealed in prefrontal, Wernicke’s area and Broca’s area. During the phonological language task, children group of early and late blind invoked the inferior frontal and Broca’s areas along with hippocampus and middle temporal gyrus. The same task revealed activation in IFG, prefrontal areas Wernicke’s and Broca’s area in adolescent groups. Hence early and late blind children have reduced language selectivity in prefrontal cortex relative to sighted group and adolescent group language pathway is intact and in correlation with the left visual cortex than children group.1,2 Voxel based anatomical analysis and functional connectivity revealed decreased connectivity (both short and long range) in primary visual area and somatosenso ry area in 6-12 years, than 13 -19 years (Figure 4) of both early and late blind groups6. For the phonological language area, a decreased connectivity was observed between visual area, somatosensory area and primary auditory cortex. These results reflect cross-modal plasticity due to adaptive compensatory mechanism in brain of visually deprived subjects. On comparing the EB with the LB, we can deduce that the age of onset of blindness and the total duration of blindness play a role in cortical thickness7.Conclusion
VBM and functional connectivity revealed cross modal plasticity in visual and language areas, which are dependent on duration of blindness and duration of education.Acknowledgements
Authors acknowledge the grant by Cognitive Science Research Initiative CSRI - DST; Government of India. Also we acknowledge participants from National Association of Blind for the participation and cooperation throughout the study.
References
- Zhou Z, Xu J, Shi L, et al. (2019) Alterations of the brain microstructure and corresponding functional connectivity in early‐blind adolescents. Neural Plast 2019: 2747460.
- Liu Y et al (2007) Whole brain functional connectivity in the early blind. Brain; 130:2085-96.
- Ashburner J., (2010) VBM tutorial, UCL (http://www.fil.ion.ucl.ac.uk/ ~john/misc/ VBMclass10.pdf)
- Whitfield-Gabrieli, S; Nieto-Castanon, A (2012). "Conn: a functional connectivity toolbox for correlated and anticorrelated brain networks". Brain Connect. 2: 125–41.
- Talairach J, and Tornoux P 1988 Stuttgart: thieme
- Atilgan H Collignon O, Hasson U, (2017) Structural neuroplasticity of the superior temporal plane in early and late blindness, Brain and Language;170:71-81.
- Hou, F., Liu, X., Zhou, Z., Zhou, J. & Li, H. (2017). Reduction of Interhemispheric Functional Brain Connectivity in Early Blindness: A Resting-State fMRI Study, BioMed Research International 2017, 1–8.
Figures