4639
Less Integrated and Less Efficient Structural Brain Networks in Children Treated for ALL1Diagnostic Imaging, St. Jude Children's Research Hospital, Memphis, TN, United States, 2Oncology, St. Jude Children's Research Hospital, Memphis, TN, United States
Synopsis
This study assessed whole-brain structural connectomes in 252 children treated for ALL during early phase of treatment and at end of therapy relative to 89 normal healthy age-similar controls. Both small worldness index and clustering coefficient were significantly lower in patients early and late in therapy relative to the controls but did not change during therapy. However, both characteristic path length and local efficiency significantly decreased during therapy. Decreased network integration and less efficient information transfer in patients treated for ALL is likely to result in decreased performance on neurocognitive testing by end of therapy.
PURPOSE
In the United States, acute lymphoblastic leukemia (ALL), the most common malignancy of childhood and adolescence, accounts for roughly 25% of childhood cancers diagnosed annually with a 5-year survival as high as 94%.1 This improved survival comes with an increased risk for neurocognitive late effects in attention, working memory, and processing speed.2, 3 These measures are especially sensitive to treatment-related changes in white matter structures early in therapy.4PATIENTS AND METHODS
MRI exams were acquired two years apart, 20 weeks from diagnosis at re-induction I (MR1) and at the end of therapy (MR2), in 252 children treated for ALL (age at MR1 7.4±4.6 years, age at MR2 9.6±4.6 years; 151 male, 101 female; 139 standard/high-risk, 113 low-risk). All subjects were treated on a chemotherapy-only protocol, Total Therapy Study XVI (NCT00549848). An age-matched healthy control cohort included 89 subjects (13.8±5.2 years; 51 male, 38 female). Imaging protocols were approved by the local Institutional Review Board, and written informed consent was obtained from the patient, subject, parent or guardian, as appropriate. Anatomic imaging was collected on all subjects between 2008 and 2016 using a 3D T1 weighted MPRAGE sequence [TR/TE/TI = 1560/2.75/900 ms] with 1 mm isotropic resolution on a 3.0T whole-body system (Siemens Medical Systems, Iselin, NJ). These isotropic images were processed using the FreeSurfer pipeline (http://surfer.nmr.mgh.harvard.edu/). A combined volumetric and surface-based registration is used to bring multimodal parcellations (HCP_MMP1.0) back into patient space as seeds and targets for tracking.5 Low resolution DTI data was acquired with 12 directions, 4 averages, and a spatial resolution of 1.8x1.8x3.0 mm [TR/TE = 6500/100 ms; b=0, 700 s/mm2]. Diffusion data were processed with the MRtrix3 Software (http://www.mrtrix.org/). Preprocessing steps included denoising, unringing, and eddy current, motion, and bias field corrections. The fiber orientation distributions were estimated using multi-tissue constrained spherical deconvolution (CSD). Anatomically constrained tractography (ACT) was used to generate the biologically plausible probabilistic fibers from each cortical and subcortical region to every other region. The overestimated density of long tracks was corrected with spherical-deconvolution informed filtering of tracks (SIFT2).6 Finally, the atlas-based quantitative structural connectivity matrices were generated. Proportional thresholding was applied to the connectivity matrix to preserve 30% of the strongest weights. The Brain Connectivity Toolbox (https://sites.google.com/site/bctnet/)7 was used to quantitatively asses global binary, undirected graph metrics of: small worldness index (SWI), normalized clustering coefficient (nCC), normalized characteristic path length (nPL), global efficiency (GE), and mean local efficiency (mLE). All comparisons between survivors and controls were performed using a two-tailed Student T-test assuming unequal variance, while comparisons between patients at different time points were performed using a two-tailed paired Student T-test. A p<0.05 was considered significant.RESULTS
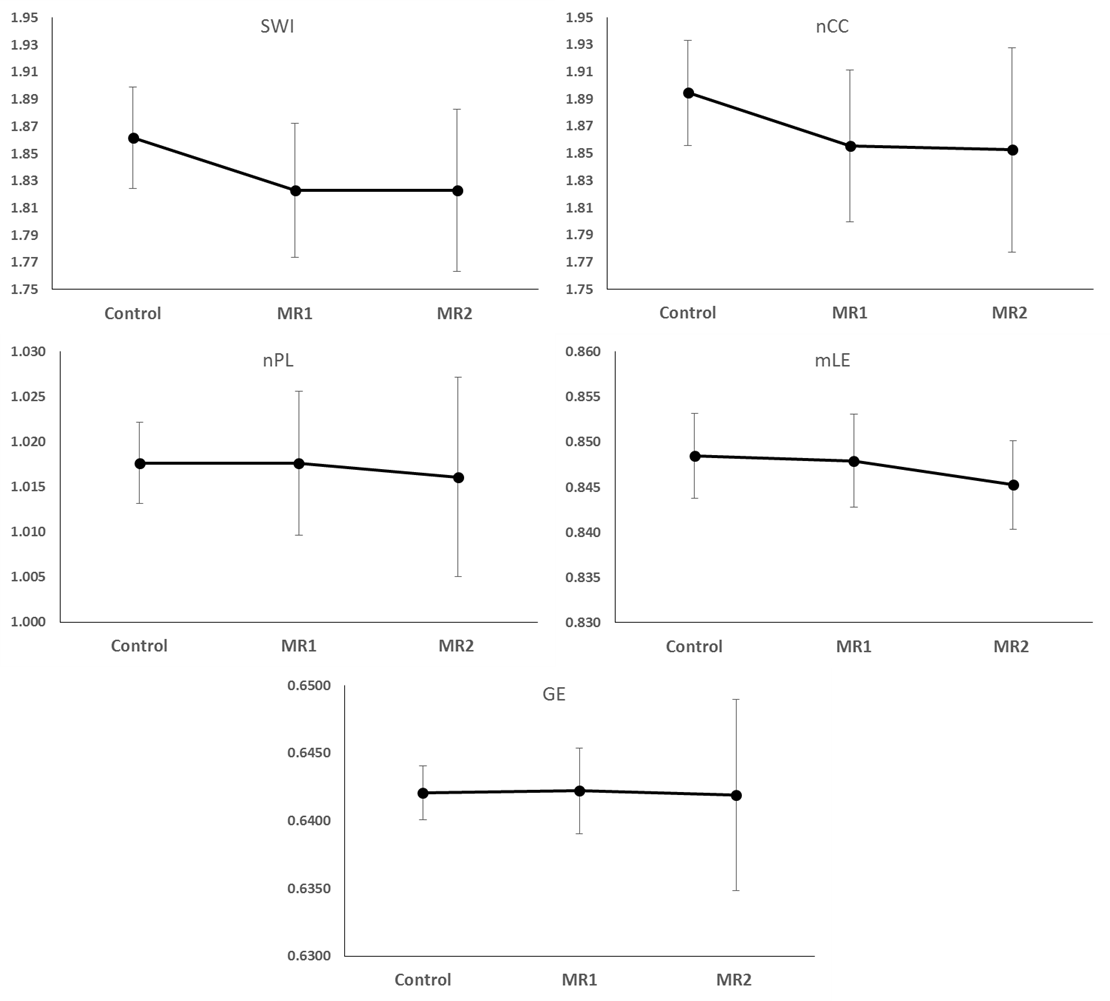
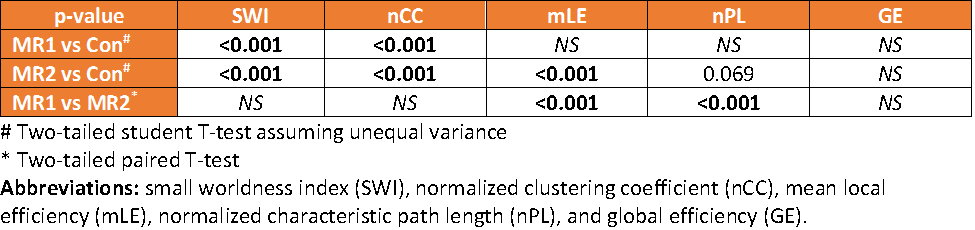
The results of the graph metric analysis of the structural connectome for the two patient examinations compared to the controls can be seen in the graphs of Figure 1. The graphs of SWI and nCC of patients were lower than the controls at both time points but did not seem to differ in time. The graphs of nPL and mLE of patients were similar to controls early in therapy but decreased by end of therapy. Global efficiency appeared relatively unchanged in patients compared to controls at both time points. T-tests of these metrics between the three groups of examinations are summarized in Table 1. SWI and nCC in patients were significantly (p<0.001) lower at both time points, while nPL (p=0.069) and mLE (p<0.001) were substantially lower only at the end of therapy compared to controls. However, both nPL and mLE are significantly decreased at end of therapy relative to early in therapy (both p<0.001). Global efficiency was not significantly changed.DISCUSSION
Small-world networks are highly clustered but still have small characteristic path lengths resulting in a networks with regional specialization and efficient information transfer.8 The normalized clustering coefficient is a measure of the degree to which nodes in a graph tend to cluster together. Both of these parameters are significantly lower in patients both early and late in frontline ALL therapy but are not different between the two time points. The normalized path length represents the average number of edges in the shortest paths between every pair of nodes in the network and assesses the degree of integration within the network. Local efficiency is a function of the shortest path length. The path length was significantly decreased relative to the examination early in therapy. These changes in path length did result in a significantly lower local efficiency compared to controls. Overall, the global structural network metrics in patients treated for ALL demonstrate less regional specialization and less efficient information transfer. These characteristics are likely to impact performance on neurocognitive testing especially in information processing speed and other higher order cognitive functions that rely on distributed networks.CONCLUSION
Decreased network integration and less efficient information transfer in patients treated for ALL is likely to result in decreased performance on neurocognitive testing by end of therapy. A more thorough analysis of the specific brain regions responsible for the decreased global metrics should provide additional insight into the specific cognitive domains likely to be affected.Acknowledgements
We acknowledge the valuable contributions of Kathy Jordan, advanced signal processing technician, and funding in part by the Cancer Center Support Grant P30 CA21765 and research project grant R01 CA090246 (WER) from the National Cancer Institute and ALSAC.References
1. Pui CH, Evans WE. A 50-year journey to cure childhood acute lymphoblastic leukemia. Semin Hematol. 2013;50: 185-196.
2. Edelmann MN, Krull KR, Liu W, et al. Diffusion tensor imaging and neurocognition in survivors of childhood acute lymphoblastic leukaemia. Brain. 2014;137: 2973-2983.
3. Jacola LM, Krull KR, Pui CH, et al. Longitudinal Assessment of Neurocognitive Outcomes in Survivors of Childhood Acute Lymphoblastic Leukemia Treated on a Contemporary Chemotherapy Protocol. J Clin Oncol. 2016;34: 1239-1247.
4. Ashford J, Schoffstall C, Reddick WE, et al. Attention and working memory abilities in children treated for acute lymphoblastic leukemia. Cancer. 2010;116: 4638-4645.
5. Glasser MF, Coalson TS, Robinson EC, et al. A multi-modal parcellation of human cerebral cortex. Nature. 2016;536: 171-178.
6. Smith RE, Tournier JD, Calamante F, Connelly A. SIFT2: Enabling dense quantitative assessment of brain white matter connectivity using streamlines tractography. Neuroimage. 2015;119: 338-351.
7. Rubinov M, Sporns O. Complex network measures of brain connectivity: uses and interpretations. Neuroimage. 2010;52: 1059-1069.
8. Telesford QK, Joyce KE, Hayasaka S, Burdette JH, Laurienti PJ. The ubiquity of small-world networks. Brain Connect. 2011;1: 367-375.
Figures