4638
Detecting and characterizing abnormal brain lateralization using quantitative MRI in clinical practice1Advanced Clinical Imaging Technology, Siemens Healthcare AG, Lausanne, Switzerland, 2Department of Radiology, Lausanne University Hospital and University of Lausanne, Lausanne, Switzerland, 3LTS5, École Polytechnique Fédérale de Lausanne (EPFL), Lausanne, Switzerland, 4UMR 1253, iBrain, Université de Tours, Inserm, Tours, France, 5Pediatric Radiology Department, Clocheville Hospital, CHRU of Tours, Tours, France
Synopsis
The right-left lateralization of cognitive abilities in the human brain is reflected in hemispheric asymmetries. Since abnormal deviations of these asymmetries were linked to neurological disorders, establishing reference norms of hemispheric lateralization has clinical relevance. To this end, the normal evolution of brain asymmetries during development was modelled in a cohort of healthy young subjects. Normative ranges for brain asymmetries in volumes and T1 were established using a linear model while accounting for sex differences and age. Initial results in data of epileptic patients demonstrate the potential of the established norms for detecting abnormal brain lateralization on a single-subject basis.
Introduction
The right-left lateralization of cognitive and perceptual abilities is a main characteristic of brain organization in humans1,2, which is reflected in morphological hemispheric asymmetries3. Deviations of these asymmetries from the typical patterns of hemispheric lateralization assessed through MR imaging have been linked to neurological disorders such as autism4,5 and epilepsy6,7. Establishing reference baselines of hemispheric lateralization is thus of clinical relevance and has the potential to automatically determine pathological patterns of brain asymmetries on a single-subject basis.To that end, the evolution of brain asymmetries during normal development was modelled in a cohort of healthy young subjects from one to sixteen years. While previous studies mostly focused on volumetric asymmetries8,9, microstructural lateral differences reflected by T1 measurements were also investigated here. Normative ranges of brain asymmetries were established, and clinical feasibility of detecting the presence of right-left abnormal asymmetry patterns is shown in three epileptic patients as a proof-of-concept.
Material and Methods
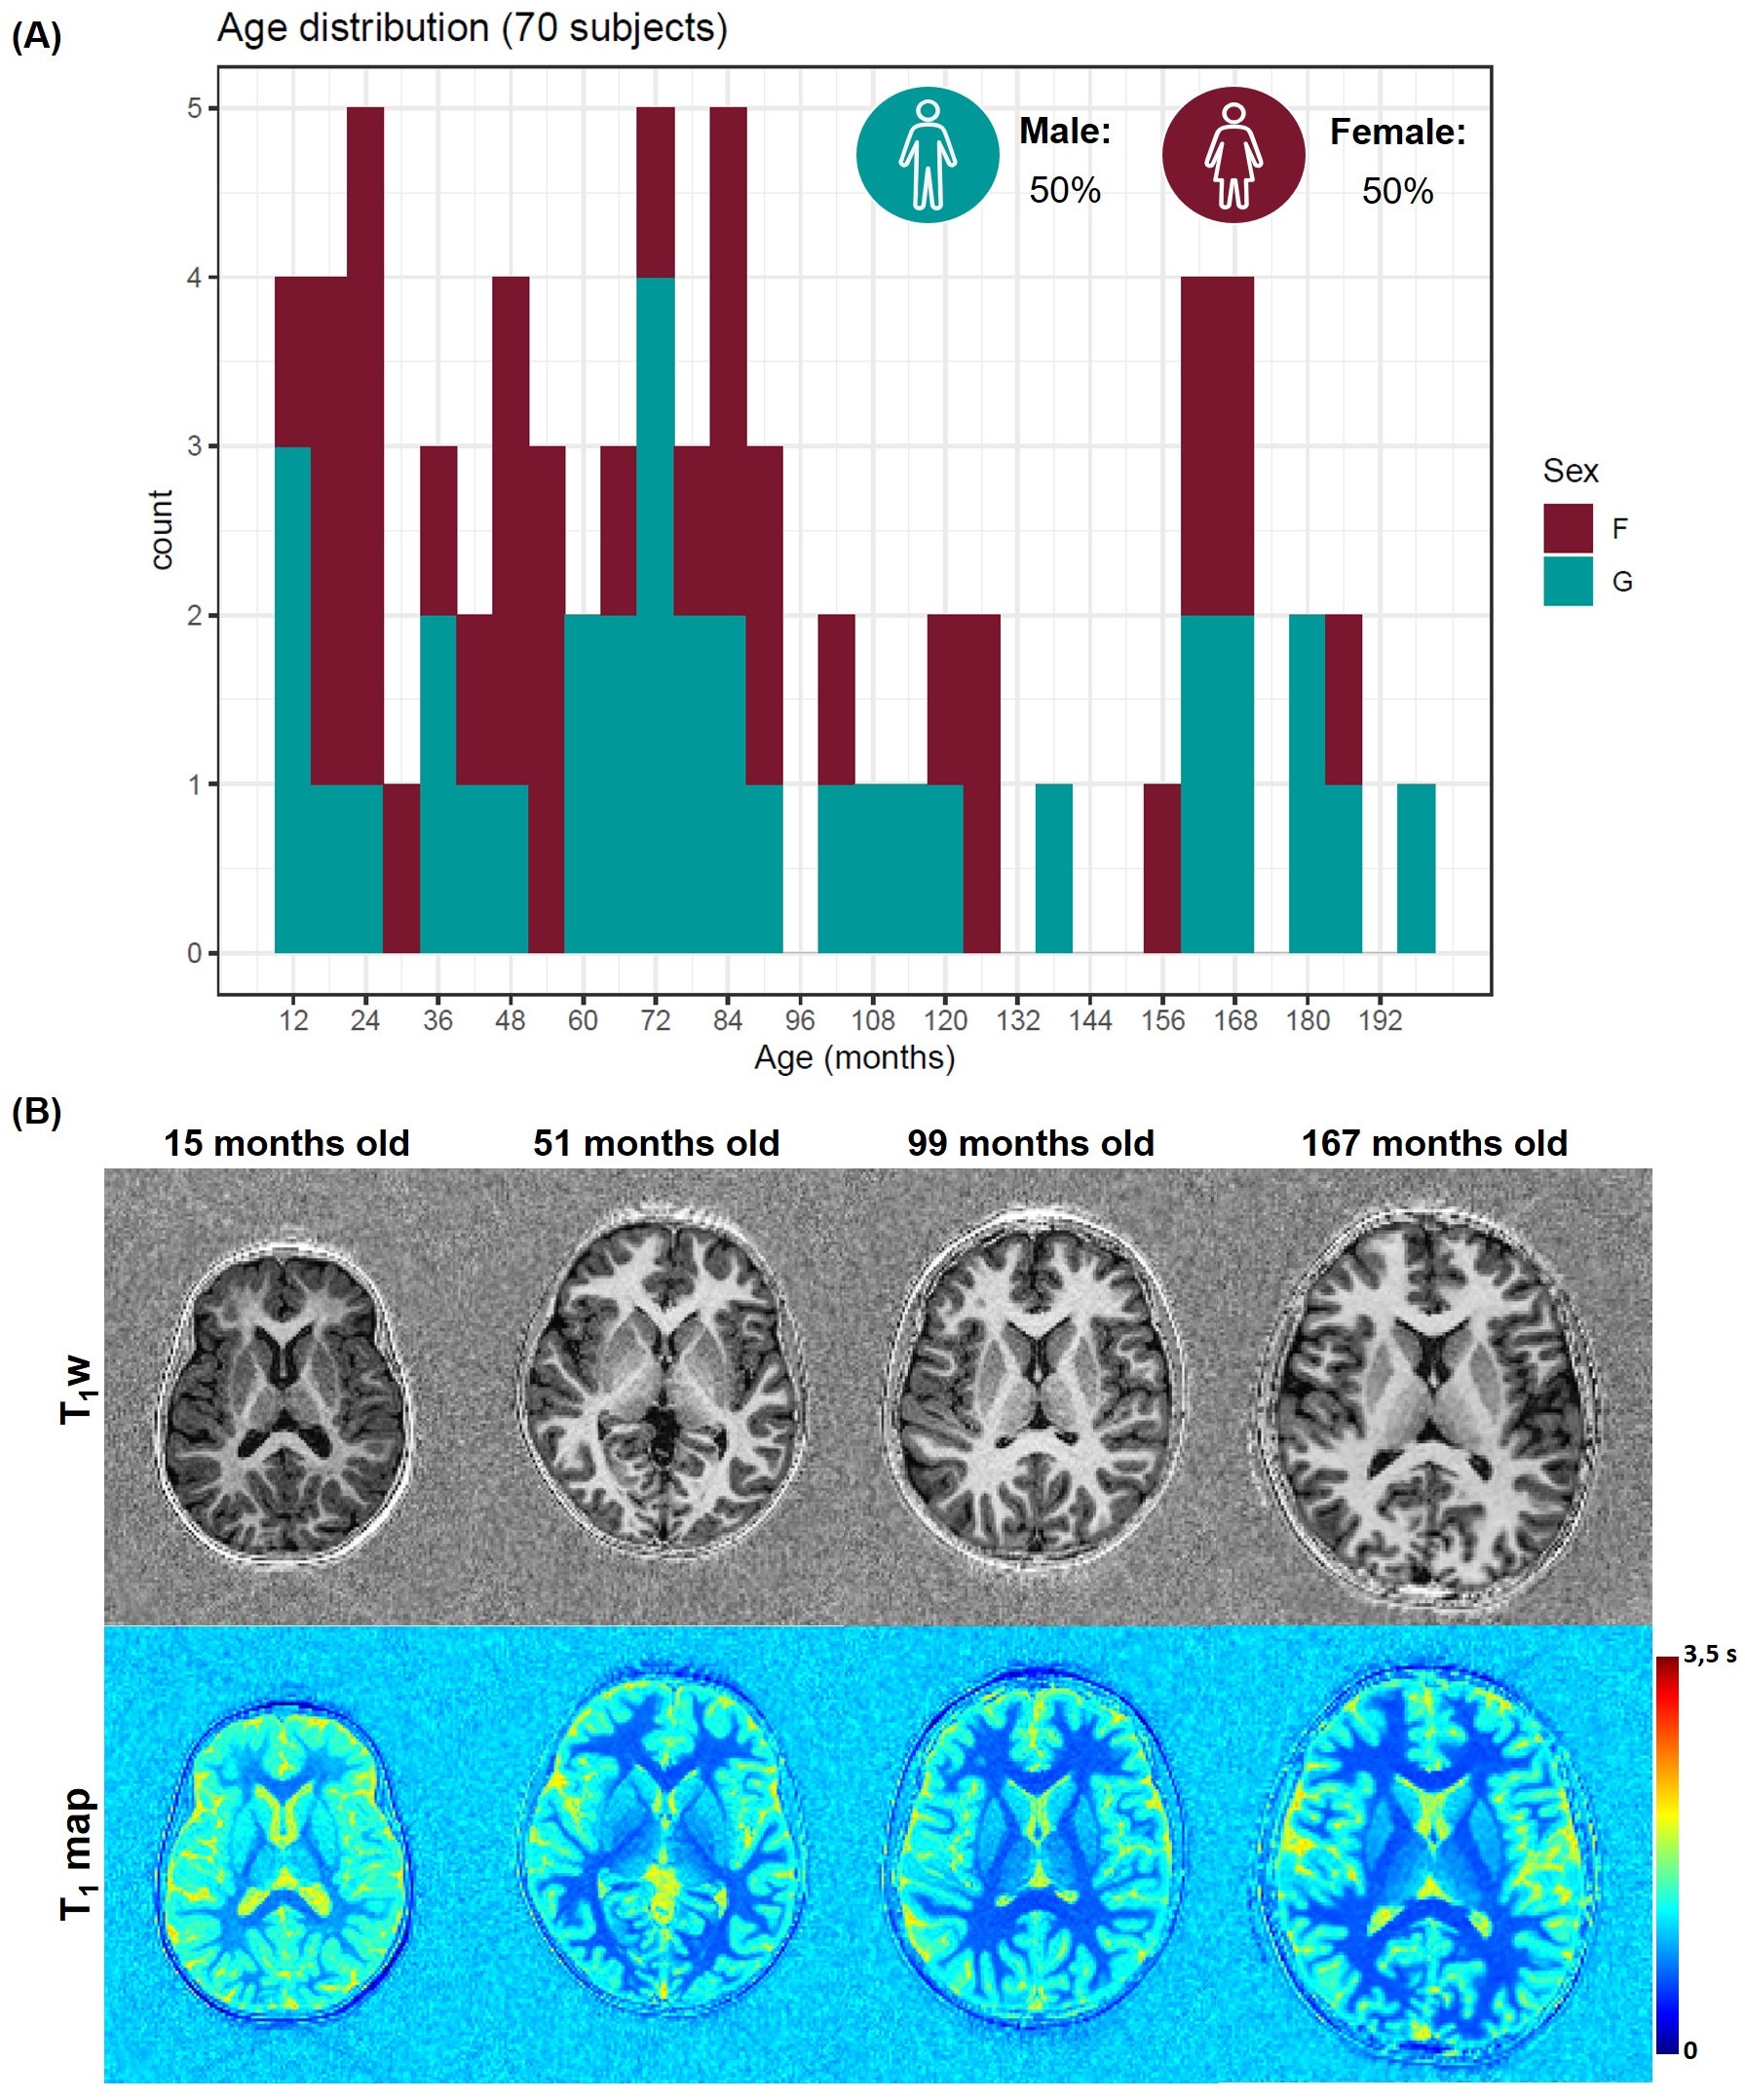
Population: Within a two-year prospective study approved from the local ethics committee (RNI-2017-093), 208 subjects from one to sixteen years old were recruited. One radiologist reviewed all MRI exams to identify any abnormalities; 70 MRI examinations performed on subjects with an isolated mild headache were found to be normal and considered in this work (demographics in Figure 1A). Three additional epileptic patients (one male, 41 months old; two females, 22 and 46 months old) were included in this study to test the method in a proof-of-concept. These patients underwent an EEG examination which revealed focal paroxysmal abnormalities in the right hemisphere of the male subject and in the left lobe of the two females.Image acquisition and processing: Subjects were scanned without sedation at 1.5T (MAGNETOM Aera, Siemens Healthcare, Erlangen, Germany) using a 20-channel head coil. Whole-brain 3D T1-weighted images and T1 maps were obtained with a prototype MP2RAGE sequence10 (resolution=1.33x1.33x1.25mm3, FOV=256x240mm2, TI1/TI2=600/2000ms, flip angles=5-6°, TR=5000ms, TA=6:36min). Brain structures were automatically segmented on the T1-weighted image with the MorphoBox prototype11,12, using brain atlases designed for this age group13. Absolute volume and average T1 were calculated for each ROI.
Modelling of brain asymmetries: A macro- and micro-structural laterality index (LI) were derived for each brain structure as the ratio of the difference between absolute volumes or average T1 values between right and left lobes to the right-left mean value:$${LI}_{Vol}=\frac{Vol(L)-Vol(R)}{(Vol(L)+Vol(R))/2}\ast100,$$ $${LI}_{T_1}=-\frac{T_1(L)-T_1(R)}{(T_1(L)+T_1(R))/2}\ast100.$$ Leftward asymmetries are indicated by positive LIs. The evolution with age of the LIs was modelled by linear regression for each brain region (r):$${LI}_{Vol}(\mathbf{r})\ =\beta_{0,Vol}(\mathbf{r})+\beta_{sex,Vol}(\mathbf{r})\ast sex+\beta_{age,Vol}(\mathbf{r})\ast age,$$ $${LI}_{T_1}(\mathbf{r})=\beta_{0,T_1}(\mathbf{r})+\beta_{sex,T_1}(\mathbf{r})\ast sex+\beta_{age,T_1}(\mathbf{r})\ast age.$$An analysis of variance (ANOVA) was carried out to test the statistical significance of sex and age on the LIs (p<0.05 were considered significant after correction for multiple comparisons). Normative ranges were established as the 95% prediction interval.
Detection of abnormal brain lateralization: To demonstrate the feasibility of assessing abnormalities on a single-subject basis, deviations from the established norms were calculated in brain regions of the patient datasets and expressed in z-scores.
Results
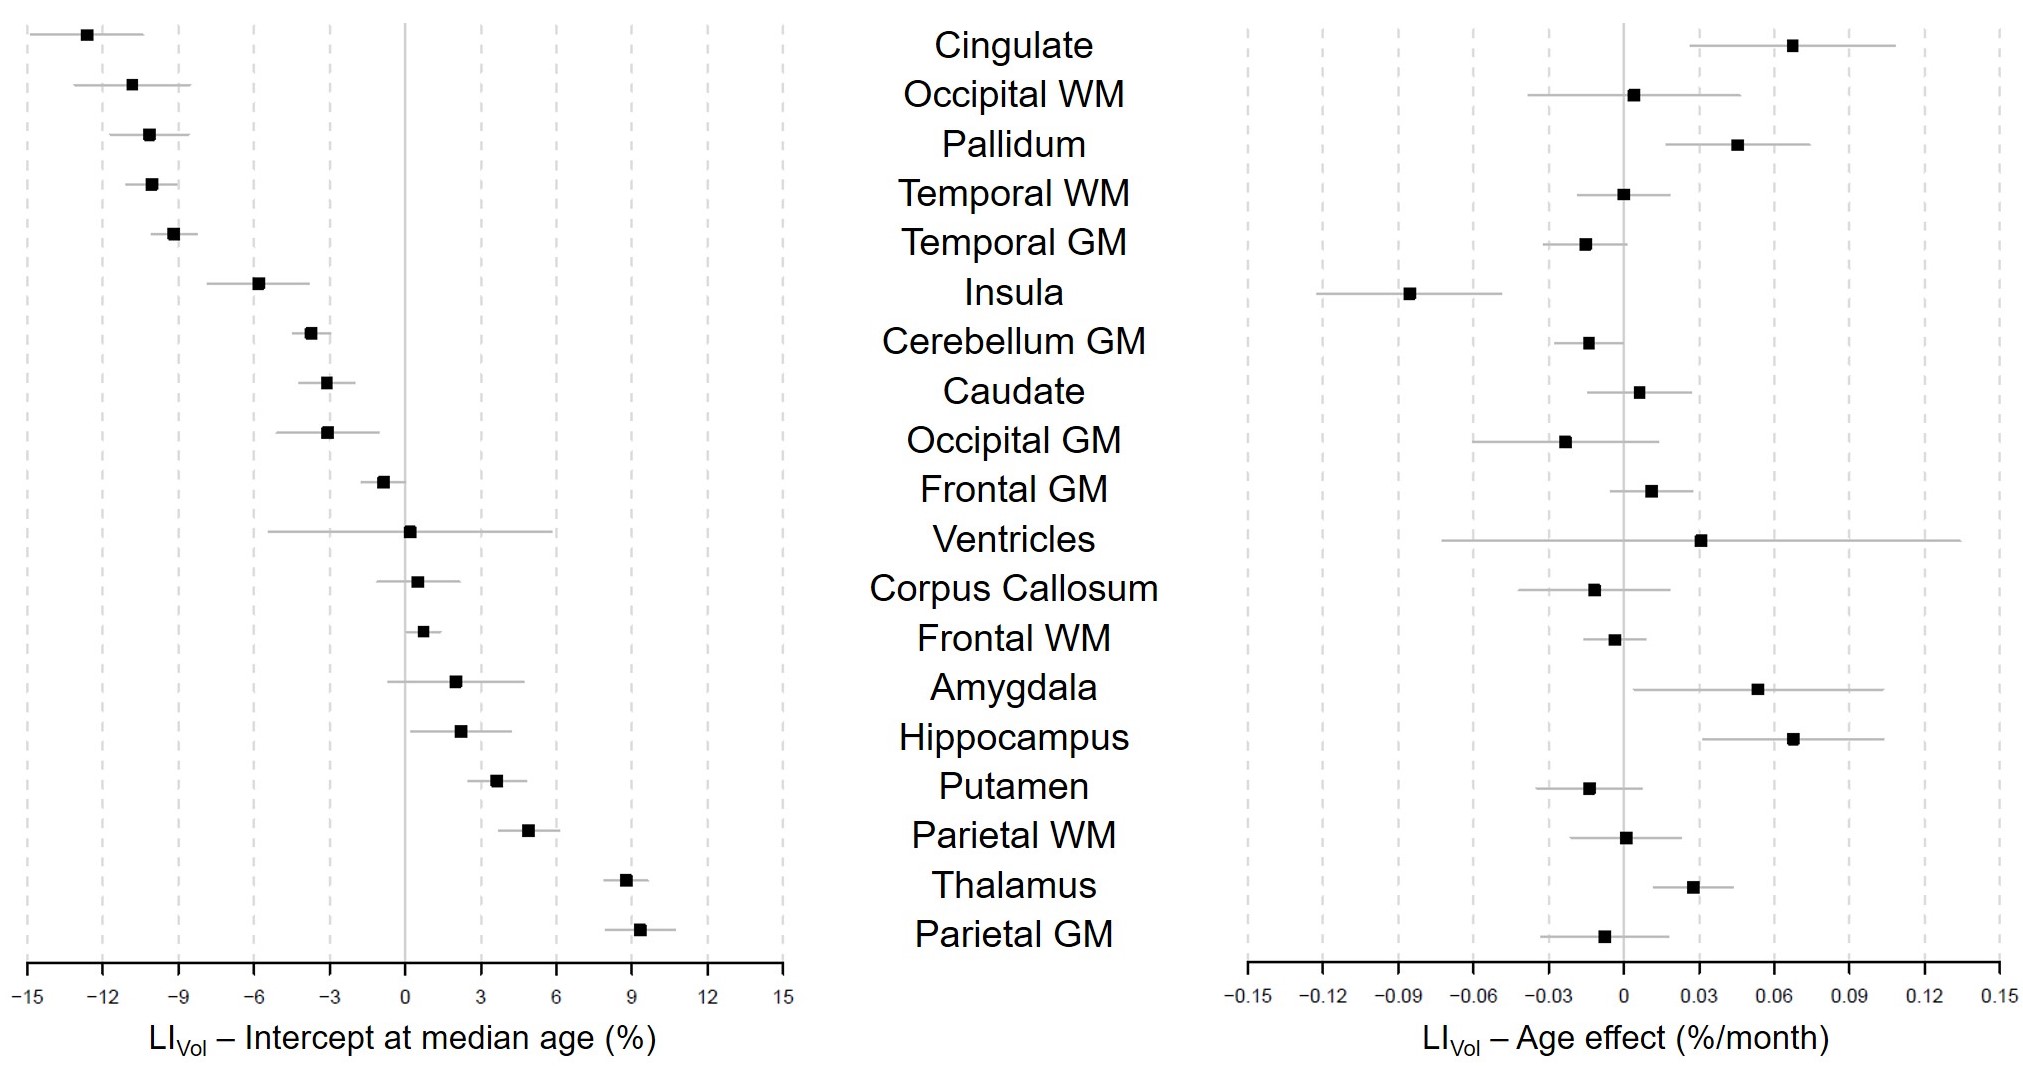
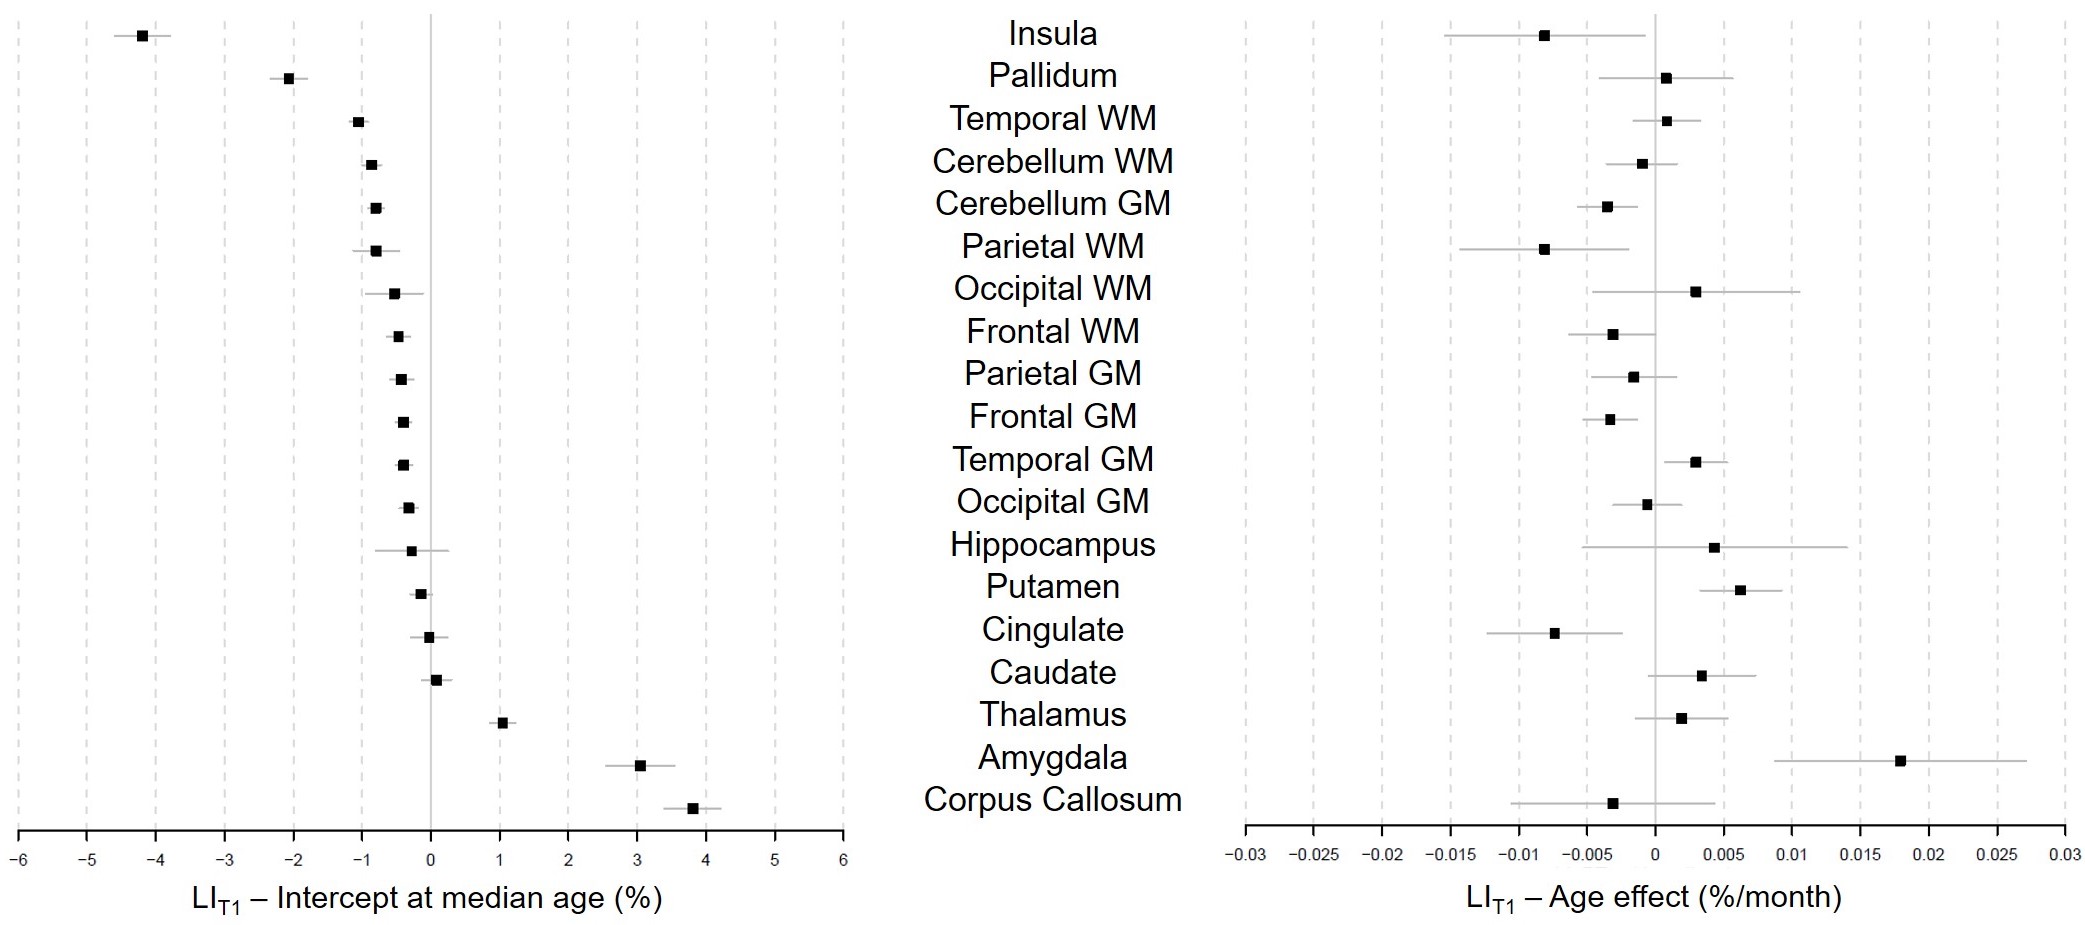
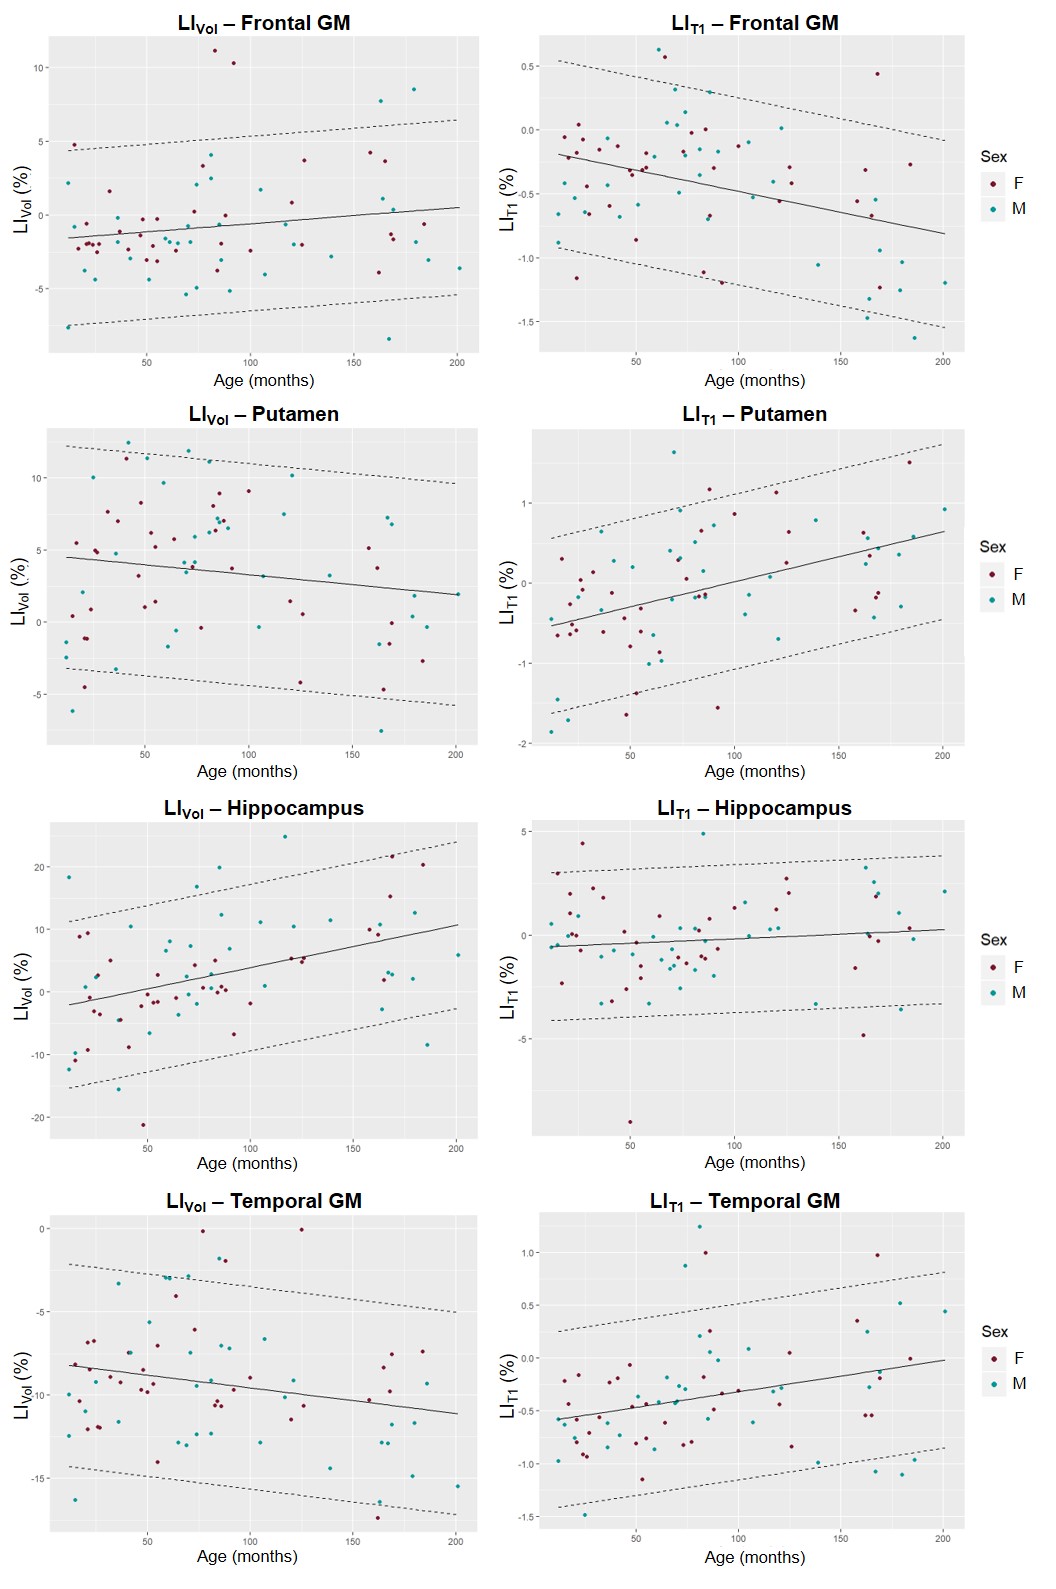
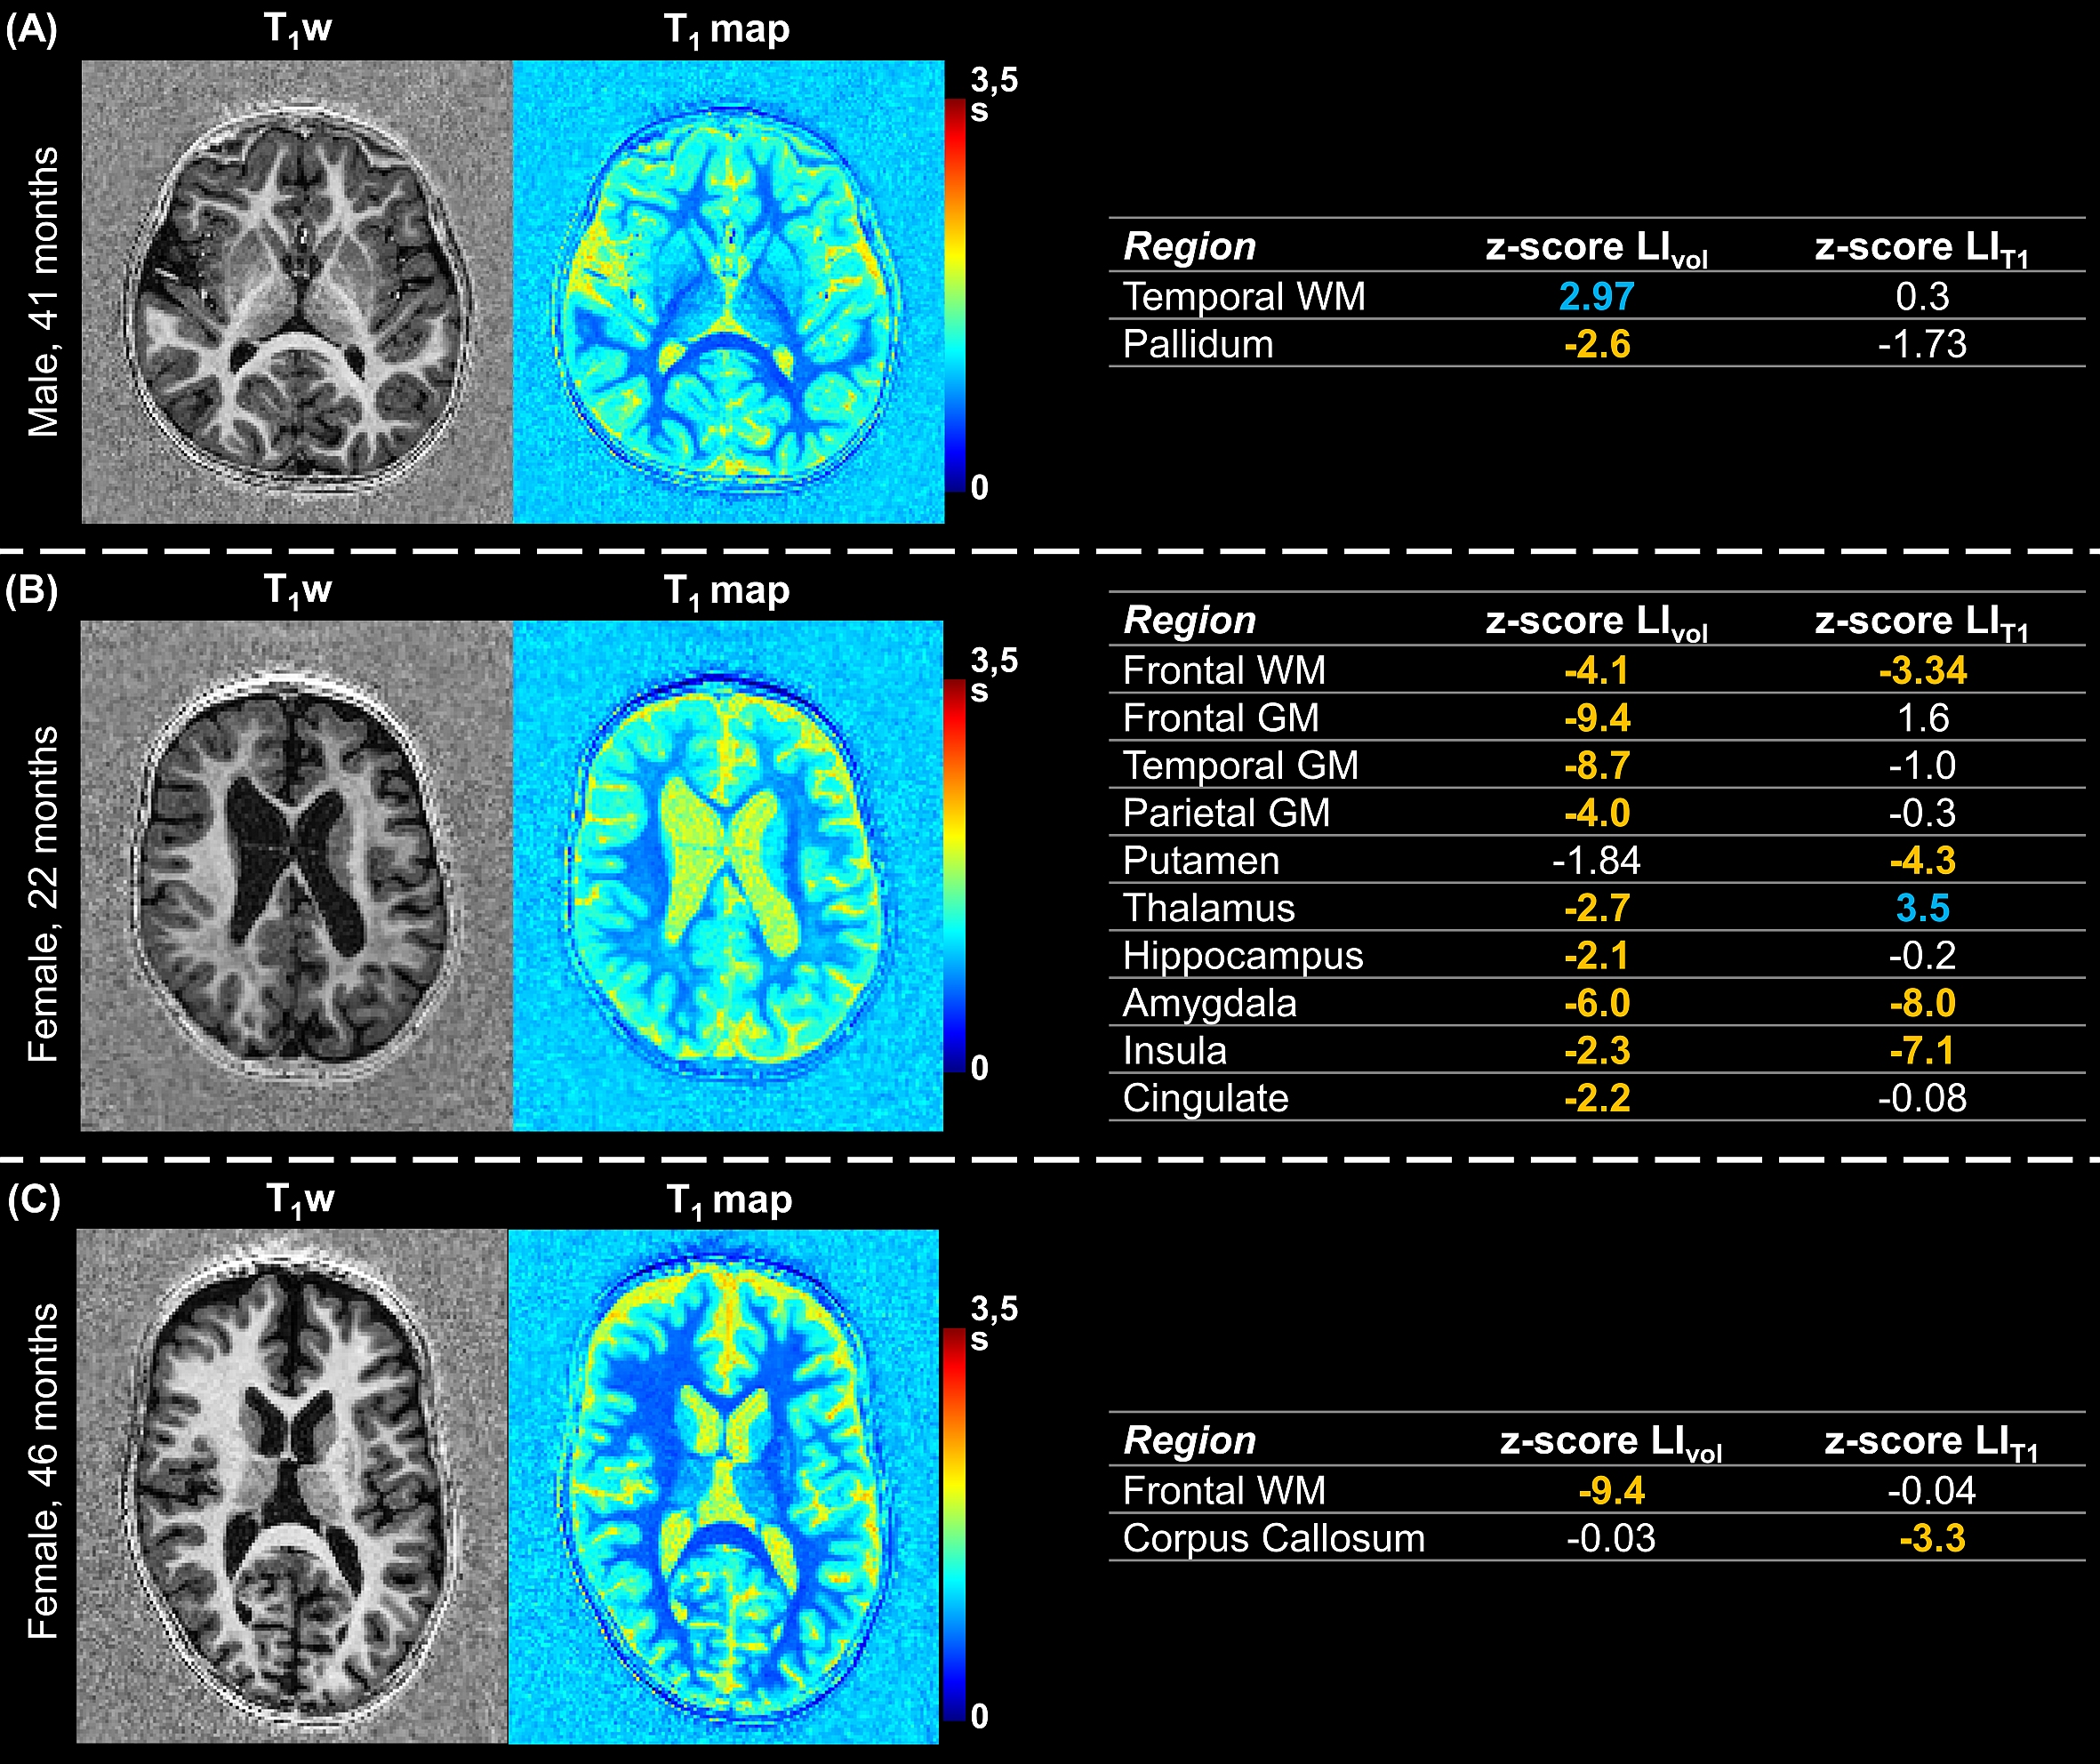
Representative slices of the acquired images are shown in Figure 1B. The expected LIVol at the cohort median age (74 months) and the effect of age are reported in Figure 2 and for LIT1 in Figure 3. The largest morphological rightward asymmetries were found in cingulate, occipital WM, pallidum, temporal WM, and GM (all LIVol<-9%), the largest leftward effects in thalamus and parietal GM (LIVol>9%). The largest rightward asymmetries in T1 were found in pallidum and insula (both LIT1<-2%), leftwards in corpus callosum and amygdala (LIT1>3%). The strongest LIVol changes with age were found in insula (-8.5%/month), amygdala (5.4%/month), cingulate (6.7%/month), hippocampus (6.8%/month), and for LIT1 in insula (-0.008%/month), parietal WM (-0.008%/month), cingulate (-0.007%/month), and amygdala (0.02%/month), all of them with p<0.05. Evolutions with age of the established models and normative ranges for LIVol and LIT1 are shown in Figure 4 for four example brain structures.The deviations in the patients’ datasets exceeding the normative ranges (|z-score|>2) are illustrated in Figure 5. In the patient with right paroxysmal abnormalities, a pronounced leftward asymmetry was found in the frontal WM volume (zLIvol=2.97). In the two patients with left paroxysmal abnormalities, pronounced rightward lateralization was detected, especially in the frontal GM volume (zLIvol=-9.4) and amygdala T1 (zLIT1=-8.0) for the first patient, and in the frontal WM volume (zLIvol=-9,4) and corpus callosum T1 (zLIT1=-3.3) for the second.
Discussion and Conclusion
In agreement with previous studies, grey matter structures were found to have the strongest morphological asymmetries reflecting the lateralization of the functional organization of the brain cortex8,9. T1 values were found to be asymmetric too, even though a smaller effect size was observed. While an evolution of the laterality indexes with age was observed, no significant differences were found with sex, in coherence with literature9. The handedness of the subjects was previously found to not affect brain asymmetries8; as it was, however, not available in this study, future work should focus on confirming the absence of this effect on the established norms.Initial results based on epileptic patients demonstrated the feasibility of employing the established norms for automated detection and quantification of abnormal brain lateralization on a single-subject basis. In all patients, these preliminary results agreed with EEG assessments, indicating a clinical value of the proposed framework.
Acknowledgements
No acknowledgement found.References
1. Vigneau M, Beaucousin V, Hervé PY, et al. Meta-analyzing left hemisphere language areas: Phonology, semantics, and sentence processing. Neuroimage. 2006;30(4):1414-1432.
2. Turner BO, Marinsek N, Ryhal E, Miller MB. Hemispheric lateralization in reasoning. Ann N Y Acad Sci. 2015;1359(1):47-64.
3. Rentería ME. Cerebral asymmetry: A quantitative, multifactorial, and plastic brain phenotype. Twin Res Hum Genet. 2012;15(3):401-413.
4. Eyler LT, Pierce K, Courchesne E. A failure of left temporal cortex to specialize for language is an early emerging and fundamental property of autism. Brain. 2012;135(3):949-960.
5. Shaw P, Lalonde F, Lepage C, et al. Development of cortical asymmetry in typically developing children and its disruption in attention-deficit/hyperactivity disorder. Arch Gen Psychiatry. 2009;66(8):888-896.
6. Ellmore TM, Beauchamp MS, Breier JI, et al. Temporal lobe white matter asymmetry and language laterality in epilepsy patients. Neuroimage. 2010;49(3):2033-2044.
7. Bonilha L, Rorden C, Halford JJ, et al. Asymmetrical extra-hippocampal grey matter loss related to hippocampal atrophy in patients with medial temporal lobe epilepsy. J Neurol Neurosurg Psychiatry. 2007;78(3):286-294.
8. Kong XZ, Mathias SR, Guadalupe T, et al. Mapping cortical brain asymmetry in 17,141 healthy individuals worldwide via the ENIGMA consortium. Proc Natl Acad Sci U S A. 2018;115(22):E5154-E5163.
9. Levman J, MacDonald P, Lim AR, Forgeron C, Takahashi E. A pediatric structural MRI analysis of healthy brain development from newborns to young adults. Hum Brain Mapp. 2017;38(12):5931-5942.
10. Marques JP, Kober T, Krueger G, van der Zwaag W, Van de Moortele P-F, Gruetter R. MP2RAGE, a self bias-field corrected sequence for improved segmentation and T1-mapping at high field. Neuroimage. 2010;49(2):1271-1281.
11. Schmitter D, Roche A, Maréchal B, et al. An evaluation of volume-based morphometry for prediction of mild cognitive impairment and Alzheimer’s disease. NeuroImage Clin. 2015;7:7-17.
12. Serru M, Marechal B, Kober T, et al. Improving diagnosis accuracy of brain volume abnormalities during childhood with an automated MP2RAGE-based MRI brain segmentation. J Neuroradiol. August 2019.
13. Maréchal
B, Piredda GF, Hilbert T, et al. Simultaneous micro- and macrostructural
assessment of normal brain development. Submitted in parallel to the Annual Meeting of ISMRM
2020.
Figures