4633
Visual processing activation in the magnocellular pathway is associated with Developmental Dyslexia1Neuroimaging Unit, IRCCS Eugenio Medea, Bosisio Parini, Italy, 2Child Psychopathology Unit, IRCCS Eugenio Medea, Bosisio Parini, Italy, 3Laboratory for the Psychology of Child Development and Education (LaPsyDE), University Paris Descartes, Paris, France, 4NeuroInformatics Laboratory (NILab), Bruno Kessler Foundation, Trento, Italy
Synopsis
According to the magnocellular (M) deficit theory, deficits in the visual M functions predict reading skills and are associated with Developmental Dyslexia (DD). We acquired two well-established visual tasks (i.e. a sinusoidal grating and a coherent dots motion detection) in 22 Normal Readers (NR) and 22 children with DD. We applied a multi-variate pattern analysis approach to combine the two tasks. The combination of their activation patterns significantly discriminated between NR and children with DD, suggesting that differences in the M functions are present between the two populations and supporting the M deficit theory
Introduction
Developmental Dyslexia (DD) is a common neurodevelopmental disorder characterized by reading deficit in spite of adequate cognitive and sensorial abilities1. According to the magnocellular (M) deficit theory, deficits in the visual M functions predict reading difficulties and are often associated with DD2. Here, we applied a Multi-Variate Pattern Analysis (MVPA) approach to investigate whether functional activations associated with the M functions discriminate between Normal Readers (NR) and children with DD.Materials and methods
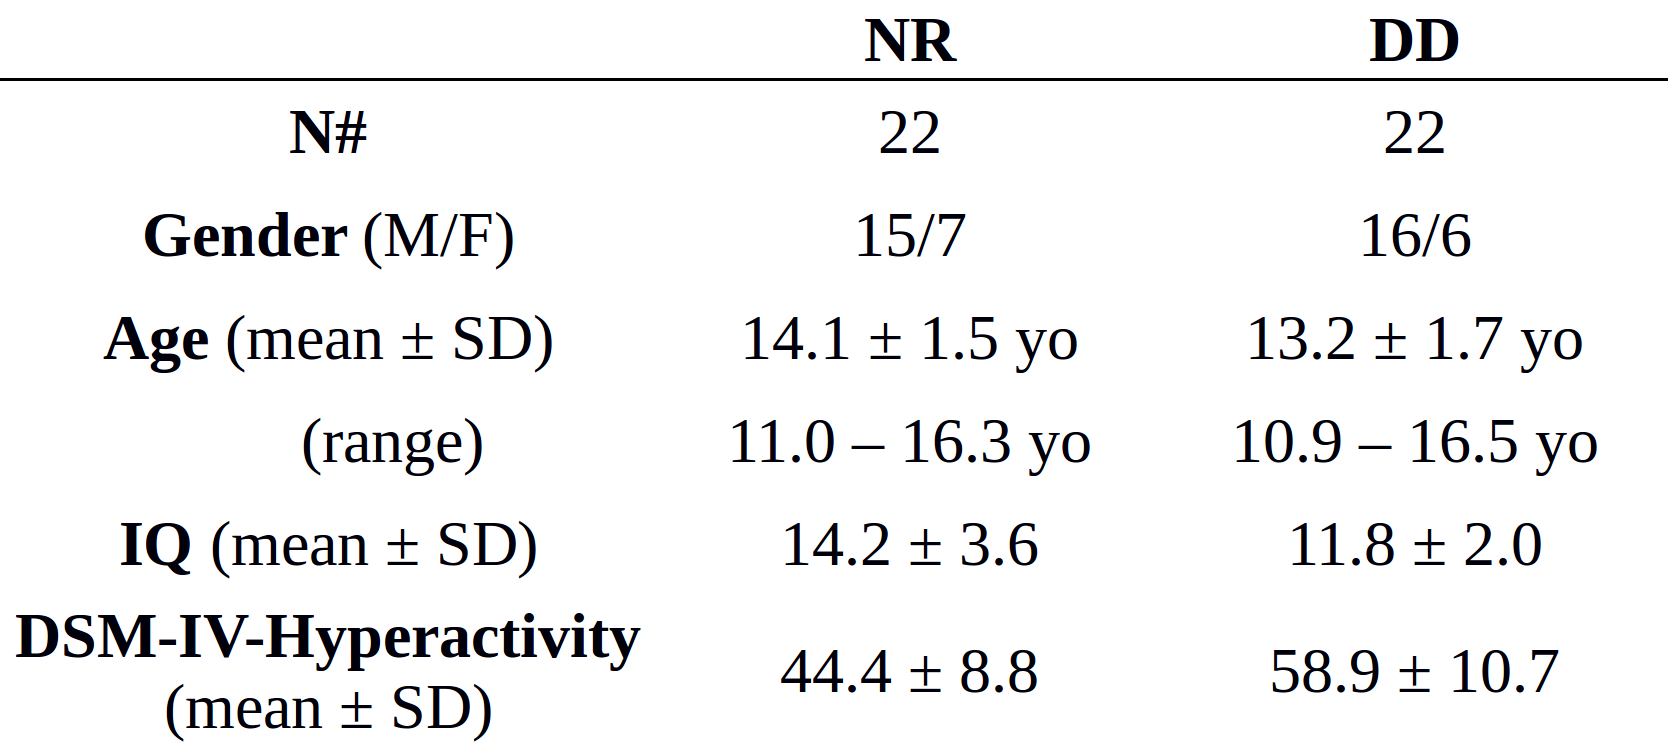
Dataset: 22 NR (age 13.2±1.7 yo) and 22 children with DD (age 14.1±1.5 yo) were enrolled in the study (full demographics and cognitive assessment are reported in table 1).MRI protocol: each subject underwent a 3T MRI scan session including a T1-weighted 3D morphological sequence (TE=8.2ms, TE=3.8ms, flip angle=8°, voxel size 1x1x1 mm3) and two fMRI task sequences (TR=2s, TE=35ms, voxel size 3x3x3.5 mm3).
The first fMRI task (Task 1) consisted of a block-design stimulation of the M and Parvocellular (P) pathways3. M and P stimuli were both full-field sinusoidal grating stimulations with sinusoidal counter-phase flicker. Figure 1 reports an example of the M and P stimuli. The baseline condition was a gray screen of mean luminance with a white fixation point. The task protocol consisted of 8 M blocks, 8 P blocks and 12 baseline blocks presented in pseudo-random order. Subjects were asked to perform a target detection task during the M and P blocks to encourage attention during the acquisition.
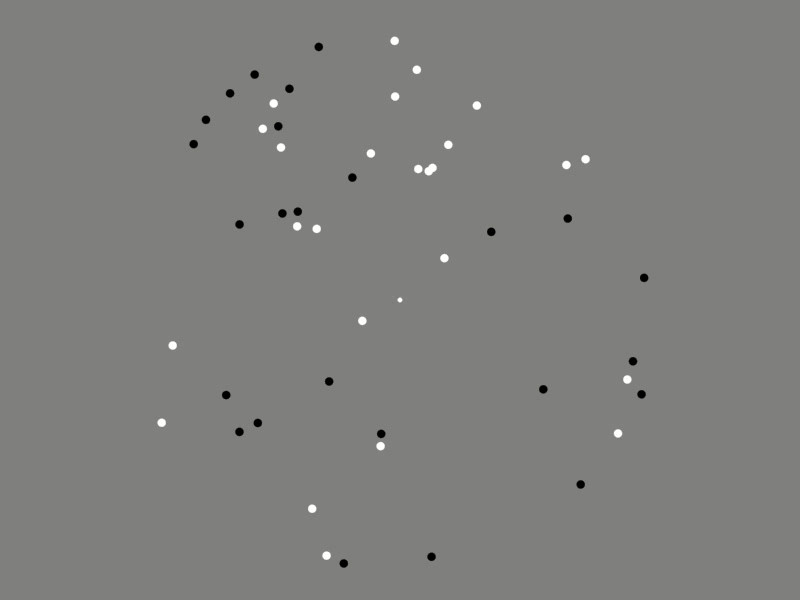
The second fMRI task consisted of an event related design task of sensitivity to Coherent Dots Motion (CDM)4. An example of the CDM stimulus is reported in figure 2. We used three different ratios of coherently moving dots (CMR), i.e. 6%, 15% and 40% 4. After each CDM stimulus, subjects had 4s to report dots motion direction. Finally, a 4.25s gray screen block (baseline condition) was placed between the answer block and the subsequent CDM stimulus. The protocol included 48 stimuli (8 repetitions for each combination of coherence level and motion direction) administered in pseudo-random order. Subjects were instructed to maintain fixation throughout the run, and were actively engaged in performing a motion detection task.
Data preprocessing: morphological images were processed using the recon-all pipeline of the FreeSurfer software package (v6.0) to extract the white matter and the pial surfaces5. Subject’s fMRI data were preprocessed following the FreeSurfer Functional Analysis Stream (FS-FAST v6.0) which includes motion and slice-timing corrections, functional-anatomical registration, mask creation, intensity normalization, sampling to common space, spatial smoothing and first level analysis. Five contrast maps were computed for each subject, two from the grating task (M Vs baseline and P Vs baseline) and three from the CDM task (CMR-6% Vs baseline, CMR-15% Vs baseline, CMR-40% Vs baseline), and sampled over the HCP-MMP 1.0 atlas6, which included 180 cortical Region Of Interest (ROI) for each hemisphere.
Machine Learning: we performed a classification experiment predicting the subject class (i.e. NR Vs DD) combining all fMRI contrast maps (i.e. Task 1-M, Task 1-P, CMR-6%, CMR-15% and CMR-40%). In particular, we used the Group Lasso implementation of the Multiple Kernel - Support Vector Machine (MK-SVM) algorithm7. We assigned a different linear kernel to each atlas ROI, each characterized by a feature vector of five elements (i.e. the average value of each contrast map). The MK-SVM algorithm computes a weight for each kernel, thus providing an estimate of the importance of each ROI for the classification task. A leave-one cross-validation procedure was applied to test the classifier and a nested 10-fold cross validation procedure was used for the hyper-parameter optimization. The classifier performances were assessed computing the classification accuracy and the Area Under the Receiver Operating Characteristic (ROC) curve. A 10'000 label permutation experiment was performed to investigate whether the classifier performance was significantly different from the random choice.
Results
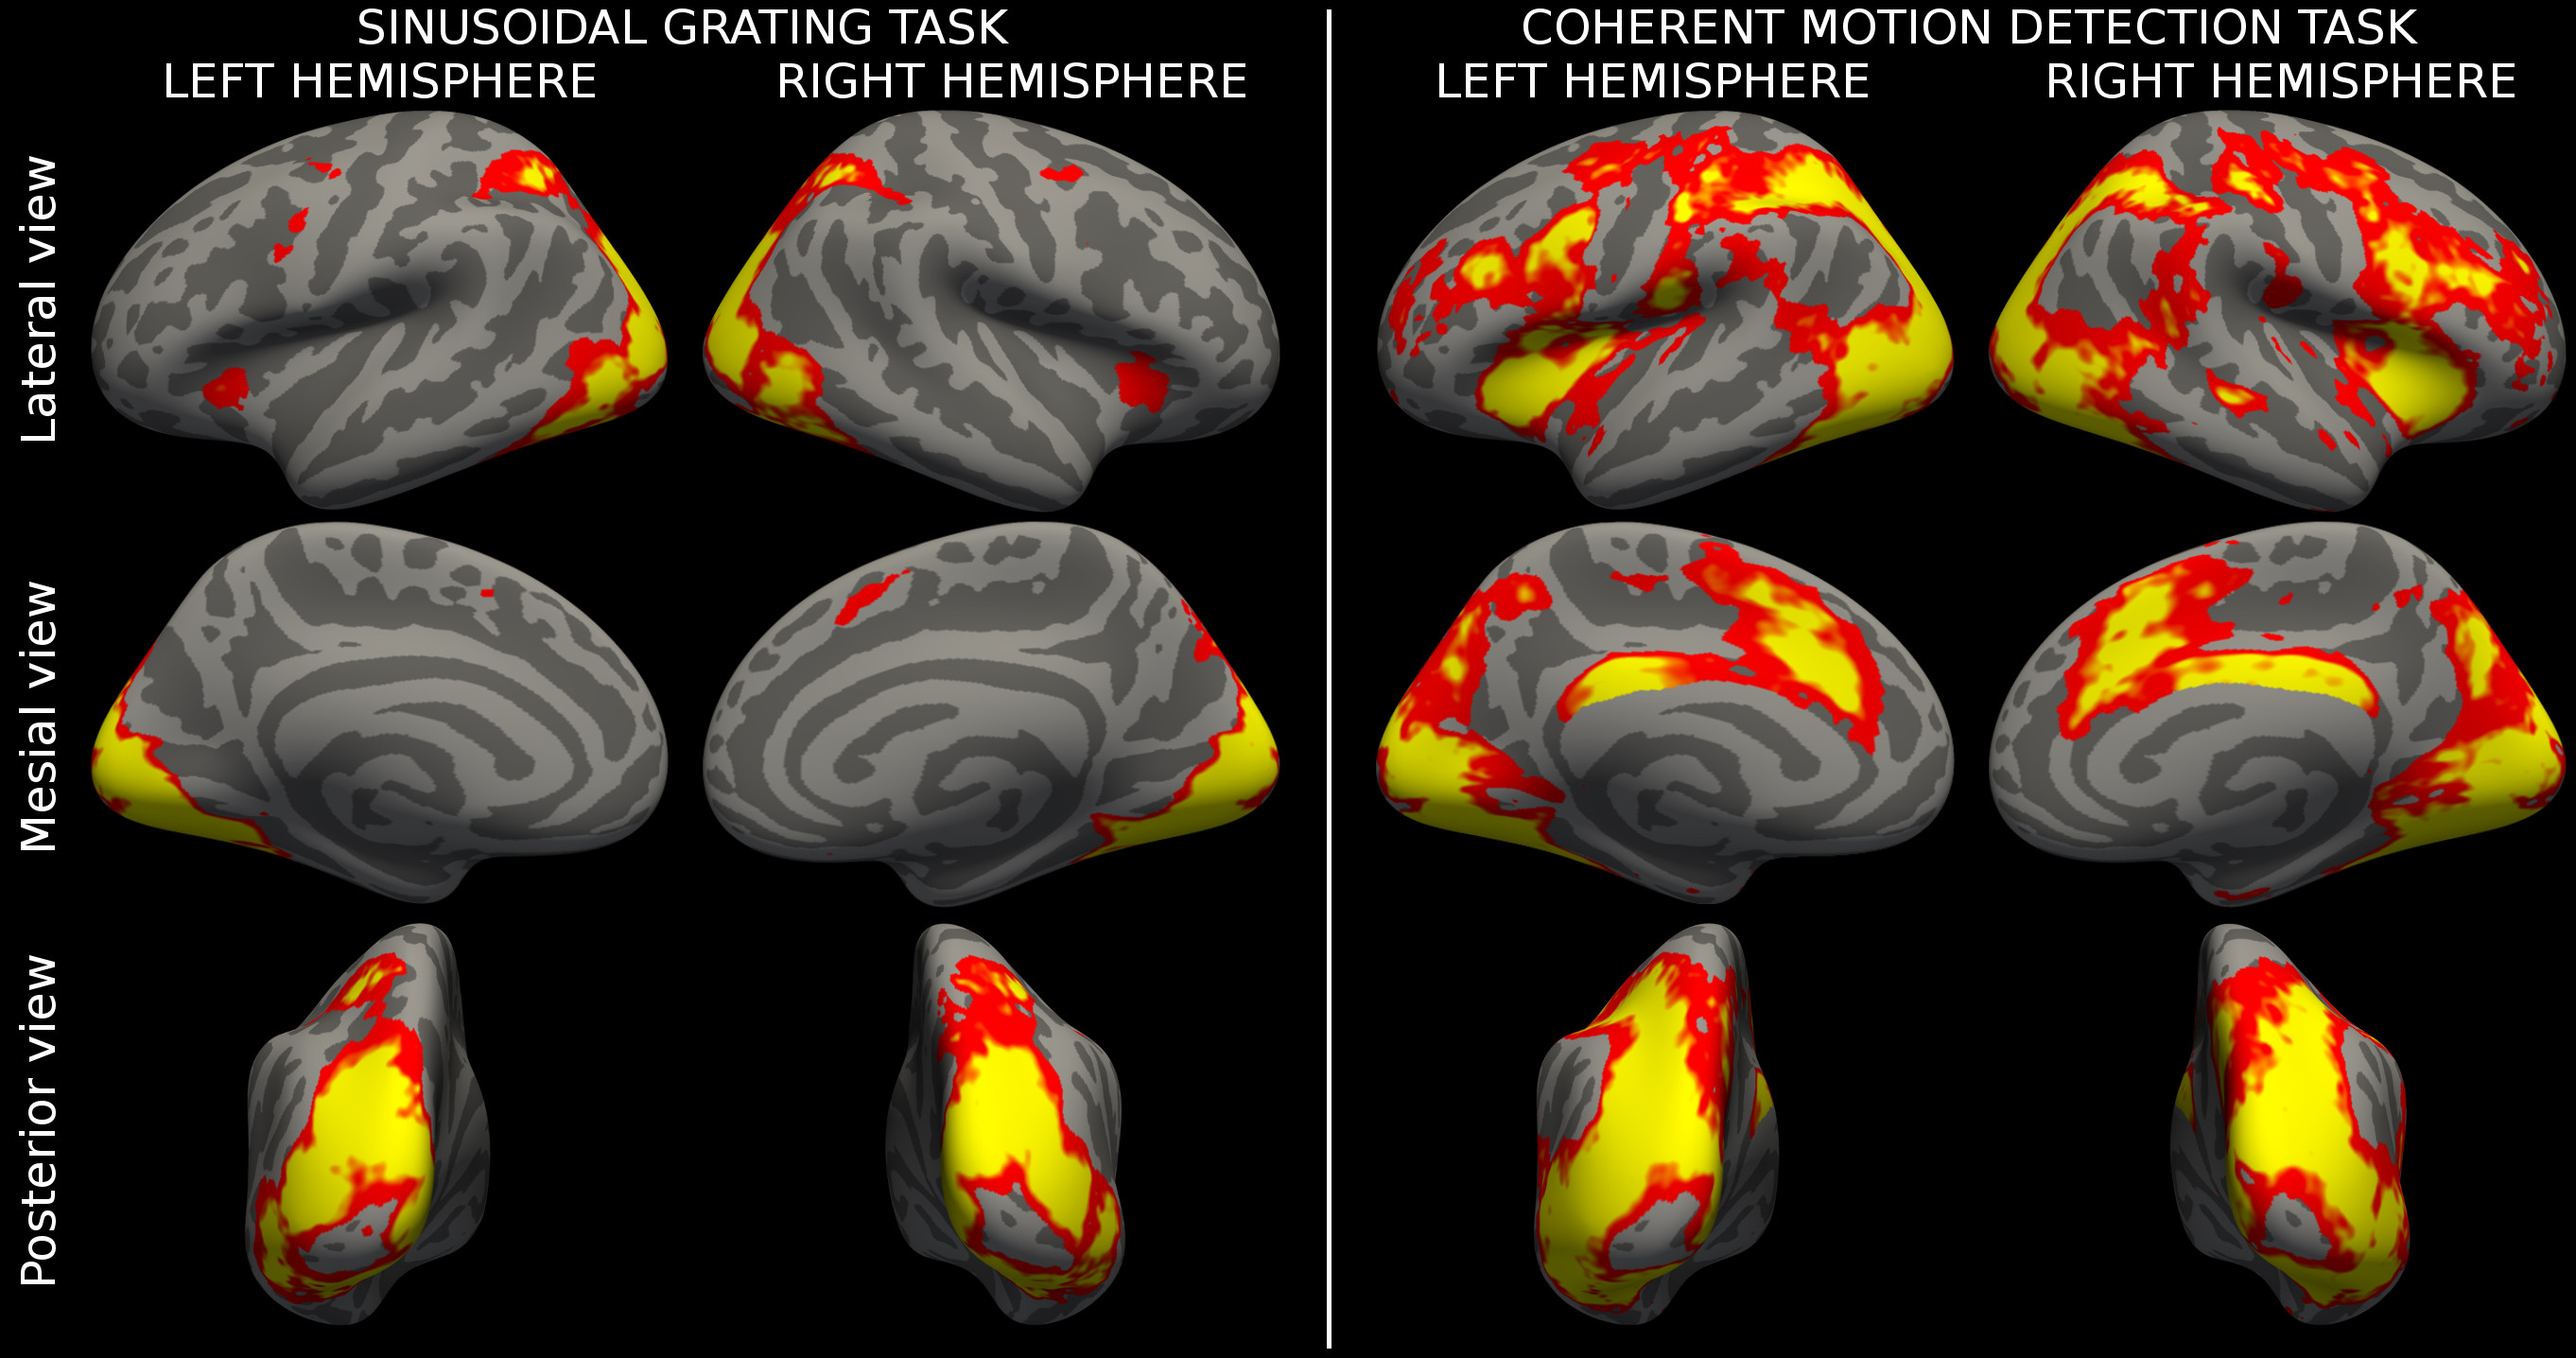
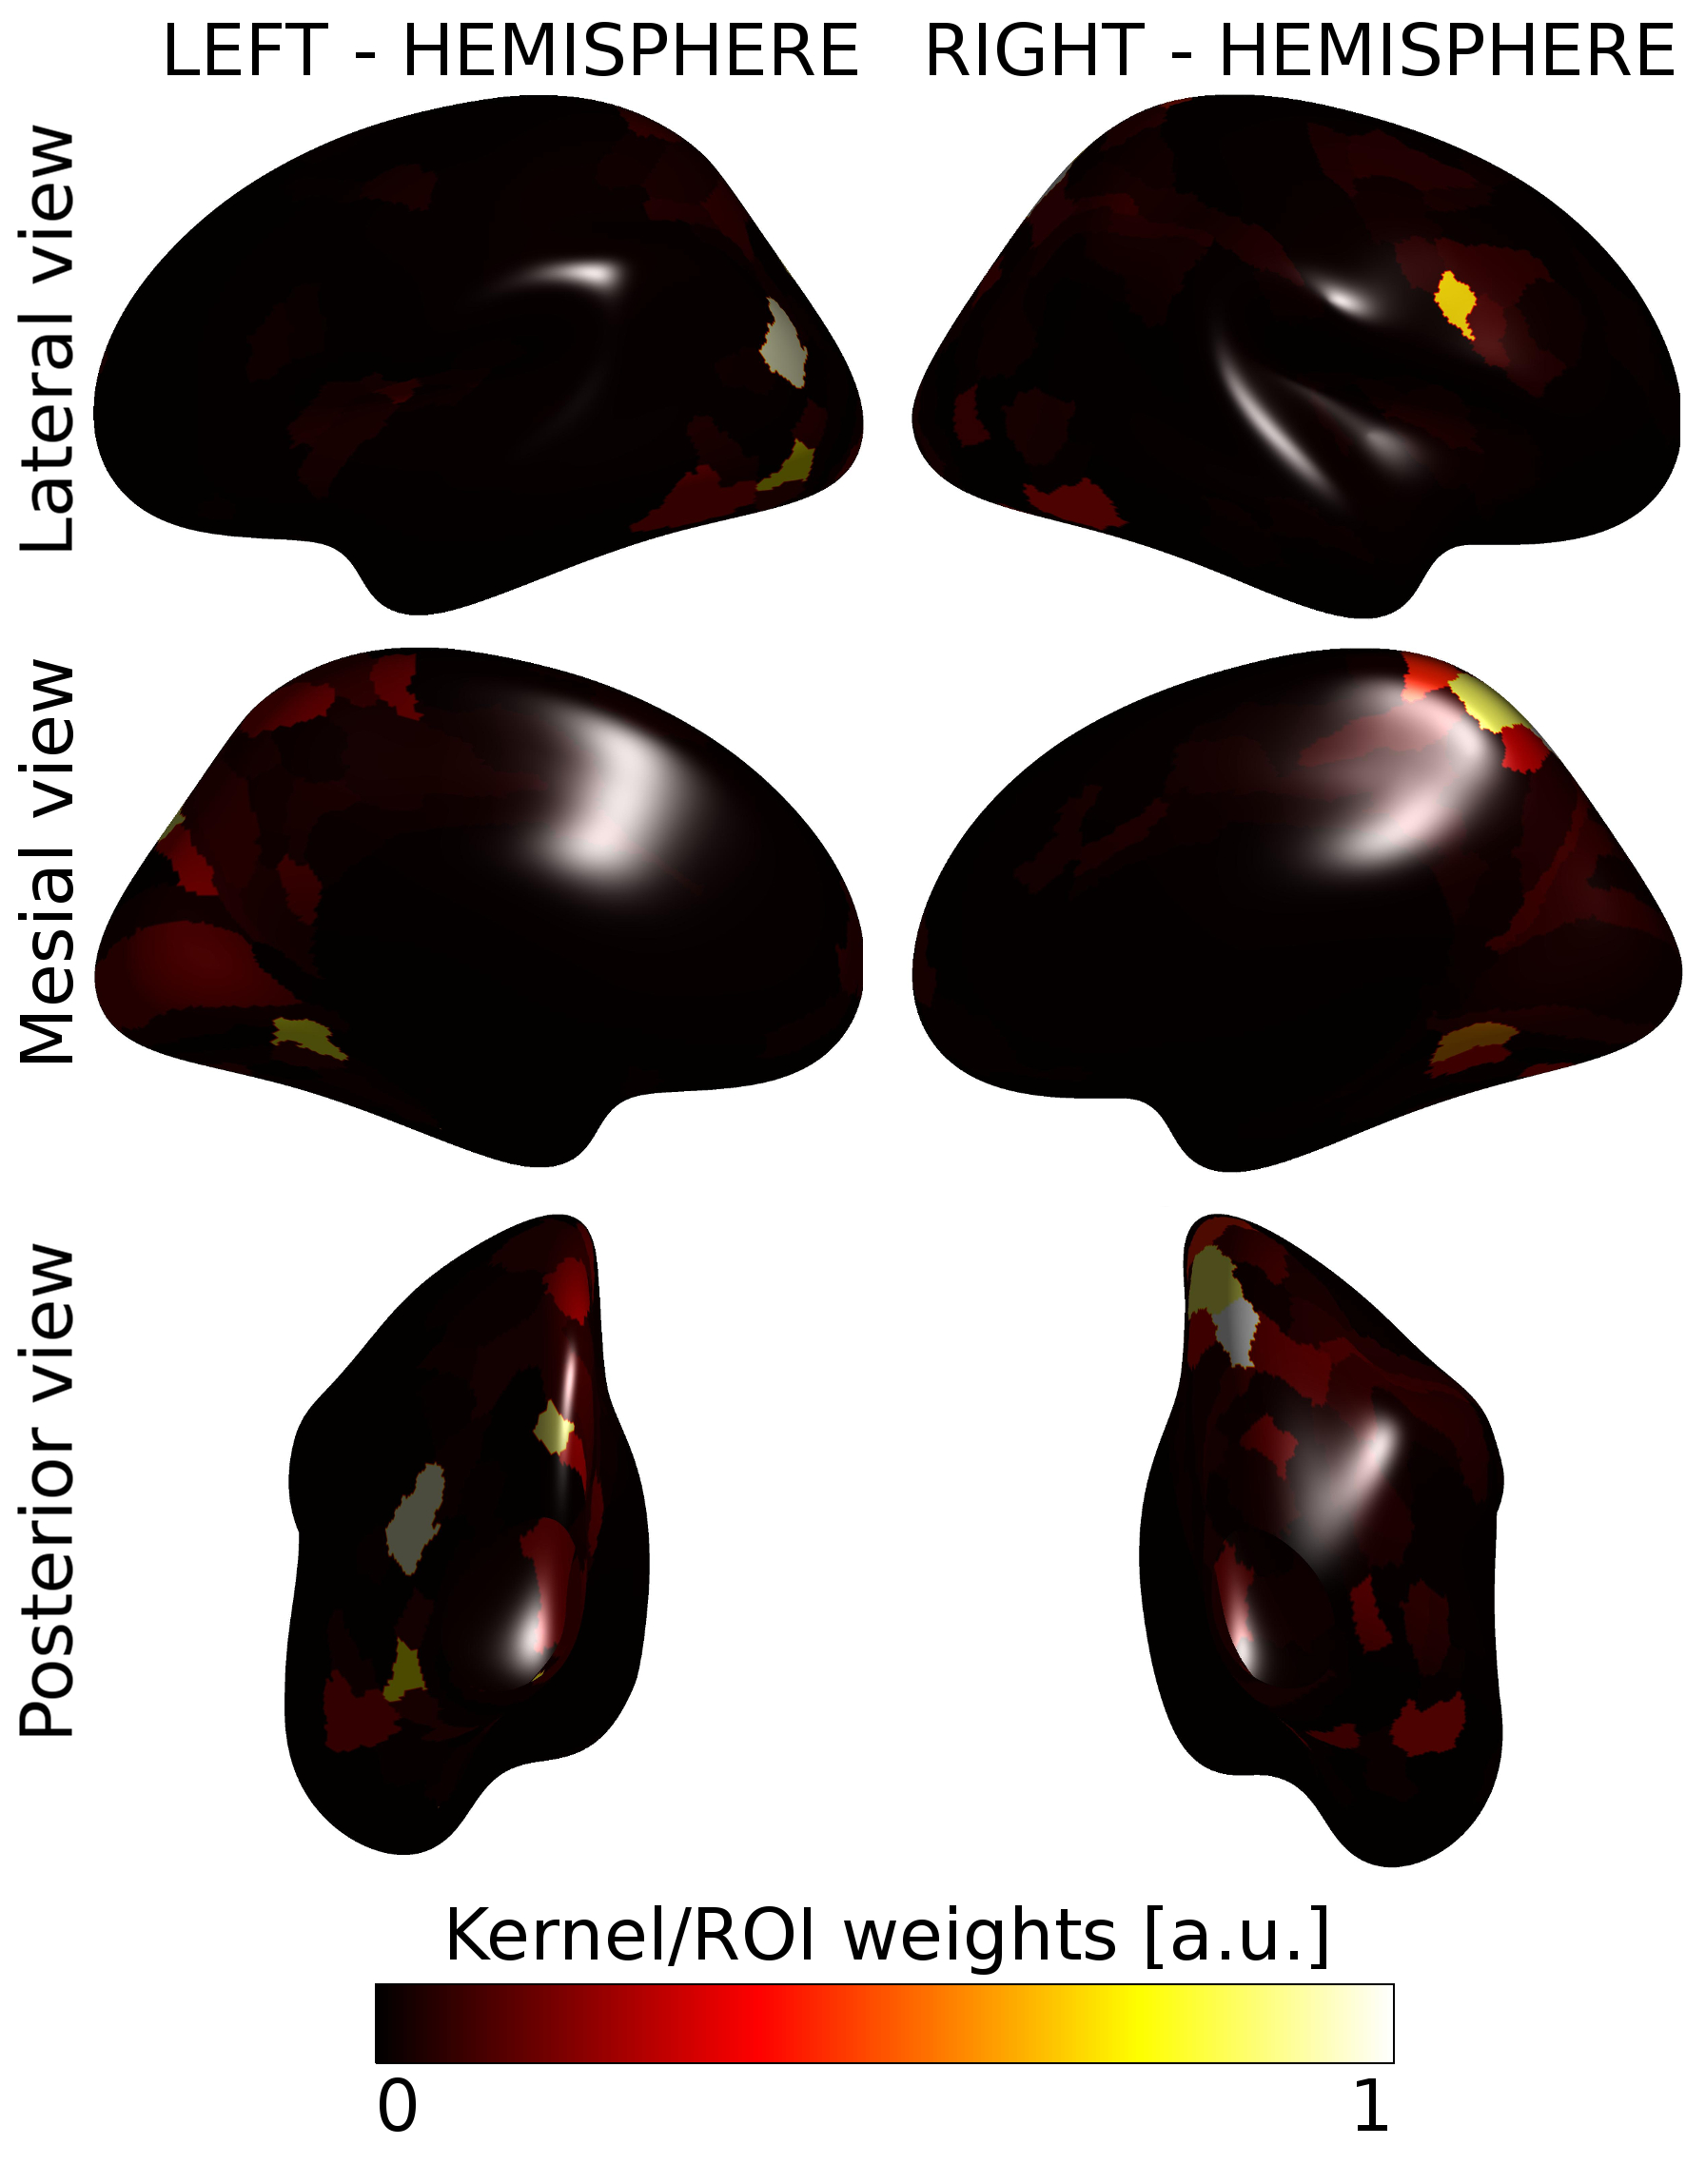
Figure 3 showed the population activation maps for the grating and for the CDM tasks. Both tasks involved the visual processing areas, with the CDM recruiting also frontal areas usually associated with attentive functions.The MK-SVM algorithm reached a classification accuracy of 65.9% and an AUC of 0.647, significantly over the random choice (p=0.043). Figure 4 shows the kernel weights associated with each ROI. Few ROIs (15/360) account for more than 50% of the overall classification weights and are located mainly in the visual areas, in the dorsal stream, including the neighboring parietal areas, and in the inferior frontal area.
Discussion and conclusion
By combining the activation patterns in two well-established visual tasks, we discriminated between NR and children with DD. Our findings suggest that the M functions may discriminate NR and subjects with DD and support the M deficit theory of DD. Indeed, while the phonological deficit hypothesis remains the most widely accepted8, recent studies focused on the amodal temporal deficits for both auditory and visual rapid stimuli (cf. the M deficit theory) as causal factors of the temporal deficits in DD (sluggish attentional shifting9).The MVPA approach successfully combined multi-domain data and provided a tool to effectively analyze a complex spatial disease more likely involving complex processing networks rather than single punctual regions of the brain.
Acknowledgements
This work was supported by the Italian Ministry of Health ("Ricerca corrente" funds)References
1. American Psychiatric Association. Diagnostic and Statistical Manual of Mental Disorders, 5th edn. American Psychiatric Press, Washington, DC. 2013
2. Stein J. The current status of the magnocellular theory of developmental dyslexia. Neuropsychologia 2019; 130: 66-77
3. Denison RN, Vu AT, Yacoub E, Feinberg DA, Silver MA. Functional mapping of the magnocellular and parvocellular subdivisions of human LGN. Neuroimage 2014; 102(2): 358–69.
4. Cicchini GM, Marino C, Mascheretti S, Perani D, Morrone MC. Strong Motion Deficits in Dyslexia Associated with DCDC2 Gene Alteration. J Neurosci 2015; 35: 8059–8064.
5. Fischl, B., Liu, A., Dale, A.M. Automated manifold surgery: constructing geometrically accurate and topologically correct models of the human cerebral cortex. IEEE Trans Med Imaging 2001; 20: 70-80.
6. Glasser MF, Coalson TS, Robinson EC, Hacker CD, Harwell J, Yacoub E, Ugurbil K, Andersson J, Beckmann CF, Jenkinson M, Smith SM, Van Essen DC. A multi-modal parcellation of human cerebral cortex. Nature 2016; 11;536(7615):171-178.
7. Xu Z, Jin R, Yang H, King I, Lyu MR. Simple and efficient multiple kernel learning by group lasso. Proceedings of international conference on machine learning ICML 2010; 1175–1182.
8. Bishop DVM, Snowling MJ. Developmental dyslexia and specific language impairment: same or different? Psychol Bull. 2004;130:858–86
9. Hari, R., & Renvall, H. Impaired processing of rapid stimulus sequences in dyslexia. Trends in Cognitive Sciences 2001; 5(12): 525-532
Figures