4627
Power-law fits for the direction-averaged diffusion MRI signal: a potential marker for white matter maturation in non-feeding infants1Department of Neuroscience, Medical University of South Carolina, Charleston, SC, United States, 2Department of Neurology, Medical University of South Carolina, Charleston, SC, United States, 3Center for Biomedical Imaging, Medical University of South Carolina, Charleston, SC, United States, 4Brain Stimulation Laboratory, Department of Psychiatry, Medical University of South Carolina, Charleston, SC, United States, 5Department of Pediatrics and Neonatology, Medical University of South Carolina, Charleston, SC, United States
Synopsis
Preterm or hypoxic ischemic birth is associated with postpartum feeding problems and white matter dysmaturation. Noninvasive vagus nerve stimulation has been proposed as therapy, and here we explore the application of high b-value diffusion MRI to assess changes in white matter following stimulation. Our hypothesis is that using high b-values will improve sensitivity to alterations in white matter as compared with traditional diffusion measures. Power-law fits for high b-value diffusion MRI data were investigated in 12 neonates. We find that the power-law exponent decreases in early development and give preliminary results for its application as a marker for treatment response.
Introduction
Preterm or hypoxic ischemic (HIE) birth has been shown to result in white matter (WM) dysmaturation and impaired motor skills. A common consequence is the inability to master oral feeding postpartum. Transcutaneous auricular vagus nerve stimulation (taVNS) paired with feeding has been proposed as a technique to stimulate WM maturation in infants.1 To monitor treatment, there is a need for non-invasive measures with a good sensitivity to WM changes. Here we investigated power-law fits for the direction-averaged diffusion MRI (dMRI) signal at high b-values in 12 neonates between 38-54 weeks of gestational age (GA). Recent work has shown that, in adult WM, the direction-averaged dMRI signal at high b-values (≥4000s/mm2) is dominated by intra-axonal water and decays as a power law.2-4 Our hypothesis is that high b-values increase sensitivity to alternations in WM by enhancing the relative contribution of water within axons compared to extra-axonal water. The variation in the power-law exponent with age was compared to traditional dMRI metrics. For a subset of 6 infants with longitudinal dMRI data, the ability of the exponent’s rate of change to predict taVNS treatment response was investigated.Methods
Twelve preterm or HIE infants born at 32±5.3 weeks GA were scanned on a Siemens Skyra 3T MRI. The GA ranged between 38-54 weeks at time of scanning. All subjects were enrolled in a taVNS study to treat the inability to master feeding. On average, patients received 23±13 taVNS sessions.Data were obtained using a twice-refocused dMRI sequence for b=0,1000,2000,4000,6000s/mm2 and 64 diffusion-encoding directions. Other imaging parameters were: TE=141 ms, TR=6400 ms and voxel-size=(3mm)3. Scans were acquired before and after taVNS. Data quality was improved by denoiseing,5 removing Gibbs ringing artifacts,6 and correcting for Rician noise bias7 and motion.8 Of the 24 dMRI datasets, 6 were discarded due to excessive motion artifacts. However, each subject had at least one good dataset, and 6 had usable data for both time points.
The direction-averaged dMRI signal ($$$\overline{S}$$$) was calculated for dMRI data with b-values b4=4000s/mm2 and b6=6000s/mm2 by averaging over all gradient directions. In healthy adults, it has been shown that the b-value dependence of ($$$\overline{S}$$$) follows a power-law decay ($$$\overline{S}=C \cdot b^{-\alpha}$$$).2 Here, the apparent exponent alpha ($$$\alpha$$$) was calculated using: $$\alpha=\frac{ln(\overline{S}_4/\overline{S}_6)}{ln(b_6/b_4)} (1),$$ where $$$\overline{S}_4$$$ and $$$\overline{S}_6$$$ represent $$$\overline{S}$$$ at b=b4 and b=b6, respectively. We refer to the exponent calculated with Eq.1 as “apparent” because a power-law decay was not empirically verified as has been done in adults.
Since WM continues to develop postpartum, we studied the relation between $$$\alpha$$$ and age at time of scan. We focused on the posterior limb of the internal capsule (PLIC), as it is one of the first regions to myelinate. As comparison, conventional diffusion metrics were calculated9 from dMRI data with b=0-2000s/mm2. In addition, these were used for tract-based spatial statistics (TBSS) to locate the fractional anisotropy (FA) skeleton which was used as a WM mask.10
Results
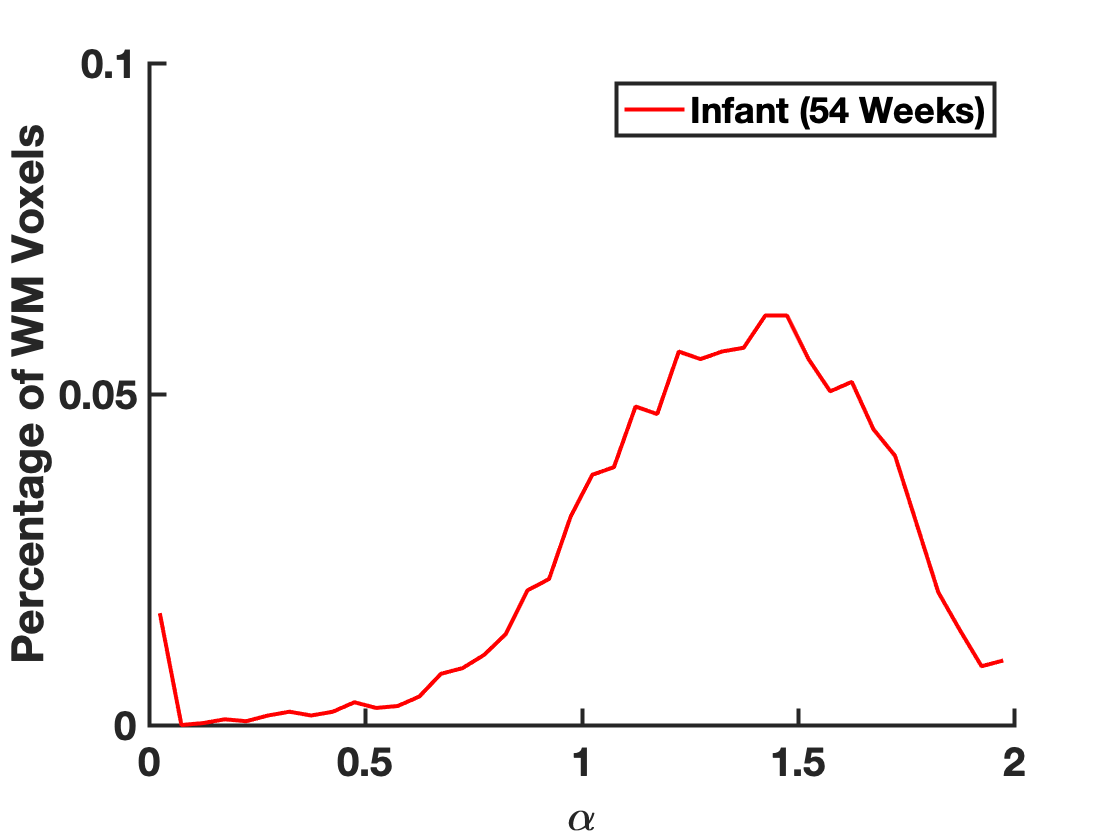
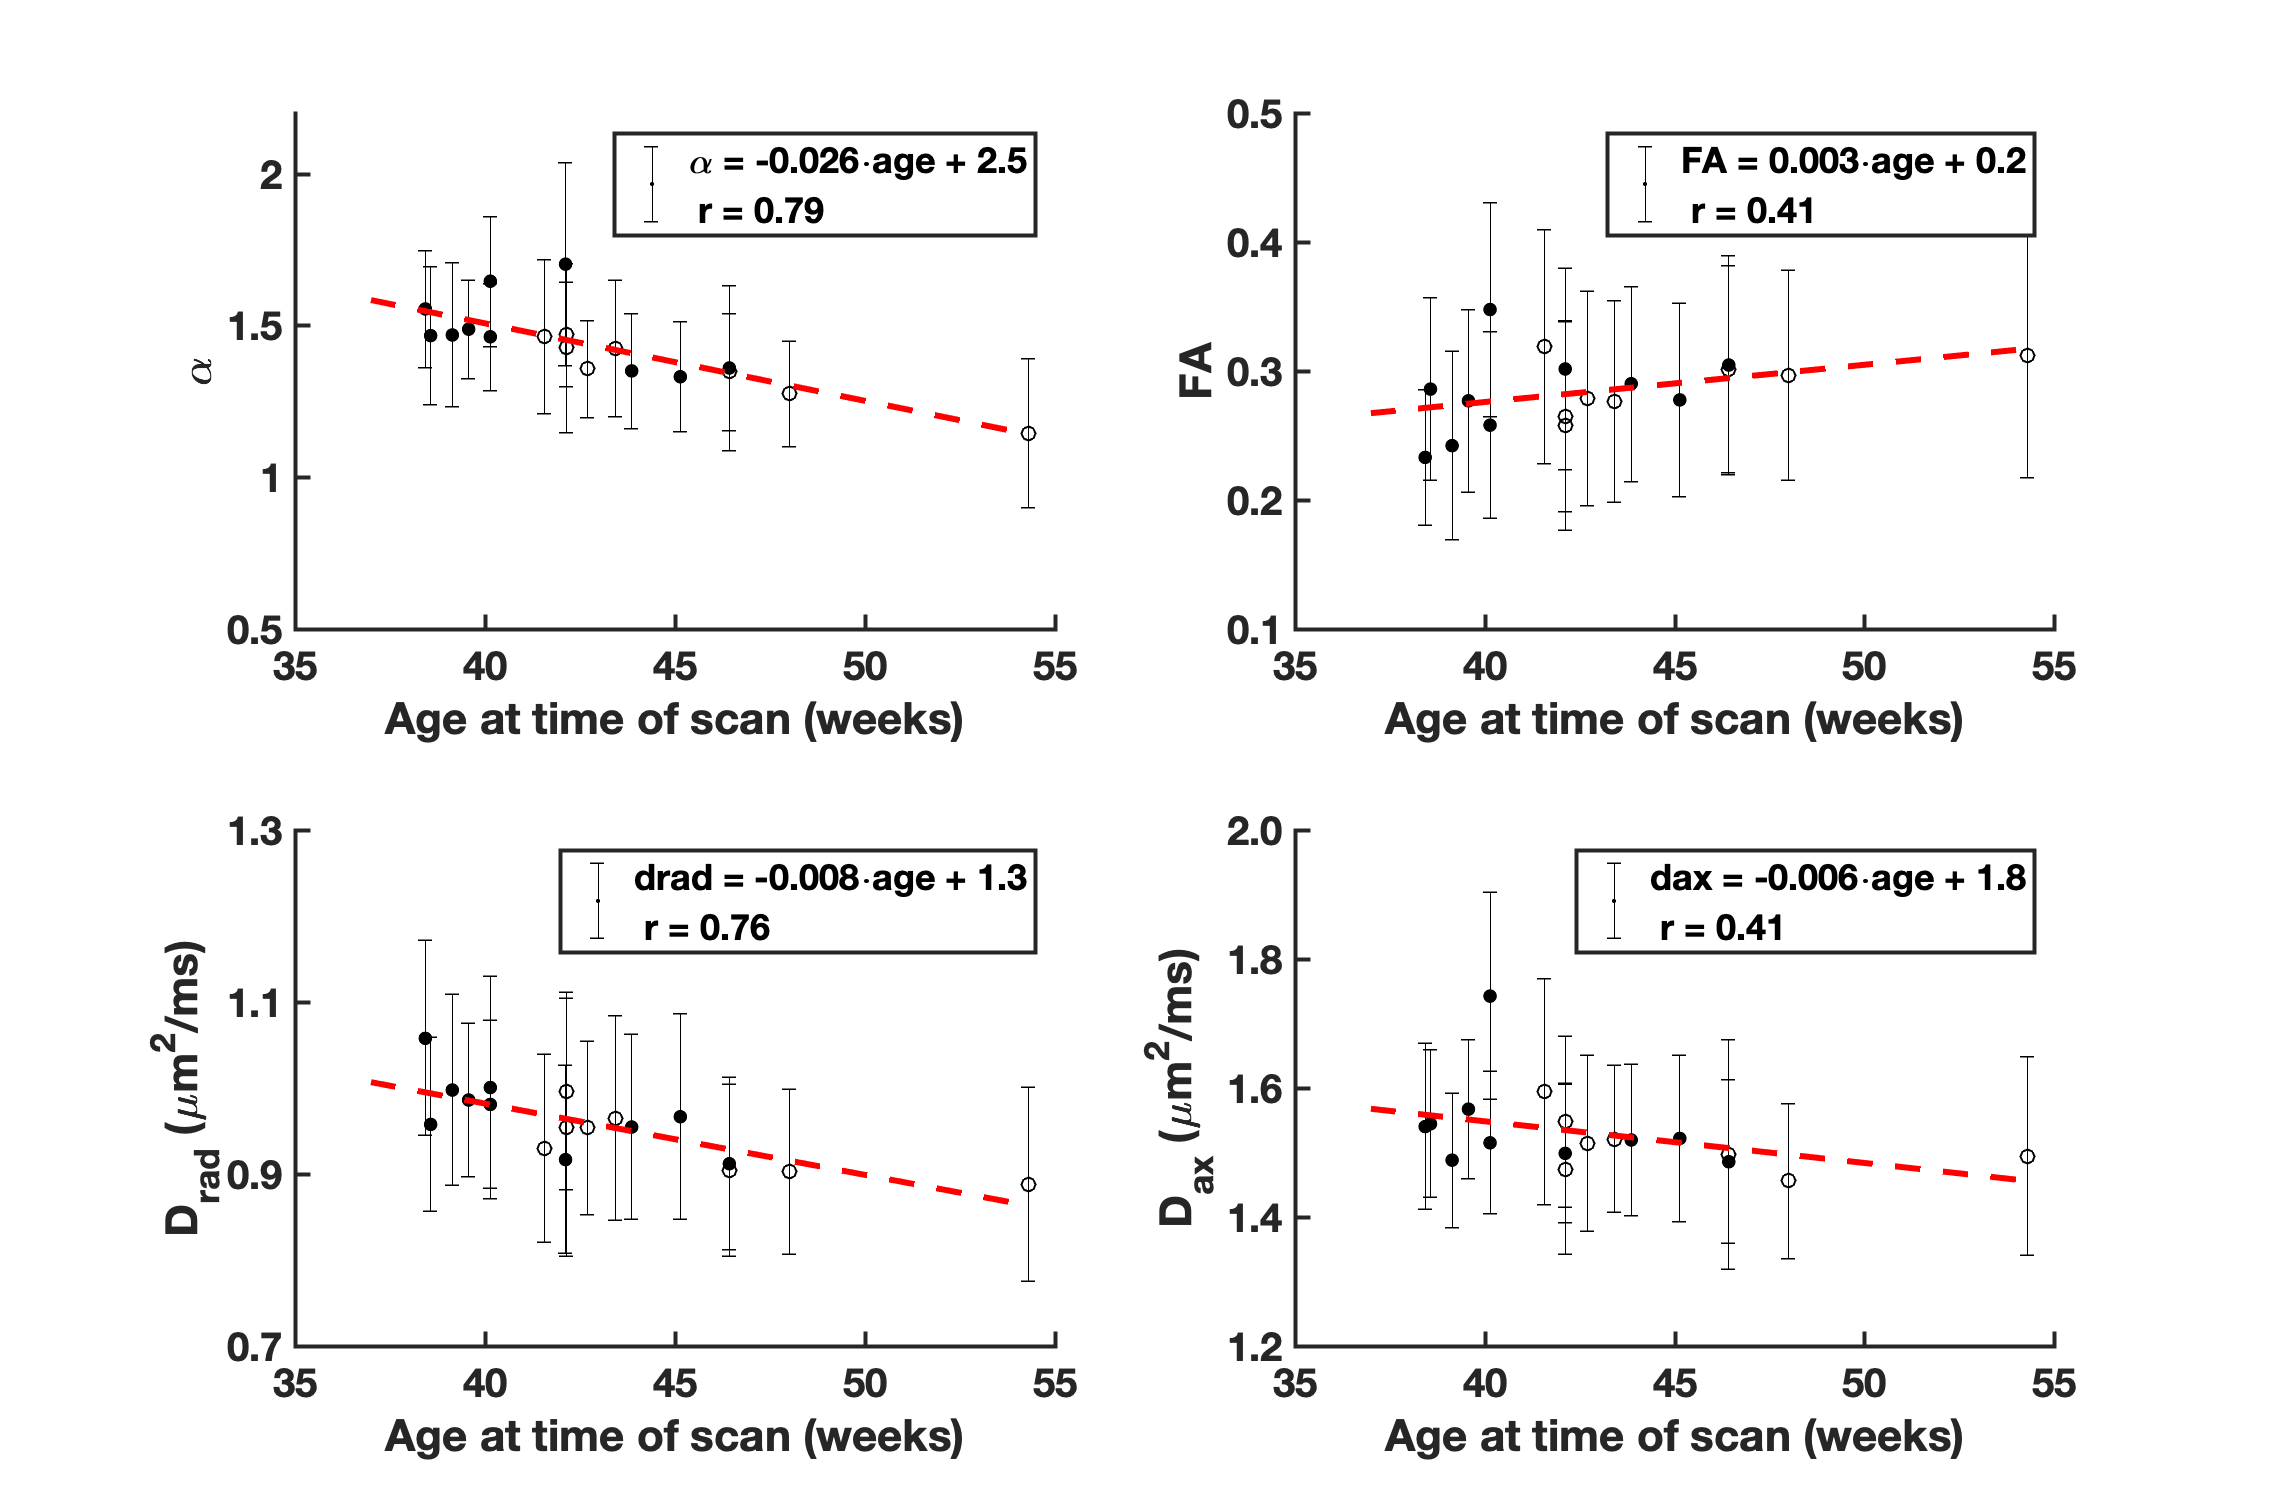
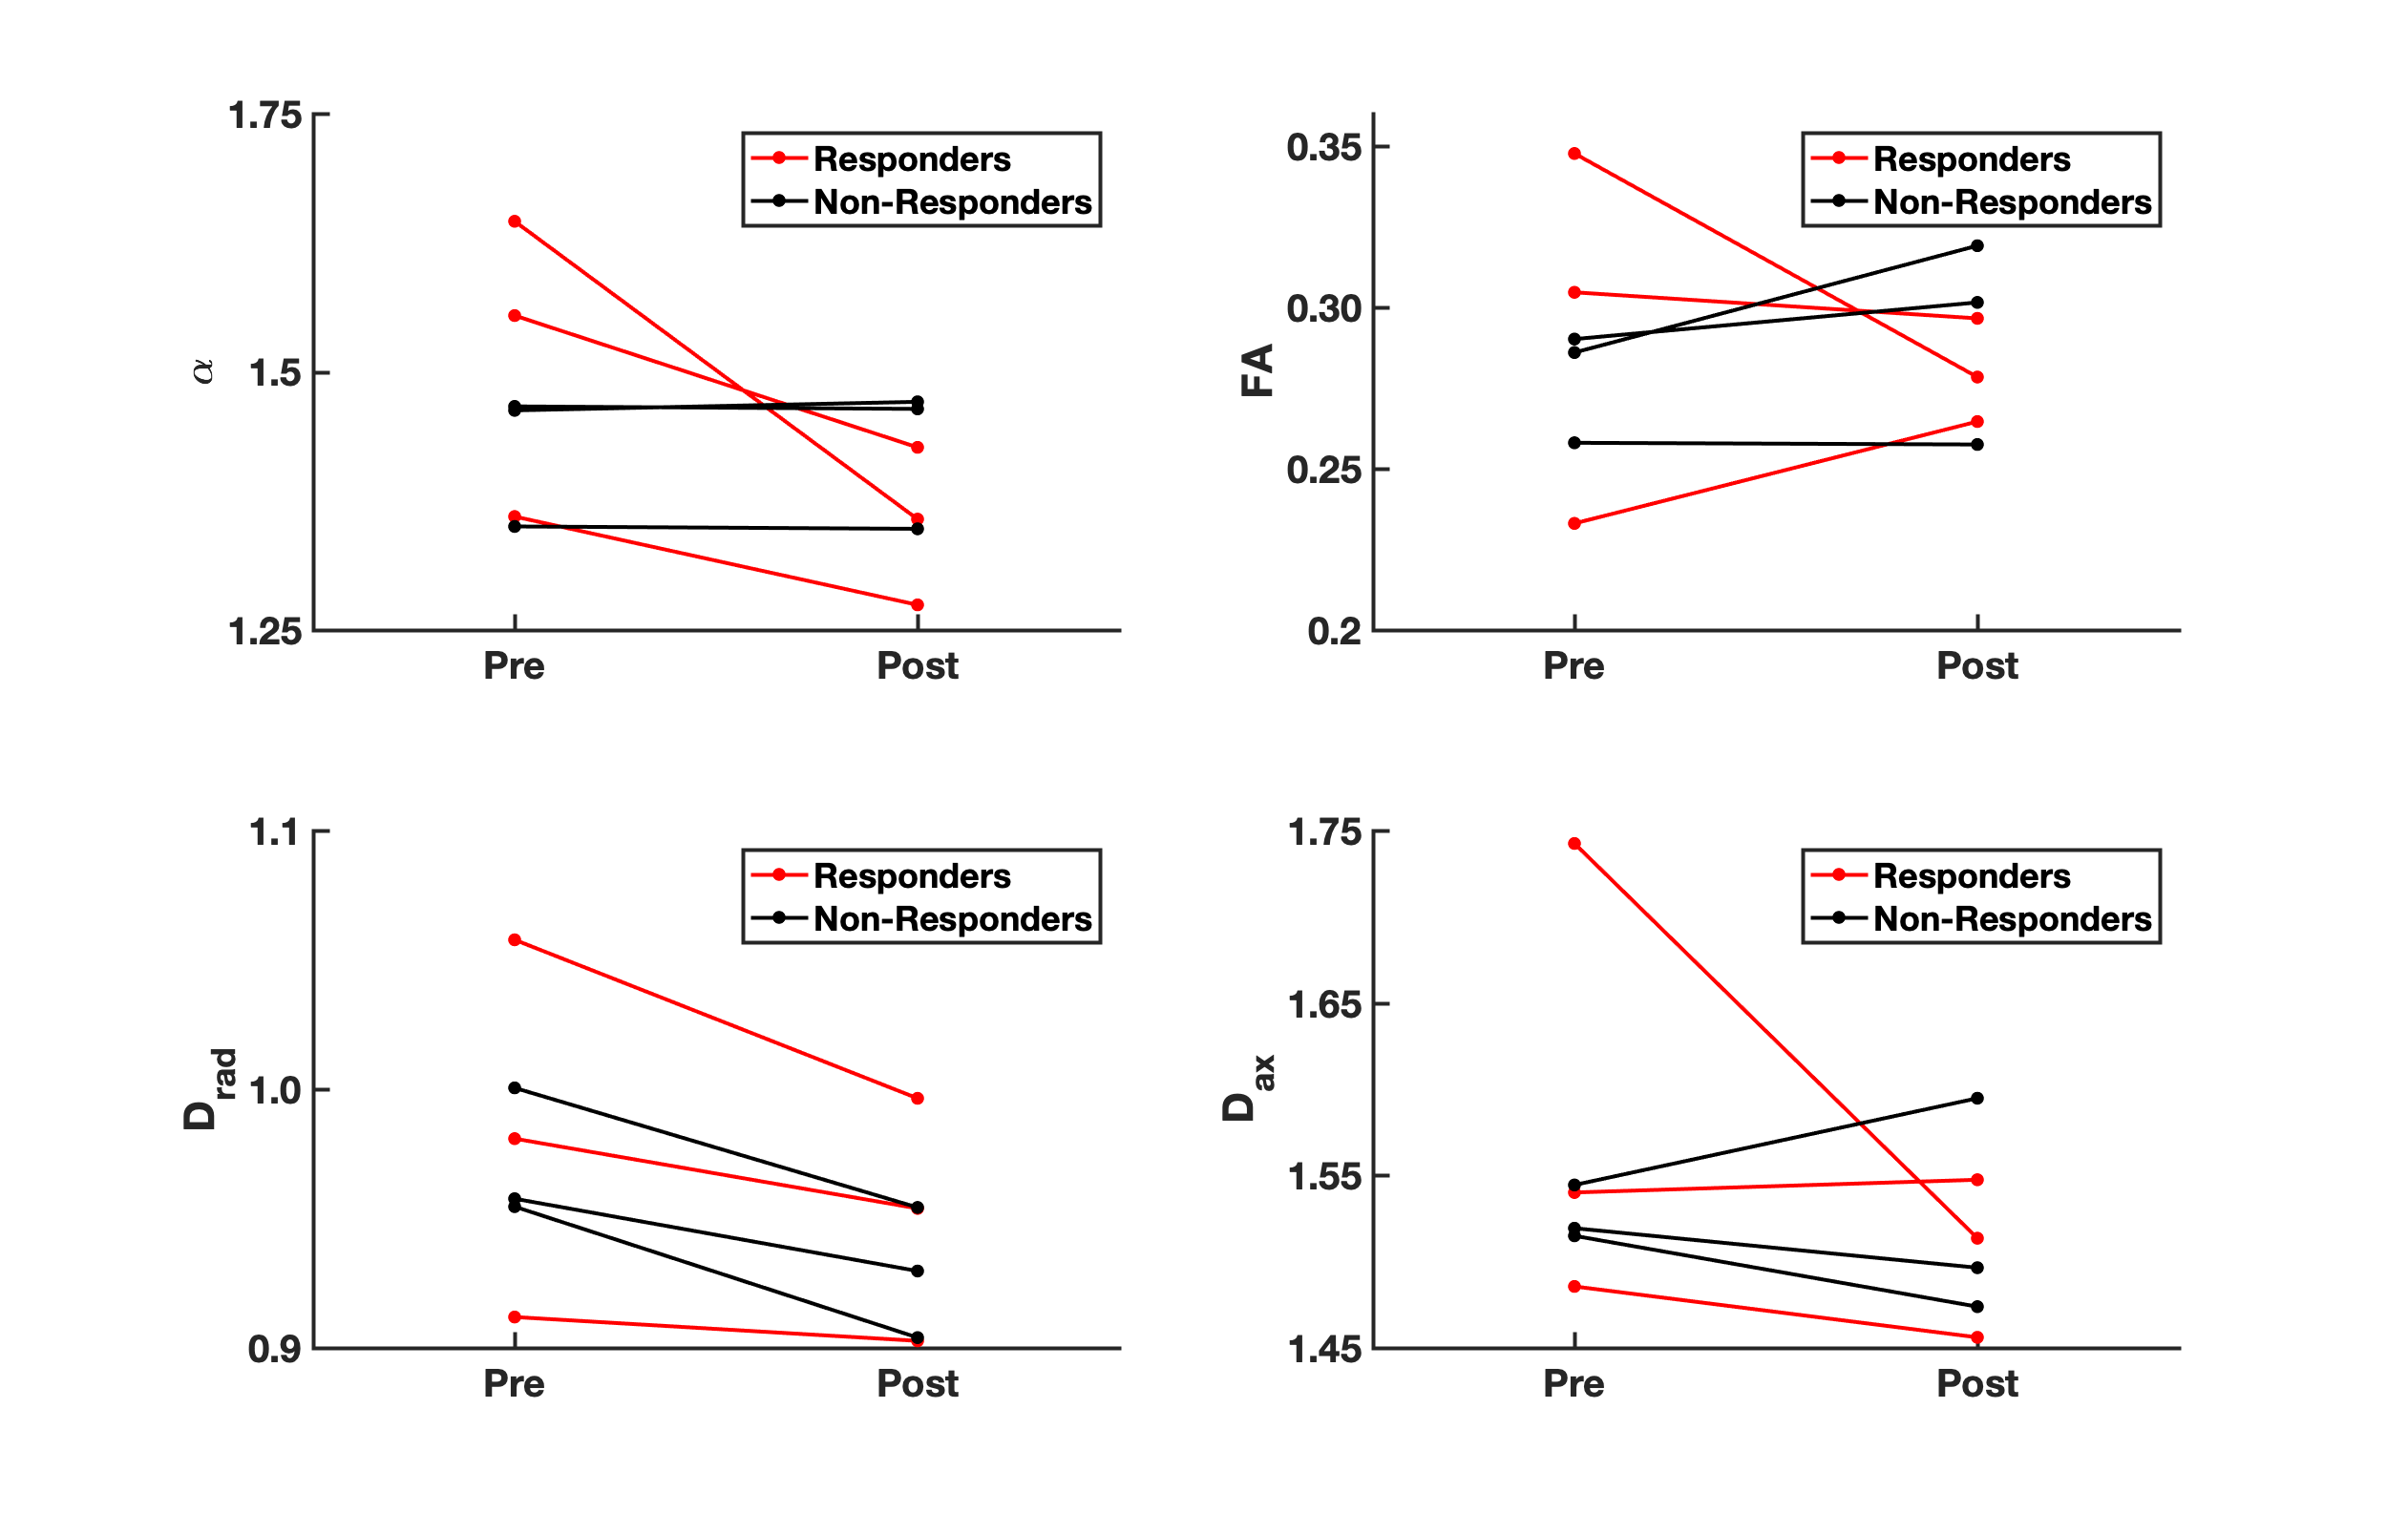
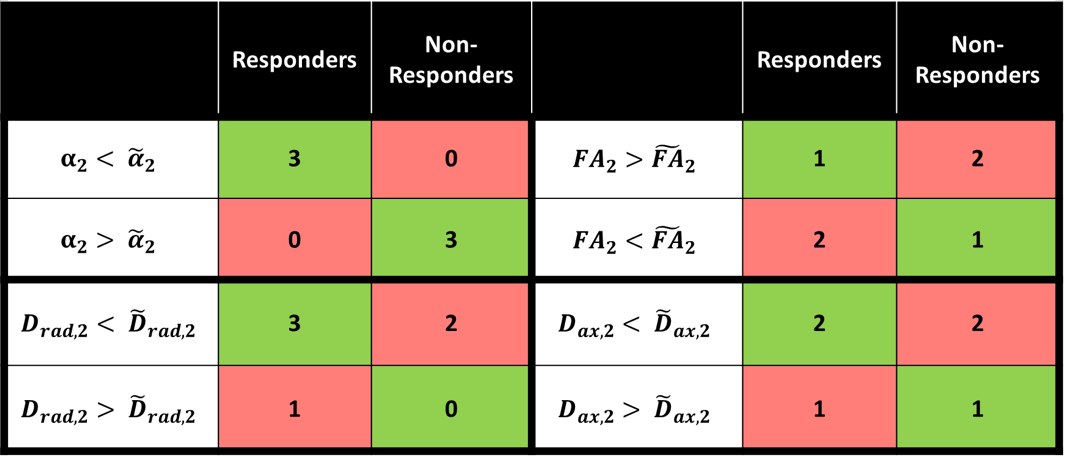
Figure 1 demonstrates the distribution of $$$\alpha$$$ in WM for an infant of 54 weeks GA. The average value $$$\alpha=1.37\pm0.8$$$ is significantly higher than values previously reported for adults.2-4 Figure 2 demonstrates that in the PLIC $$$\alpha$$$, radial diffusivity (Drad), and axial diffusivity (Dax) decrease rapidly in early development, while FA increases with age. Note that $$$\alpha$$$ had the largest correlation coefficient ($$$r=0.79$$$). Figure 3 shows how the metrics change in the PLIC for 6 infants before and after taVNS. The red lines correspond to infants that responded well to taVNS. Responders consistently show a drop in $$$\alpha$$$, while other metrics either had a mixed response or showed no difference between responders and non-responders. To quantify this, we calculated confusion matrices (Figure 4) by estimating the diffusion metrics at follow up using the trendlines from Figure 2. For example, a data point was considered a true positive when $$$\alpha$$$ at follow up ($$$\alpha_2$$$) was smaller than the estimated $$$\widetilde{\alpha}_2$$$. A similar analysis was done for all metrics. The treatment response was predicted better by $$$\alpha$$$ (specificity:100%, sensitivity:100%) than by FA (specificity:33%, sensitivity:33%), Drad (specificity:0% sensitivity:60%) or Dax (specificity:50%, sensitivity:50%).Discussion
The apparent exponent $$$\alpha$$$ in infants was found to be substantially lower than in adult WM.2,3 A possible mechanism for this is more rapid intercellular water exchange due to the lesser degree of myelination for infants. Other contributing factors might be the large population of cell bodies present in early development.11 In the PLIC, $$$\alpha$$$ decreased linearly with age at an average rate of 0.03/week. Infants that responded well to treatment had WM changes consistently higher than this rate while non-responders had little to no observable change in $$$\alpha$$$. Within this limited dataset, $$$\alpha$$$ demonstrated the best predictive power for treatment response (specificity:100%, sensitivity:100%). The better sensitivity for $$$\alpha$$$ could be a consequence of high b-value dMRI data being more heavily weighted with contributions from water in restricted compartments, such as myelinated axons, in comparison to signal from lower b-value data. Future work should focus on increasing the sample size and on validating the power-law dependence in infants. Nonetheless, our preliminary results suggest that using high b-value dMRI is potentially useful in the study of WM maturation of non-feeding infants treated with taVNS.Acknowledgements
This work was supported by F31NS108623 (to H. Moss) and T32DC014435 (to J. Dubno).References
1. Badran BW, Jenkins DD, DeVries WH, Dancy M, Summers PM, Mappin GM, Bernstein H, Bikson M, Coker-Bolt P, George MS. Transcutaneous auricular vagus nerve stimulation (taVNS) for improving oromotor function in newborns. Brain Stimul 2018;11(5):1198-1200.
2. McKinnon ET, Jensen JH, Glenn GR, Helpern JA. Dependence on b-value of the direction-averaged diffusion-weighted imaging signal in brain. Magn Reson Imaging 2017;36:121-127.
3. Veraart J, Fieremans E, Novikov DS. On the scaling behavior of water diffusion in human brain white matter. Neuroimage 2018.
4. Moss HG, McKinnon ET, Glenn GR, Helpern JA, Jensen JH. Optimization of data acquisition and analysis for fiber ball imaging. Neuroimage 2019;200:690-703.
5. Veraart J, Novikov DS, Christiaens D, Ades-Aron B, Sijbers J, Fieremans E. Denoising of diffusion MRI using random matrix theory. Neuroimage 2016;142:394-406.
6. Kellner E, Dhital B, Kiselev VG, Reisert M. Gibbs-ringing artifact removal based on local subvoxel-shifts. Magn Reson Med 2016;76(5):1574-1581.
7. Gudbjartsson H, Patz S. The Rician distribution of noisy MRI data. Magn Reson Med 1995;34(6):910-914.
8. Andersson JLR, Sotiropoulos SN. An integrated approach to correction for off-resonance effects and subject movement in diffusion MR imaging. Neuroimage 2016;125:1063-1078.
9. Tabesh A, Jensen JH, Ardekani BA, Helpern JA. Estimation of tensors and tensor-derived measures in diffusional kurtosis imaging. Magn Reson Med 2011;65(3):823-836.
10. Smith SM, Jenkinson M, Johansen-Berg H, Rueckert D, Nichols TE, Mackay CE, Watkins KE, Ciccarelli O, Cader MZ, Matthews PM, Behrens TE. Tract-based spatial statistics: voxelwise analysis of multi-subject diffusion data. Neuroimage 2006;31(4):1487-1505.
11. Palombo M, Ianus A, Guerreri M, Nunes D, Alexander DC, Shemesh N, Zhang H. SANDI: a compartment-based model for non-invasive apparent soma and neurite imaging by diffusion MRI. arXiv 2019(arXiv:1907.02832).
Figures