4626
Simultaneous micro- and macrostructural assessment of normal brain development1Advanced Clinical Imaging Technology, Siemens Healthcare AG, Lausanne, Switzerland, 2Department of Radiology, Lausanne University Hospital and University of Lausanne, Lausanne, Switzerland, 3LTS5, École Polytechnique Fédérale de Lausanne (EPFL), Lausanne, Switzerland, 4UMR 1253, iBrain, Université de Tours, Inserm, Tours, France, 5Pediatric Radiology Department, Clocheville Hospital, CHRU of Tours, Tours, France
Synopsis
MRI has become a routine diagnostic modality for evaluating normal structural and metabolic development of the brain in children. In this work, MP2RAGE sequence parameters and consecutive automated brain morphometry are optimized to overcome cohort-specific challenges due to wide variations in head size, head shape, and rapid changes in tissue contrast associated with myelination. Reference ranges for both volumetric and T1-relaxometry measures are built from a pediatric population with normal MRI findings. We also provide an initial assessment of potential clinical applications of these micro- and macrostructural features and corresponding normative ranges using selected cases with abnormal findings.
Introduction
Post-natal periods are crucial for brain development, characterized by volume increase, brain maturation, neuronal proliferation, neural migration, and myelination. Complementarily to the fast and inexpensive head circumference assessment [1], brain MRI is more frequently used as a first-line examination for suspected development abnormality. Rapid morphological and microstructural tissue changes during development necessitates adaptation of MR sequence parameters and post-processing to reduce potential errors and minimize bias. In this work, both the quantitative anatomical MP2RAGE sequence [2] and automated brain morphometry [3,4,5] were optimized for one- to sixteen-year-old children. Both volumetric and T1-relaxometry measures were extracted from a healthy population and used to build reference ranges. To assess the value of these micro- and macro-structural features, we report a case series comparing three patients to respective normative ranges.Material and Methods
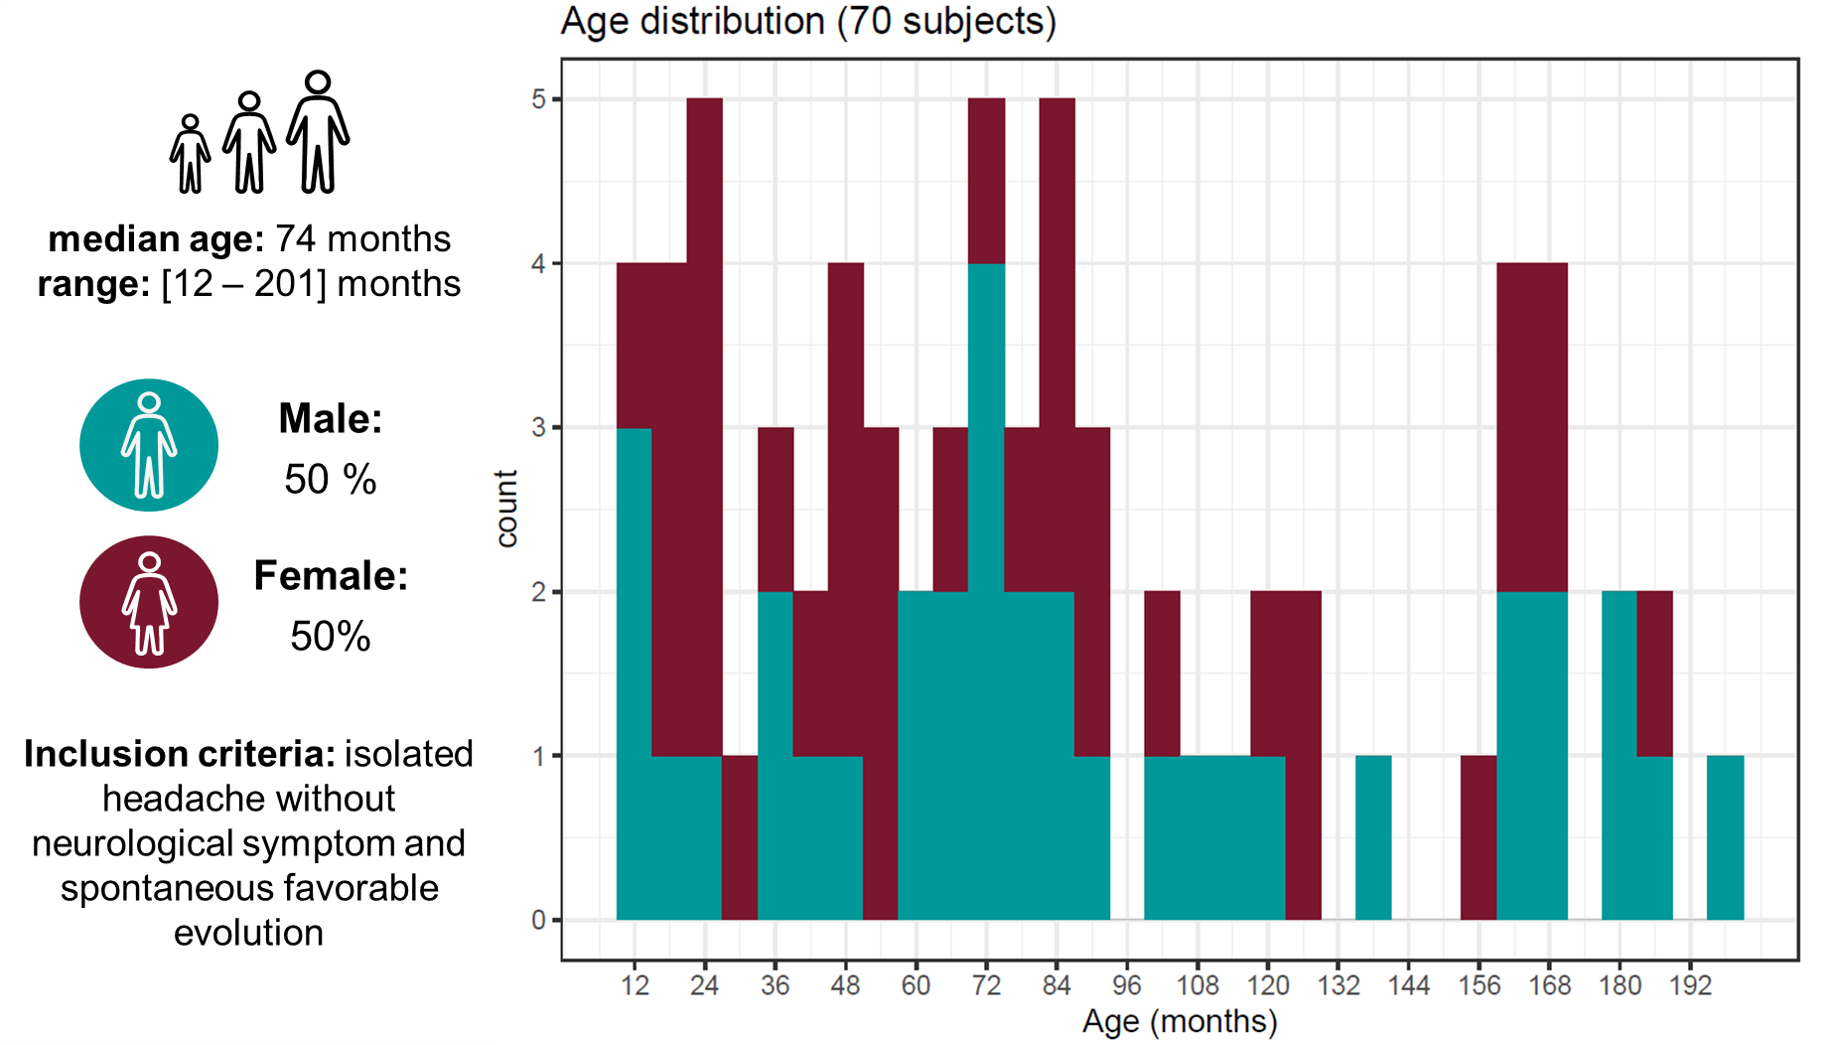
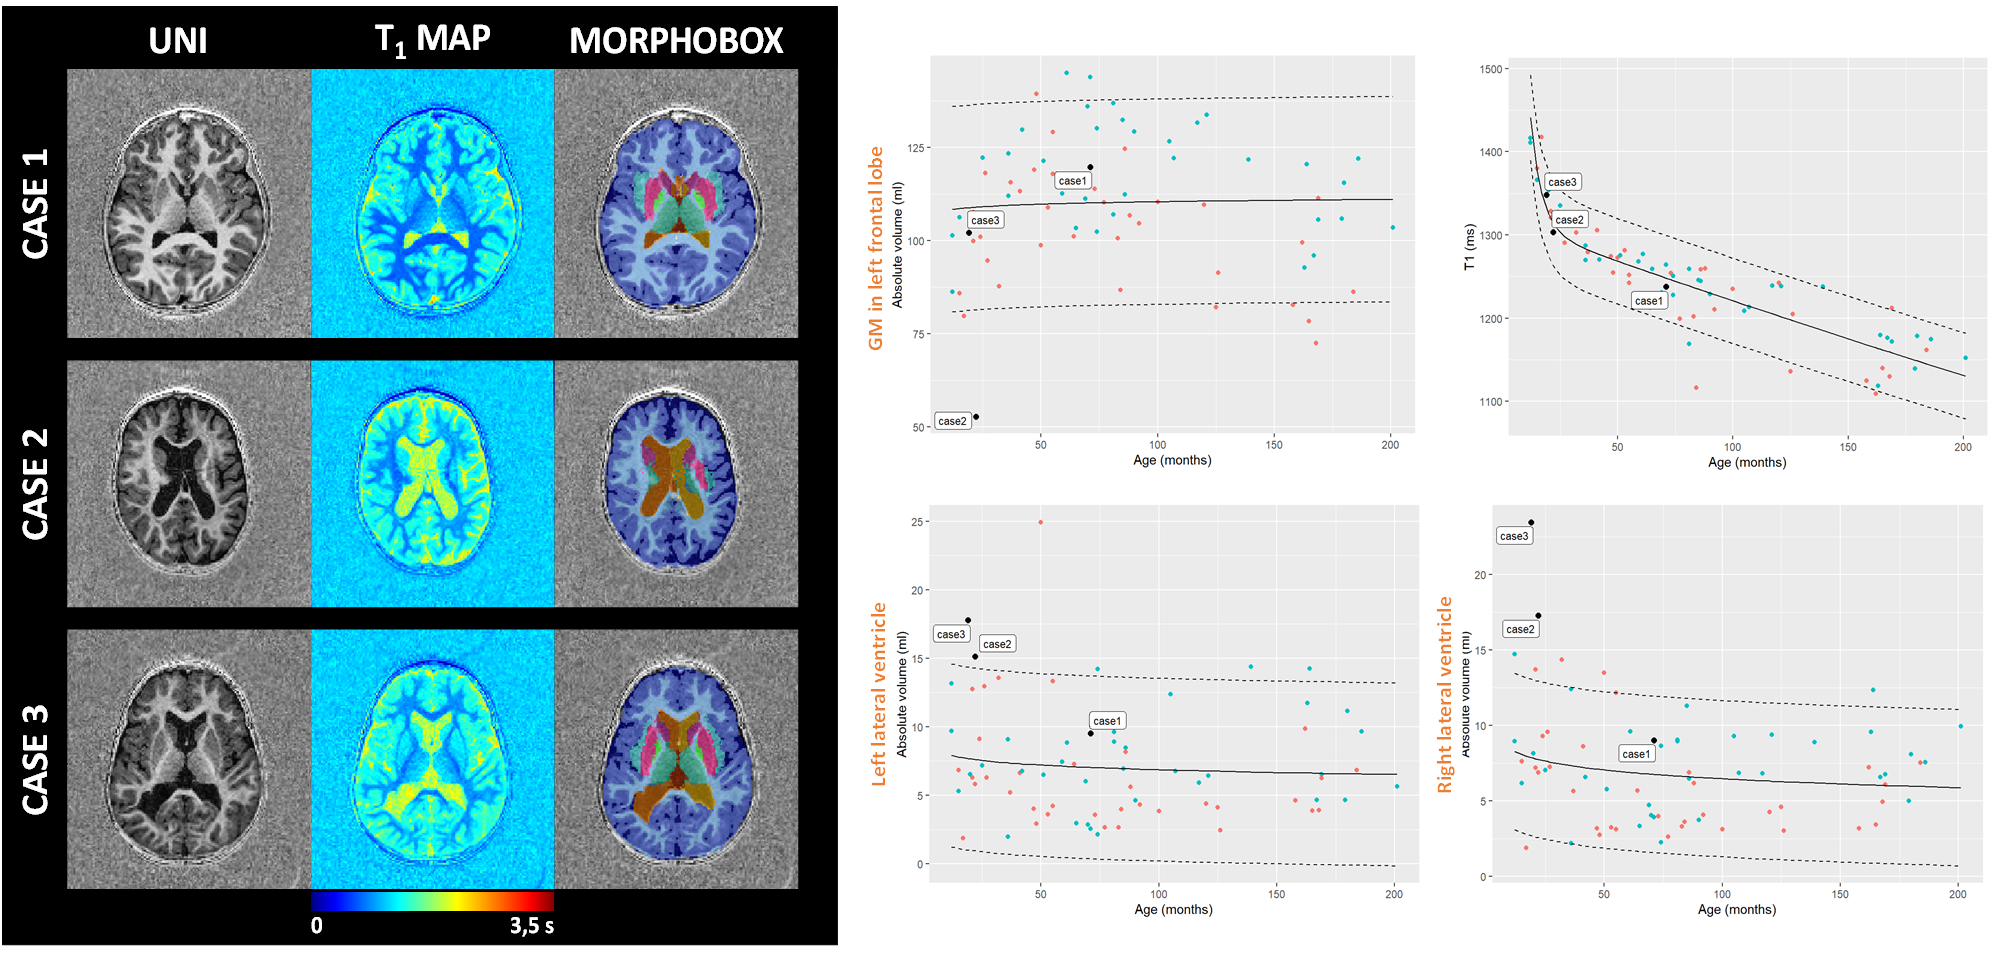
Population: 208 one- to sixteen-year-old patients were recruited within a two-year prospective study which received approval from the local ethics committee (RNI-2017-093). After the inclusion process, 70 MR exams remained (see demographics and inclusion criteria in Fig.1). Our case series was composed of a five-year-old girl with psychomotor developmental delay (Case1), a 22-month-old girl with suspected epilepsy (Case2), and a 19-month-old boy with hydrocephalus (Case3).Image acquisition: All patients were scanned at 1.5T (MAGNETOM Aera, Siemens Healthcare, Erlangen, Germany) using a 20-channel head coil, without sedation. Whole-brain 3D T1 relaxometry was achieved with the MP2RAGE sequence using acquisition parameters tailored to pediatric applications (resolution=1.33x1.33x1.25mm3, FOV=256x240mm2, TI1/TI2=600/2000ms, flip angles=5°-6°, TR=5000ms, TA=6:36min).
Image processing: Automated brain segmentation was performed using the automated MorphoBox prototype which underwent a major adaptation of its atlases. Three age-appropriate T1-weighted templates were built using an iterative method, requiring N non-linear registrations [6,7] to be performed at each iteration, where N is the number of healthy subjects. Voxel-wise average across subjects was used as initial reference target volume. A total of 38 anatomical structures [3] were drawn by a neuroradiologist on each resulting template, and consensus was obtained with two other neuroradiologists. Volumes of these structures were estimated in all patient scans using the same MorphoBox pipeline as primarily designed for adults [3,5] with age-appropriate templates. Mean T1 values were calculated over each resulting segmentation mask. Normative data modeling: Reference ranges accounting for the normal evolution of brain volumes with age were established for each region (r) using a logarithmic model: $$E\left\{V(\mathbf{r})\right\}=\beta_{0}(\mathbf{r})+\beta_{1}(\mathbf{r})\ast log(age)$$A modified Gompertz growth model was used to establish reference ranges for T1 values: $$E\left\{T_1(\mathbf{r})\right\}=\beta_{0}(\mathbf{r})e^{e^{-\beta_{1}(\mathbf{r})\ast age}-\beta_{2}(\mathbf{r})\ast age}$$with β0 corresponding the transition T1 between two different growth states, β1 the growth rate during the fast development in first years of life and β2 the growth rate during the slower development. A Shapiro-Wilk test was employed in both cases to test whether fitting residuals were normally distributed (p-value less than 0.05 rejects normality after Bonferroni’s correction for multiple comparisons).
Results
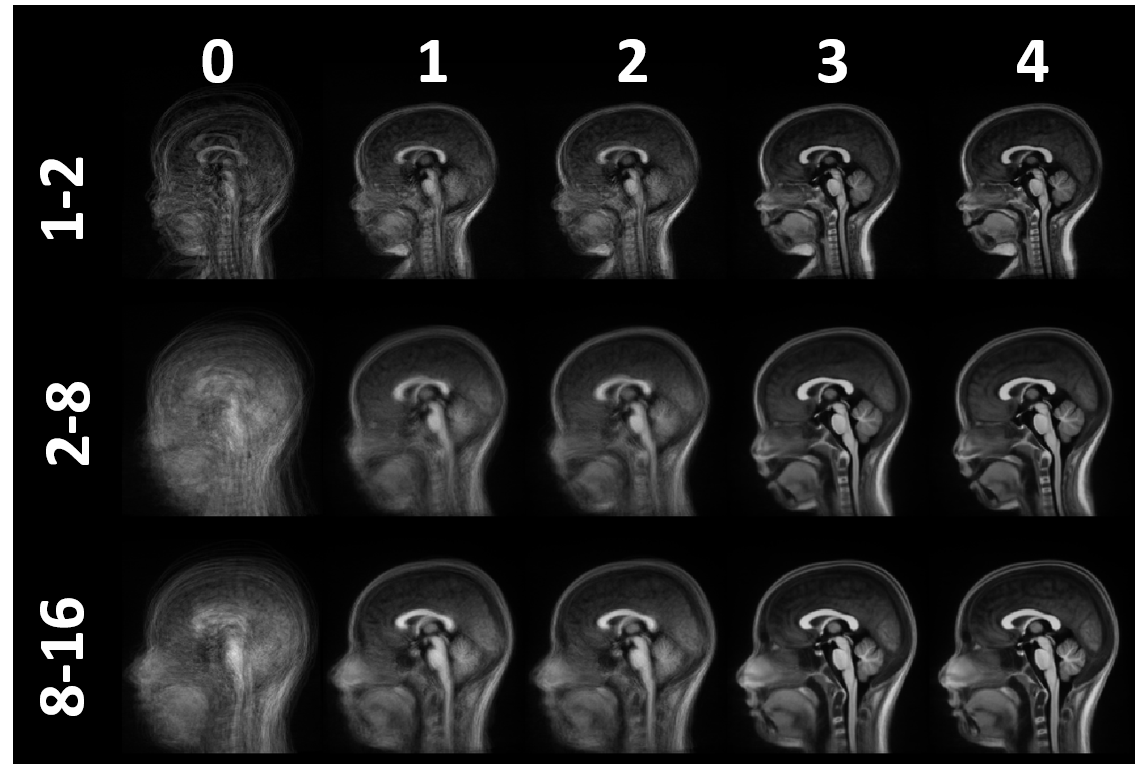
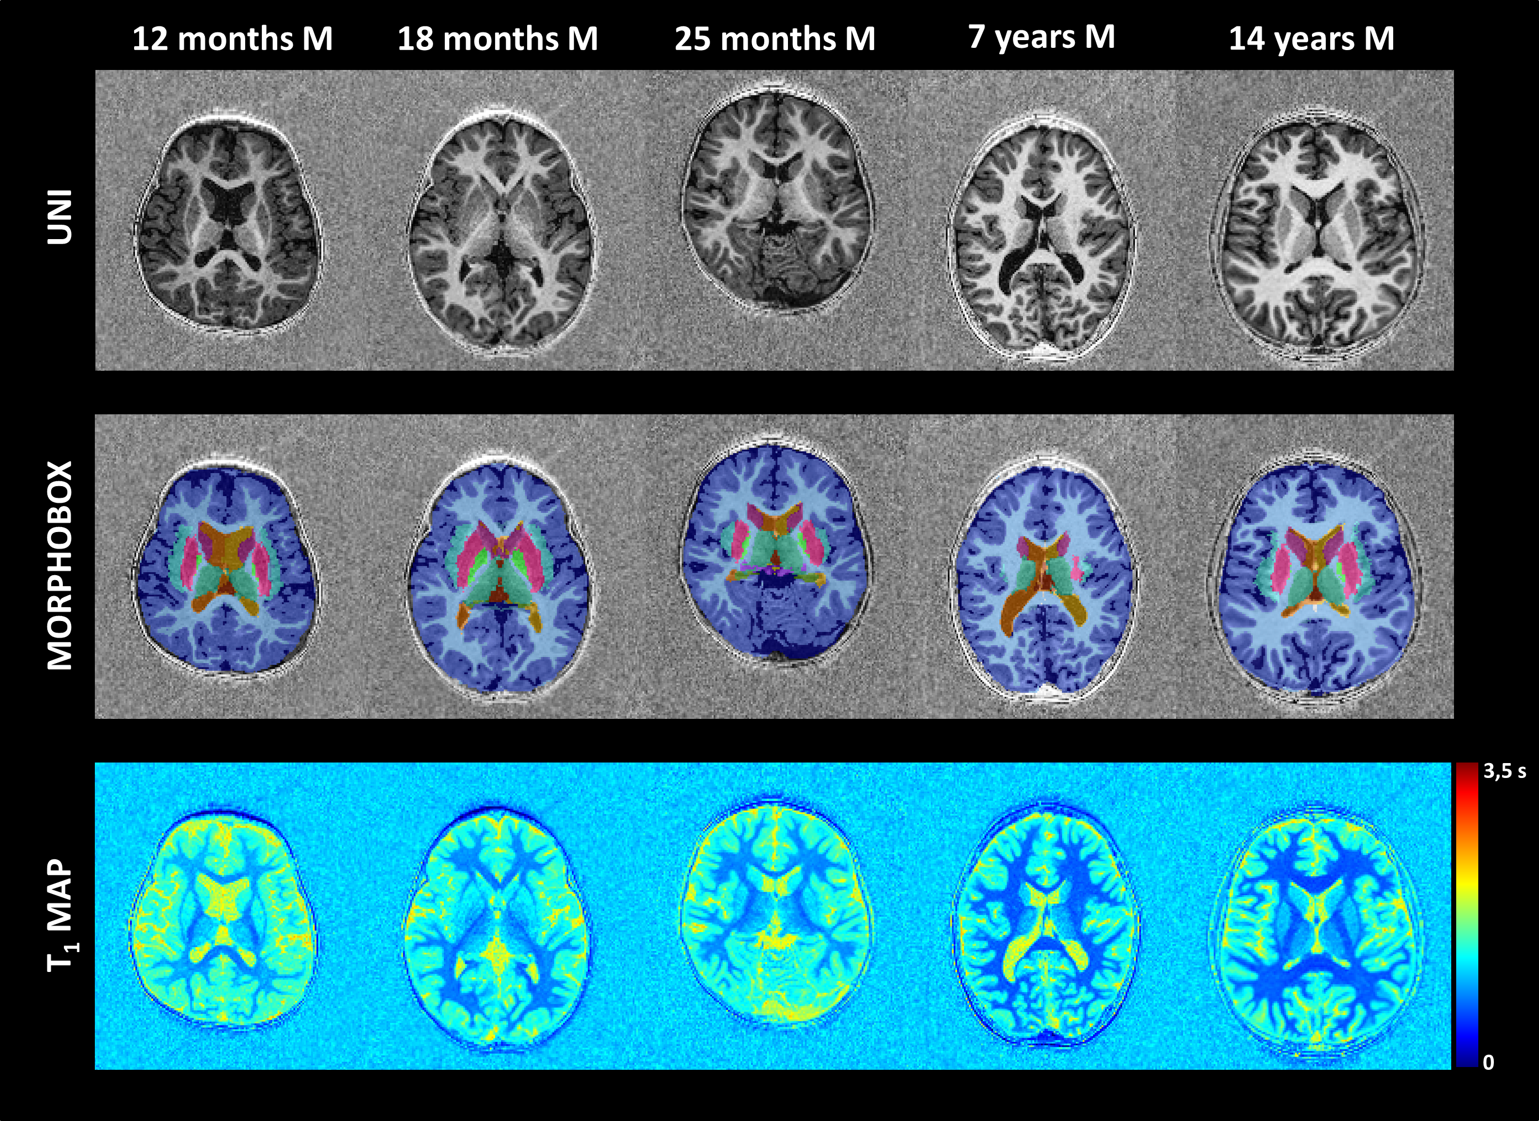
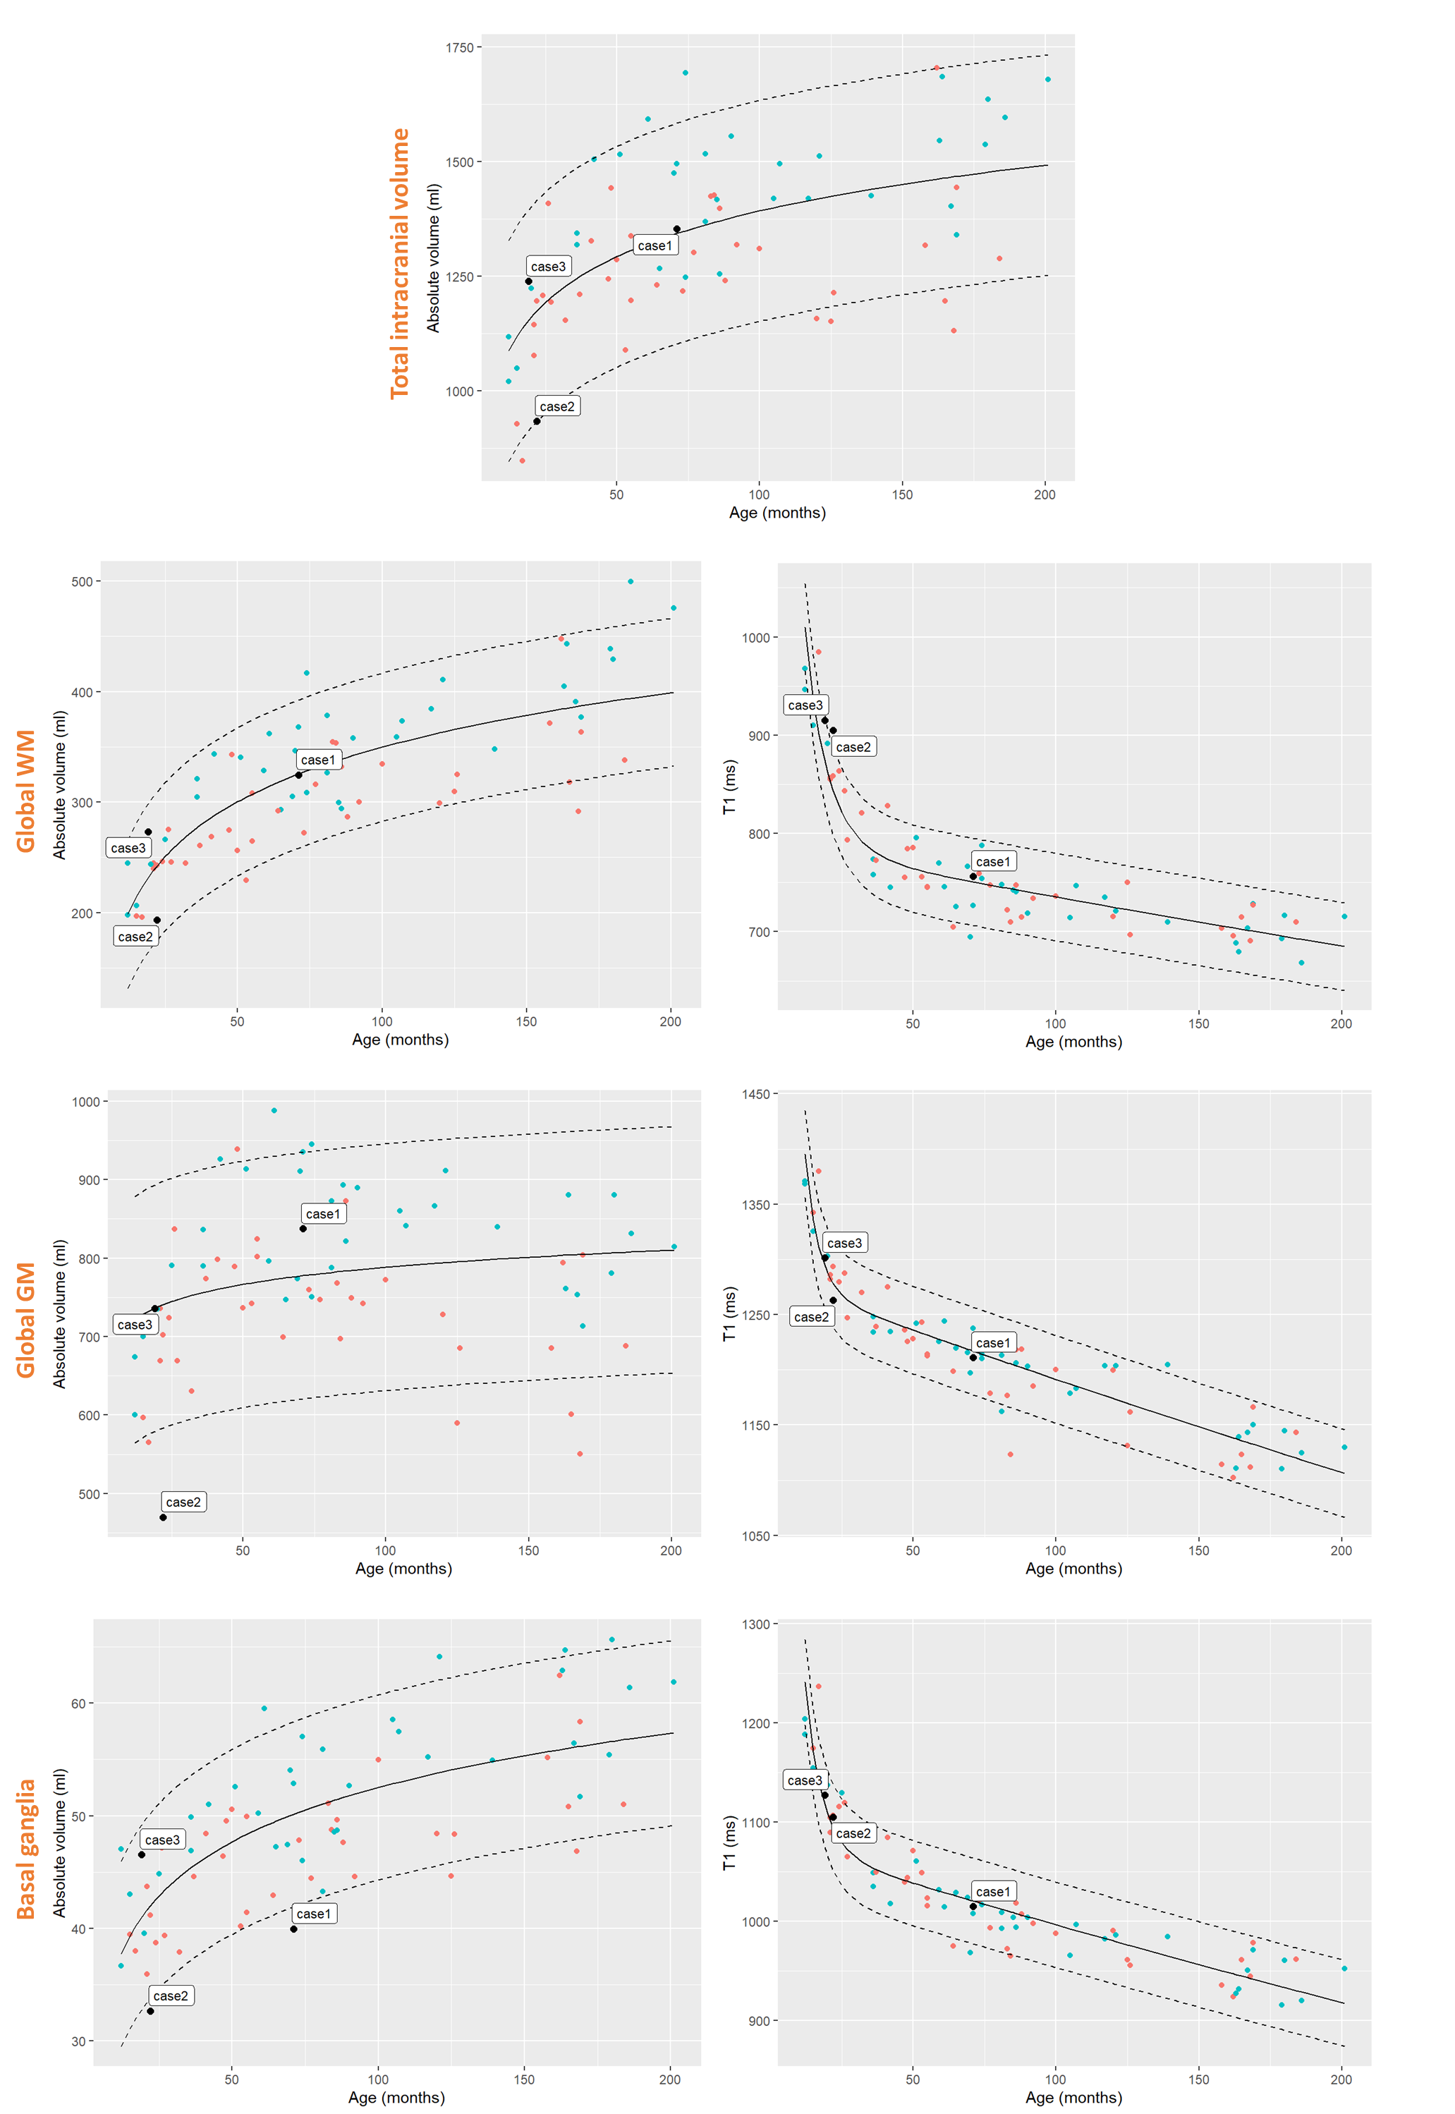
Three T1-weighted templates were generated for each age group including seven subjects aged 1-2 years, 35 subjects aged 2-8 years, and 29 subjects aged 8-16 years. High anatomical detail and contrast was reached after four iterations (see Fig.2). Using these age-appropriate templates, brain segmentation was successful in all 70 normal subjects and case series (see Fig.3+5). Normative curves for global GM and WM, basal ganglia, ventricular system and total intracranial volume are shown in Fig.4. After a rapid linear growth between 12 and 18 months, both global GM and WM volume growth rates slow down while respective mean T1 values decrease considerably as myelination progresses (see Fig.4). WM mean T1 values demonstrate rapid linear decrease during the first 18 months of age, with a gradual decrease until three years of age and further slow, but persistent decrease through childhood and adolescence. Residuals are found to be normally distributed for all regions except left ventricular volume and left hippocampus and cerebellar mean T1. Case1 demonstrates a significantly low volume of basal ganglia, without any other abnormal morphologic or T1-relaxometry values elsewhere. A reduced volume of frontal GM is objectively quantified in Case2. In Case3, we confirmed and quantified abnormally high ventricular volume, without brain parenchyma atrophy (Fig.4+5).Discussion
This work describes the optimizations performed to automatically measure brain volumes and T1-relaxometry in children. Reference curves in the 1-to-16-year age range were established and show similar trends to those generated by previous pediatric studies [6,7]. Results of the case series are promising to guide diagnosis. In Case1, it would help focusing further investigation on basal ganglia. In Case2, radiologists would screen with caution the frontal lobe to detect a focal epileptogenic lesion or would exclude a passive dilatation of the ventricular system due to a reduced brain volume in Case3. However, these normative ranges must be used with caution as they are built from a rather small sample of subjects scanned on a single 1.5T scanner with strictly identical sequence parameters. Future work should focus on investigating the sensitivity and specificity of abnormalities detection using a larger healthy and pathological dataset with broader variations in field strength and sequence parameters.Conclusion
In conclusion, this quantification of macrostructural and microstructural features based on a single MRI scan opens new prospects for objective assessments of cerebral growth.Acknowledgements
No acknowledgement found.References
1. Gale CR, O’Callaghan FJ, Godfrey KM, Law CM, Martyn CN. Critical periods of brain growth and cognitive function in children. Brain J. Neurol. 2004;127:321–329
2. Marques, J. P., Kober, T., Krueger, G., van der Zwaag, W., Van de Moortele, P. F., & Gruetter, R. MP2RAGE, a self bias-field corrected sequence for improved segmen-tation and T 1-mapping at high field. Neuroimage 2010, 49(2), 1271-1281.
3. Schmitter, D, Roche A, et al. An evaluation of volume-based morphometry for prediction of mild cognitive impairment and Alzheimer's disease. NeuroImage: Clinical 2015;7:7-17
4. Fujimoto, K, Polimeni, JR, et al. Quantitative comparison of cortical surface reconstructions from MP2RAGE and multi-echo MPRAGE data at 3 and 7T. Neuroimage 2014;90:60-73
5. Boto J, Gkinis G, Roche A, Kober T, Maréchal B, Ortiz N, Lövblad K-O, Lazeyras F, Vargas MI. Evaluating anorexia-related brain atrophy using MP2RAGE-based morphometry. European Radiology (2017);27:50-64
6. Klein S, Staring M, Murphy K, Viergever M.A. and Pluim J.P.W. elastix: a toolbox for intensity based medical image registration," IEEE Transactions on Medical Imaging 2010 ;29(1);196-205
7. Shamonin D.P., Bron E.E., Lelieveldt B.P.F., Smits M., Klein S. Staring M. Fast Parallel Image Registration on CPU and GPU for Diagnostic Classification of Alzheimer’s Disease. Frontiers in Neuroinformatics 2014;7(50): 1-15
8. Groeschel S, Vollmer B, King MD, et al. Developmental changes in cerebral grey and white matter volume from infancy to adulthood. Int J Dev Neuroscience 2010;28:481-89
9. Pfefferbaum A, Mathalon DH, Sullivan EV, et al. A quantitative magnetic resonance imaging study of changes in brain morphology from infancy to late adulthood. Arch Neurol 1994;51:874-87
Figures