4617
An Automated Processing Pipeline to Assess and Improve Data Quality for Multicentre Pediatric Dynamic Susceptibility Contrast Imaging1Physical Sciences for Health CDT, University of Birmingham, Birmingham, United Kingdom, 2Institute of Cancer and Genomic Sciences, University of Birmingham, Birmingham, United Kingdom, 3Department of Oncology, Birmingham Children's Hospital, Birmingham, United Kingdom, 4RRPPS, University Hospitals Birmingham NHS Foundation Trust, Birmingham, United Kingdom, 5School of Biological Sciences and Medical Engineering, Southeast University, Nanjing, China, 6Radiology, Birmingham Children's Hospital, Birmingham, United Kingdom, 7Radiology, Alder Hey Children's NHS Foundation Trust, Liverpool, United Kingdom, 8Oncology, Alder Hey Children's NHS Foundation Trust, Liverpool, United Kingdom, 9The Children’s Brain Tumour Research Centre, University of Nottingham, Nottingham, United Kingdom, 10Sir James Spence Institute of Child Health, Royal Victoria Infirmary, Newcastle, United Kingdom, 11Neuroradiology, The Newcastle upon Tyne Hospitals NHS Foundation Trust, Newcastle, United Kingdom, 12Sir Peter Mansfield Imaging Centre, University of Nottingham, Nottingham, United Kingdom, 13Institute of Digital Healthcare, University of Warwick, Coventry, United Kingdom
Synopsis
Obtaining robust perfusion measures from pediatric Dynamic Susceptibility Contrast (DSC-) MRI, such as cerebral blood volume (CBV), is challenging due to variability in acquisition protocols between centres and a heterogeneous patient population. Quality control (QC) is currently carried out by expert qualitative review. An automated QC pipeline was developed which used denoising to salvage data, and assessed data quality using logistic regression classification, with signal-to-noise ratio (SNR) and root mean square error (RMSE) in a gamma variate fit to the first pass as predictors. SNR was the key factor in data quality and denoising is important in assuring appropriate analysis.
Introduction
Dynamic Susceptibility Contrast (DSC-) MRI uses gadolinium-based contrast agent (GBCA) to estimate perfusion parameters, such as cerebral blood volume (CBV), cerebral blood flow (CBF) and vascular mean transit time (MTT). Perfusion parameters are estimated from GBCA induced changes in signal intensity in the time course (TC) associated with each voxel1. Obtaining accurate perfusion parameters in multicentre pediatric data is challenging due to a heterogeneous patient population, differing acquisition protocols between centres and artefacts such as noise, motion and susceptibility. Recent work recommended single-bolus injection protocols3, whilst previous work recommended split-bolus protocols2. Therefore, GBCA injection protocols vary between centres. Currently, quality control (QC) of DSC data is conducted by expert qualitative review (QR). This work focuses on developing an automated pipeline, to assess multicentre pediatric patient data. It uses machine learning for QC and Tucker Decomposition (TD) to reduce noise and salvage data.Methods
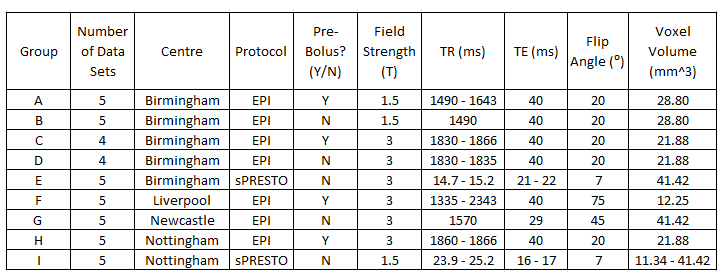
Data AcquisitionA multicentre pediatric dataset (of 43 patients) was acquired from the CCLG functional imaging of tumours database, an online database containing multicentre pediatric MRI data acquired with differing protocols4. Table 1 summarises acquisition protocols and centres.
Image Post-Processing
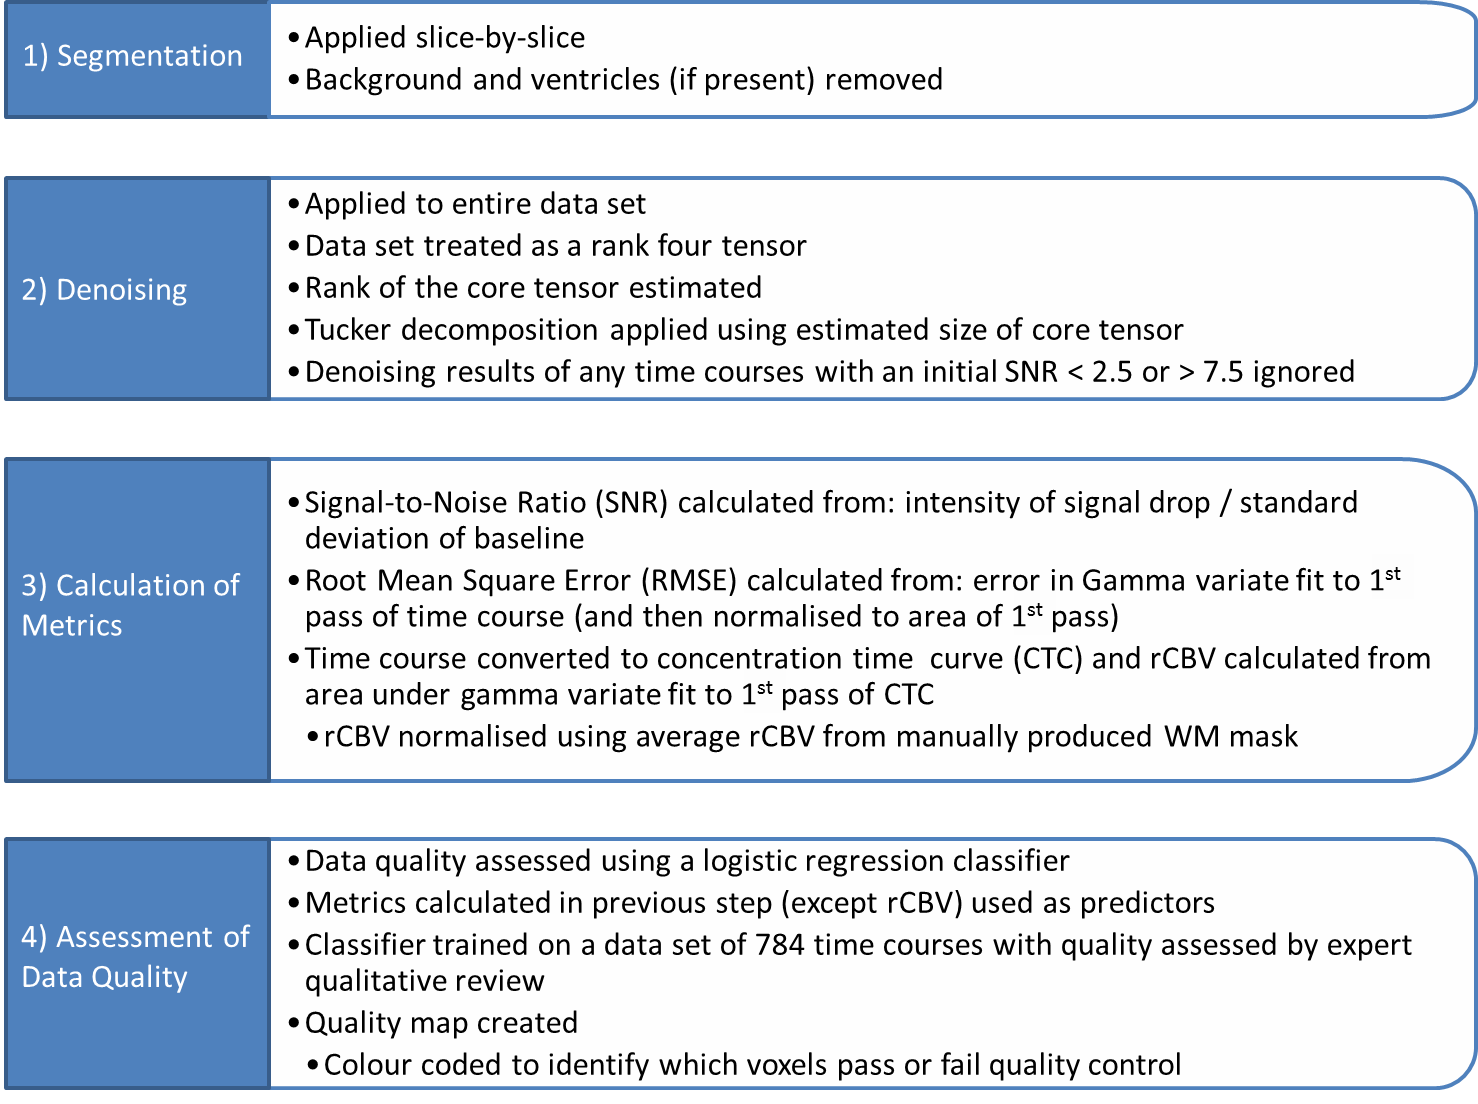
A pipeline was developed in Matlab (The Mathworks, MA, 2018A), summarised in fig. 1. For each patient, four consecutive slices were chosen to avoid tumour and allow testing of ‘healthy’ brain. Segmentation removed background and ventricles. Signal-to-Noise Ratio (SNR) values were calculated (fig.1 (3)) and TCs with 2.5 ≤ SNR ≤ 7.5 were denoised using TD, preventing denoising of TCs too corrupted by noise or already good quality. SNR, RMSE, and rCBV were calculated for all TCs (fig.1 (3)).
Machine Learning
QC used a logistic regression (LR) classifier, from Matlab, with SNR and RMSE as predictors. It was trained on 784 TCs and tested on 216 TCs (assessed by QR by two physicists).
Statistics
Statistical testing analysed differences caused by protocol and denoising. ANOVA and Tukey testing investigated SNR using SPSS (IBM, NY, 25.0), whilst χ2 testing investigated the number of TCs passing QC using Matlab.
Results
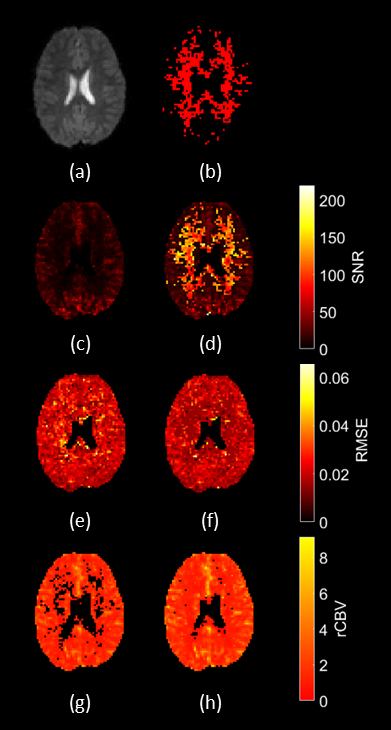
Image Post-ProcessingFig. 2 shows maps produced by the QC pipeline, pre- and post-denoising, and the mask of voxels which were denoised.
Machine Learning QC
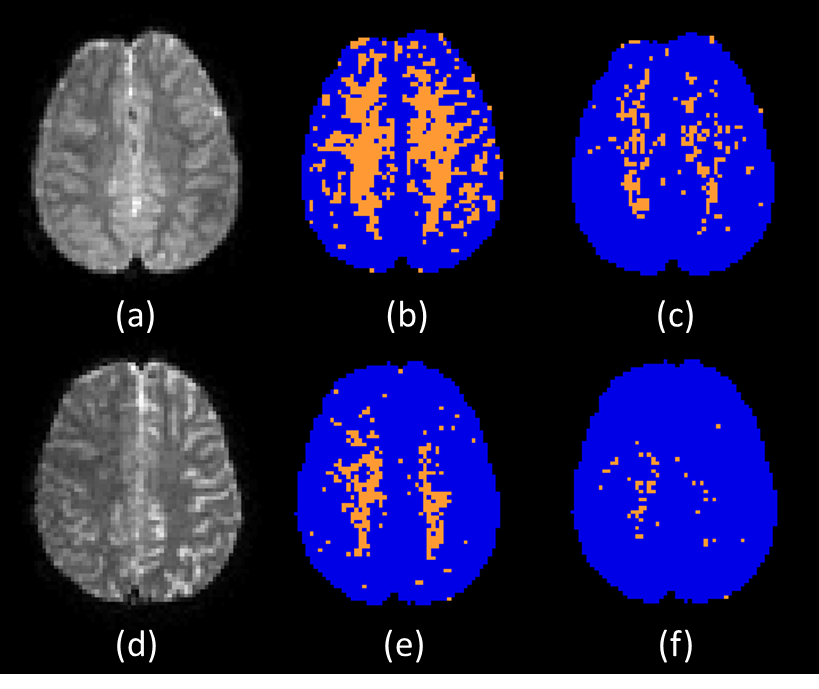
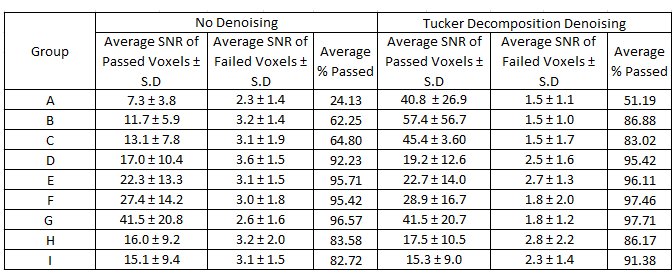
Fig. 3 shows data quality maps, pre- and post-denoising, for two patients. Table 2 summarises QC results pre- and post-denoising, with average SNR values split by QC pass/fail, grouped as in table 1. The LR classifier gave sensitivity, specificity, precision and classification error of 0.94, 0.88, 0.94 and 7.9% respectively.
Statistics
ANOVA showed improved SNR (P < 0.001) in TCs passing QC in each patient post-denoising, except groups G and I, P = 0.875 and 0.082 respectively (table 2). ANOVA and Tukey testing showed differences in SNR of TCs passing QC between groups pre- and post-denoising, P < 0.001 (table 2). χ2 testing showed differences in QC performance between groups pre- and post-denoising (P < 0.001), and improved QC performance post-denoising in 72% of patients (P < 0.001). The remaining 28% all had ≥89% of TCs passing QC pre-denoising.
Discussion
From fig. 2, SNR and normalised rCBV pre-denoising are increased in grey matter (GM) compared to white matter (WM), as GM is more perfused than WM, so less susceptible to noise5. This is seen in fig 2(b), where denoised regions are mostly WM, in figs. 2(d) and (f), where improvement in SNR and RMSE is WM, and in figs. 2(g) and (h), where salvaged rCBV values are mostly WM. Quality maps in fig. 3 show that most of the improvement in data quality post-denoising is WM.From table 2 the worst quality group is A, whilst the best quality is G, giving the largest % of voxels passing QC (P < 0.001), and better SNR (P < 0.001), showing that 1.5T acquisition with pre-bolus should be avoided. Comparing groups where the difference in acquisition protocol is the pre-bolus (A vs. B and C vs. D) there is improved data quality (P < 0.001) and SNR (P < 0.001) in patients without pre-bolus. This shows that single-bolus protocols should be preferred and agrees with work by Schmainda et al. where a single-bolus protocol was recommended3. Comparing EPI and sPRESTO from the same centre (D vs. E and H vs. I respectively) sPRESTO gives better QC performance (P < 0.001) and SNR (P < 0.001), as seen in table 2. However, sPRESTO has reduced spatial resolution, contrast and temporal resolution6, which must be considered during protocol selection.
LR classification gives automated QC, with good sensitivity, precision, specificity and classification error. Precision was the weakest measure, showing that it is better at predicting good quality time courses.
Conclusion
Multicentre DSC data are commonly acquired with differing protocols and this is a particular challenge in a heterogeneous pediatric population. This leads to variable data quality and is a barrier to effective analysis. Here we’ve demonstrated an automated QC pipeline for DSC-MRI, using denoising to salvage data. In particular SNR is a key factor in driving data quality, and denoising is an essential element of assuring appropriate data analysis.Future work will focus on deploying the pipeline in large scale clinical trials in children, thereby improving the translation of perfusion biomarkers into clinical practice.
Acknowledgements
This work was funded by EPSRC through a studentship from the Sci-Phy-4-Health CDT (EP/L016346/1) and the National Institute for Health Research (NIHR) via a research professorship (13-0053), and Help Harry Help Others (HHHO), Cancer Research UK, The Experimental Cancer Medicine Centre Paediatric Network, and the Little Princess Trust.References
1. Shiroishi M.S., et al. Principles of T2*‐weighted dynamic susceptibility contrast MRI technique in brain tumor imaging. Journal of Magnetic Resonance Imaging. 2015;41(2): 296-313.
2. Welker K., et al. ASFNR Recommendations for Clinical Performance of MR Dynamic Susceptibility Perfusion Imaging of the Brain. American Journal of Neuroradiology. 2016;36(6): 41-51.
3. Schaminda K.M. et al. Moving Toward a Consensus DSC-MRI Protocol: Validation of a Low-Flip Angle Single-Dose Option as a Reference Standard for Brain Tumors. American Journal of Neuroradiology. 2019;40(4): 626-633.
4. Arvanitis T.N. et al. The Children’s Cancer and Leukaemia Group (CCLG) Functional Imaging e-Repository for Clinical Trials of Childhood Brain Tumours. Neuro-Oncology. 2010;12(6): ii118.
5. Artzi M. et al. Human cerebral blood volume measurements using dynamic contrast enhancement in comparison to dynamic susceptibility contrast MRI. Neuroradiology. 2015;57(7): 671-678. 6. van Gelderen P, et al. The PRESTO technique for fMRI. NeuroImage. 2012;62(2): 676-681.
Figures