4615
Mathematical Modeling of White Matter Development in Infant Rhesus Monkeys1Department of Medical Physics, University of Wisconsin-Madison, Madison, WI, United States, 2Department of Psychiatry, University of Wisconsin-Madison, Madison, WI, United States, 3Department of Pediatrics, University of Wisconsin-Madison, Madison, WI, United States, 4Waisman Center, University of Wisconsin-Madison, Madison, WI, United States
Synopsis
In this study, we use prototypical DTI metrics to assess longitudinal changes in white matter (WM) across the postnatal rhesus macaque brain, over the first year of life.
DTI trajectories extracted from 37 ROIs conform to a logarithmic model and illustrate an initial 10-week period of exceedingly rapid WM development, followed by a prominent plateau in alterations at approximately 6 months of age. K-means clustering of model parameters suggests distinct regional differences in WM maturation. Our analysis provides an early quantitative framework for attaining insights into healthy postnatal WM development, and eventually, establishing connections between WM deterioration and human psychopathology.
Purpose
White matter (WM) consists of myelinated axons that transfer information across the brain via electrical signal transmission and plays a crucial role in healthy brain development and function. The deterioration of WM has been implicated in a myriad of human psychiatric disorders, including schizophrenia,1 bipolar disorder,2 and anxiety,3 leading to a recent emphasis on the role of WM development during early childhood in the manifestation of these disorders.4,5,6Rhesus macaque models, given their physiological and behavioral similarities to humans and evolutionarily related development, provide a convenient platform for exploring mechanistic hypotheses of human brain function and development.7 Additionally, while there have been numerous investigations of WM progression in macaques beginning at ~1 yr old, to the best of our knowledge, none have offered an in-depth, region-specific, quantitative characterization of WM development in the weeks immediately following birth. This constitutes a critical time in which WM alterations may be potentially affected by a plethora of genetic, developmental, and environmental factors.
In order to quantitatively characterize the earliest stages of postnatal WM growth in rhesus monkeys, we analyzed the progression of region-specific DTI metrics (known to be particularly sensitive to minute changes in WM microstructure) in a longitudinal study of rhesus macaques, imaged 5 times throughout the first year of life.
Methods
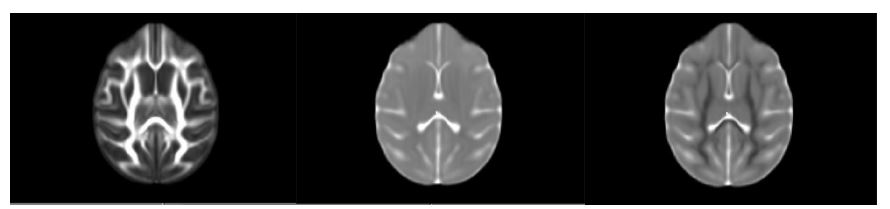
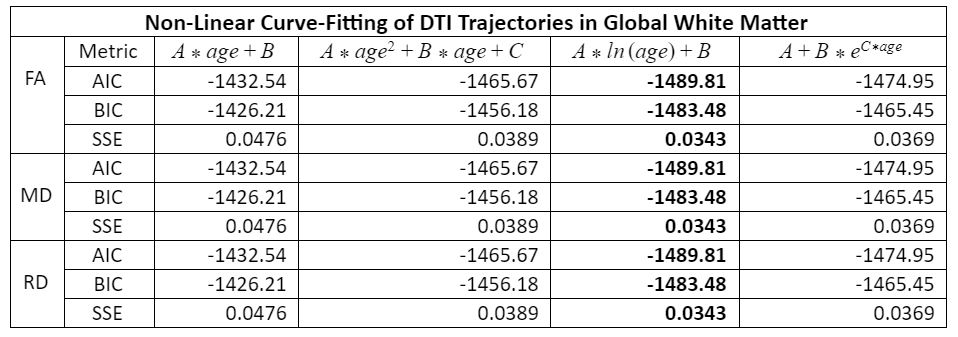
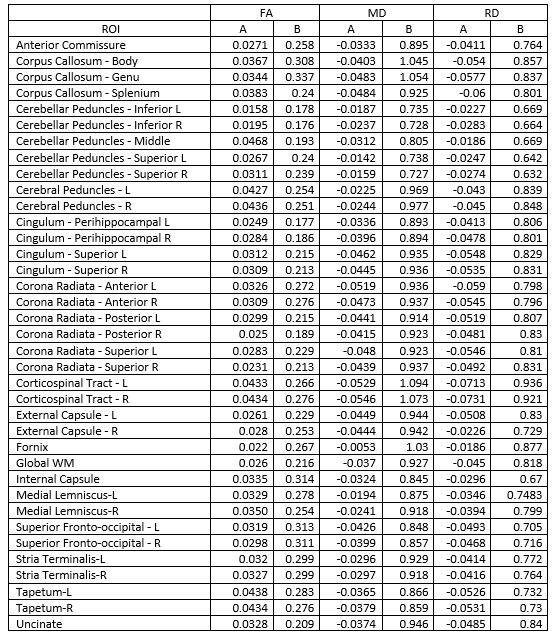
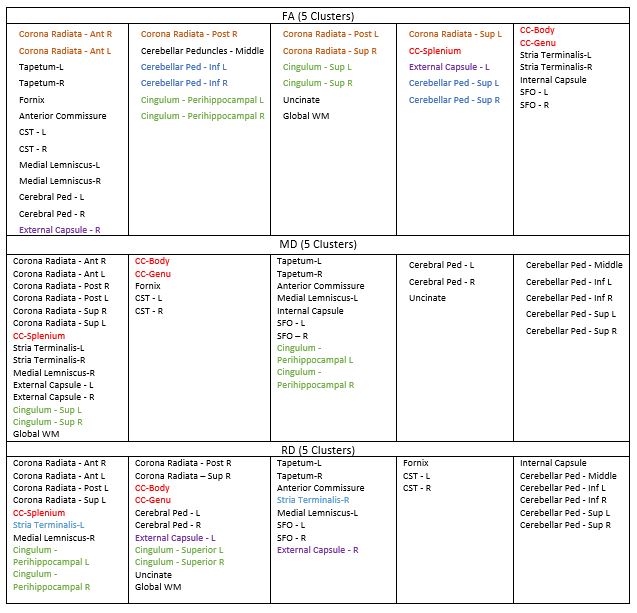
Thirty-five rhesus macaques (11 males, 24 females) were imaged with T1-weighted MRI (MPnRAGE)8 and single-shell (b=1,000 s/mm2) DTI in a 3T scanner, at 3, 7, 13, 25, and 53 weeks of age (one monkey only had four MPnRAGE scans, resulting in 174 total structural scans across all subjects). The structural MPnRAGE images for each subject and timepoint were co-registered with non-linear, diffeomorphic registration using Advanced Normalization Tools (ANTs) to produce a time-averaged population template. After correcting for noise, Gibbs ringing, susceptibility-induced distortions, and eddy currents, diffusion tensors were estimated with RESTORE.9 Prototypical DTI parameter maps (FA, MD, RD) were calculated in native space and subsequently warped to our population template (Figure 1). A publicly available WM ROI atlas of young rhesus macaques10 was also warped to our population template, visually assessed for alignment, and 37 total WM ROIs were selected for analysis. For each subject and timepoint, average values of FA, MD, and RD were extracted from all 37 ROIs and used to construct longitudinal trajectories.Non-linear regression (via SSE minimization) was implemented to fit these trajectories to a range of potential models. Information criterion parameters (AIC and BIC) were calculated to evaluate the goodness of fit for each proposed model. These trajectories conformed best to a logarithmic growth model (Table 1): FA (or MD or RD) = A*ln(age)+B. In this model, the parameter A represents the rate of change of FA (or MD or RD) at 1 week of age and the parameter B represents the magnitude of FA (or MD or RD) at 1 week. These parameters were tabulated for each ROI (Table 2) and subsequently clustered utilizing k-means clustering (Lloyd’s algorithm)11 in MATLAB with five clusters (Table 3). Growth rate curves were derived by taking the first derivatives (with respect to time) of the logarithmic models corresponding to each ROI (Figure 2).
Results
K-means clustering of the parameters from our logarithmic growth model (A and B) demonstrated regional differences in brain maturation (Table 3). Specifically, there are consistent differences in DTI measures noted between anterior and posterior ROIs (e.g. genu vs. splenium of the corpus callosum) as well as superior and inferior ROIs (e.g. superior vs. peri-hippocampal cingulum). Furthermore, we find delineations in FA and RD trajectories between the left and right external capsule. Growth rate curves (first derivatives) of our logarithmic trajectories (Figure 2) suggest that: 1) WM develops extremely rapidly over the first 10 weeks of life across the entire brain (magnitudes of the rates of change of DTI trajectories for almost all ROIs drop to less than 10% of their initial values by 10 weeks old) and 2) WM maturation begins to plateau at approximately 25 weeks (~ 6 months).Discussion
Our findings serve as an incipient quantitative analysis of early postnatal WM development in rhesus macaques, which holds significant potential to contribute to a more comprehensive understanding of healthy postnatal WM development as well as reveal early neural correlates of human psychopathology. Ultimately, we were able to: 1) categorize growth trajectories of characteristic DTI parameters as logarithmic, 2) establish significant differences in early WM trajectories between distinct brain regions from clustering algorithms (possibly indicating disparities in the rates of myelination and formation of axonal coherence between inferior/superior, anterior/posterior, and left/right regions), and 3) document an initial 10 week period of particularly rapid WM development (followed by a pronounced plateau at approximately 25 weeks of age) in rhesus macaques. Future work will focus on comparing our trajectories to those derived from approximately age-equivalent human data, assessing correlations in DTI measures across brain regions and time, and incorporating behavioral metrics recorded from the very same monkey cohort, as they relate to the neurodevelopmental origins of psychopathology.Acknowledgements
No acknowledgement found.References
1. Kubicki M, McCarley R, Westin CF, Park HJ, Maier S, Kikinis R, Jolesz FA, Shenton ME. (2007). A review of diffusion tensor imaging studies in schizophrenia. J Psychiatr Res. 41:15–30.
2. Heng S, Song AW, Sim K. (2010). White matter abnormalities in bipolar disorder: insights from diffusion tensor imaging studies. J Neural Transm. 117:639–654.
3. Kim MJ, Whalen PJ. (2009). The structural integrity of an amygdalaprefrontal pathway predicts trait anxiety. J Neurosci. 29:11614 –11618.
4. Als, H., Duffy, F., McAnulty, G., Rivkin, M., Vajapeyam, S., Mulkern, R., Warfield, S., Huppi, P., Butler, S., Conneman, N., Fischer, C., Eichenwald, E. (2004). Early experience alters brain function and structure. Pediatrics. 113 (4), 846–857.
5. Ment, L., Hirtz, D., Huppi, P. (2009). Imaging biomarkers of outcome in the developing preterm brain. Lancet Neurol. 8 (11), 1042–1055.
6. Wolff, J., Gu, H., Gerig, G., Elison, J., Styner, M., Gouttard, S., Botteron, K., Dager, S., Dawson, G., Estes, A., Evans, A., Hazlett, H., Kostopoulos, P.,McKinstry, R.C., Paterson, S., Schultz, R., Zwaigenbaum, L., Piven, J. (2012). Differences in white matter fiber tract development present from 6 to 24 months in infants with autism. Am. J. Psychiatry. 169(6):589-600.
7. Zhang, Y.P., Shi, L.M. (1993). Phylogeny of rhesus monkeys (Macaca mulatta) as revealed by mitochondrial DNA restriction enzyme analysis. Int. J. Primatol. 14 (4), 587–605.
8. Kecskemeti, S., Samsonov, A., Hurley, S. A., Dean, D. C., Field, A., & Alexander, A. L. (2015). MPnRAGE: A technique to simultaneously acquire hundreds of differently contrasted MPRAGE images with applications to quantitative T1 mapping. MRM. 75(3), 1040-53.
9. Chang, L-C, Jones, DK and Pierpaoli, C. (2005). RESTORE: robust estimation of tensors by outlier rejection. MRM. 53: 1088-95.
10. Zakszewski E, Adluru N, Tromp DPM, Kalin N, Alexander AL. (2014). A Diffusion-Tensor-Based White Matter Atlas for Rhesus Macaques. PLoS ONE. 9(9): e107398. doi:10.1371/journal.pone.0107398
11. Lloyd, SP. (1982). Least Squares Quantization in PCM. IEEE Transactions on Information Theory. 28:129-137.
Figures