4609
Comparison of advanced and simplified computational fluid dynamics simulations in the Glenn and Fontan circulations – an MRI validation study1Department of Clinical Sciences Lund, Clinical Physiology, Skåne University Hospital, Lund University, Lund, Sweden, 2Department of Clinical Sciences Lund, Pediatric Heart Center, Skåne University Hospital, Lund University, Lund, Sweden
Synopsis
Computational fluid dynamics (CFD) modelling may help patients with heart defects by predicting blood flow after interventions thus aiding surgical planning. Current CFD-techniques are not clinically feasible due to long computational times. We compared a simplified CFD technique to the state-of-the-art advanced CFD and validated the results with Magnetic Resonance Imaging. We could show that the simplified CFD method on a conventional laptop saved between 75%-99% computing time compared with advanced CFD on a dedicated computation server with comparable accuracy in results of flow distributions. This simplified CFD method may facilitate the implementation of CFD predictions in a clinical setting.
Introduction
Congenital heart disease (CHD) is the leading cause of mortality from birth defects [1]. The reported prevalence of CHD in the general population varies between 4 and 10 per 1000 live births [2]. Patients with complex CHD may need to be surgically transformed to a Fontan circulation with one ventricle pumping blood to the body and the returning venous blood directly connected to the pulmonary arteries. However, complications are frequent and life expectancy decreased. Computational Fluid Dynamics (CFD) can be used for patient-specific hemodynamic predictions in patients with univentricular hearts after Glenn (stage II) or Fontan (stage III) palliation and may improve the surgical results, but the required resources may be prohibitive for routine clinical use [3]. Therefore, our purpose is to reduce the complexity in this process so that more centers can adopt this method in clinical routine. The aim of the current study is therefore to compare a simplified CFD solver on a basic laptop with an advanced CFD solver on a powerful computation server, in terms of pulmonary flow distribution to the left pulmonary artery (%PFD), hepatic flow distribution to the left pulmonary artery (%HFD) and total computation time and validate the results with MRI.Methods
MRI flow measurements from 13 patients (median age 6.7 years, range 3 to 17 years) with Glenn (n=4) and Fontan (n=9) circulation were performed on a 1.5T Philips Achieva scanner (Philips Healthcare, Best, The Netherlands) (n=8) or on a 1.5T Siemens Aera (Siemens Healthcare, Erlangen, Germany) (n=4). Segmentation and modelling were performed using Segment (Medviso AB, Lund, SE) and Creo Parametric (PTC, Boston, MA, USA). MRI parameters were as follows: Two-dimensional phase contrast MRI (2D PC-MRI) flow measurements were acquired using a phase velocity encoded fast field echo sequence (TR/TE/flip angle: 5-10 ms/3-7 ms/15-20° acquired in-plane resolution 2 mm x 2 mm). Flow measurements of the superior and inferior vena cava, and the pulmonary veins were typically velocity encoded at 80 cm/s and for the aorta at 200 cm/s. All image analysis was done using the freely available software Segment (http://segment.heiberg.se). CFD simulations were carried out using FloEFD for Creo (Mentor Graphics, Portland, OR, USA) and Star-CCM+ (v2019.1, Siemens PLM Software, Plano, TX, USA) as the simplified and advanced solver, respectively. For the simplified CFD simulations, hexagonal immersed boundary meshes of approximately 150.000 elements were constructed by FloEFD. For the advanced CFD simulations, tetrahedral meshes of approximately 1.2×10⁶ elements size were constructed by ICEM CFD v19.2 (Ansys Inc., Canonsburg, PA). A systematic grid convergence study was performed to estimate the error in numerical simulation. More details on meshing are provided elsewhere [4]. Blood was modeled as an incompressible Newtonian fluid (ρ = 1050 kg/m3, μ = 0.004 kg/mˑs) and patient-specific flow rates from MRI were applied at each inlet. Pulmonary vascular resistance was calculated as according to a previous study [5]. For the pulsatile simulations, results were obtained from the 3rd cycle to avoid transient effects and the convergence criteria were set to residual errors <10−5. The simplified CFD simulations were performed on a Dell XPS 15 laptop with a 4-core Intel i7 processor and 16GB RAM. Advanced steady CFD was performed on an HP Z240 Workstation with 4-core Intel(R) Xeon(R) CPU E3-1230v5 @ 3.40GHz and 32GB RAM, and pulsatile CFD on 32 cores of a Dual 18-core Intel(R) Xeon(R) Gold 6154 CPU running @ 3GHz x 72 and 376.6 GiB RAM. Quantification of hemodynamic metrics were computed as follows:1. Flow distribution to the left pulmonary artery (%PFD)
%PFDLPA = (QLPA / (QLPA + QRPA)) ·100%
2.Hepatic Flow Distribution to the left pulmonary artery (%HFD)
%HFDLPA = (Q IVC to LPA / QIVC) · 100%
The methods were compared using bias according to Bland-Altman (mean difference±SD) and linear correlation analysis. Statistical significance was assumed for p<0.05.
Results
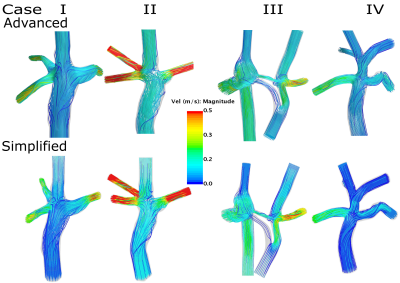
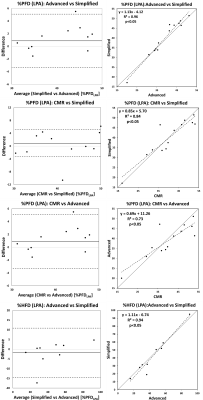
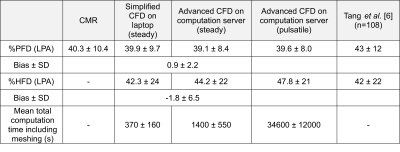
Figure 1 illustrates the streamlines color coded with velocity magnitude, for four representative cases calculated by an advanced and a simplified solver. There was a strong correlation (Figure 2 Right) between the two methods in terms of %PFD, R2=0.96) and %HFD (R2=0.94), respectively and the bias were low (0.9±2.2 % and -1.8±6.5 % respectively, (Figure 2 Left). Table 1 presents the hemodynamic comparison of %PFD between simplified and advanced CFD and the validated results with MRI and from a previously published study [6]. Furthermore, the table includes the %HFD and the total computation time. The simplified CFD on a laptop took between 1-25% of the computing time of the advanced CFD on a computation server.Discussion
Simplified and advanced CFD modelling yielded similar results. This may help more centers deploy CFD for hemodynamic assessment of Glenn and Fontan patients in clinical practice and enable results from CFD to be presented to surgeons the same day as MRI.Conclusion
We have shown that using a simplified CFD program on a conventional laptop can save between 75%-99% computing time compared with advanced CFD on a computation server with comparable accuracy in results, with patient-specific MRI measurements as reference.Acknowledgements
The work was supported by Swedish Research Council, Marianne and Marcus Wallenberg foundation, Swedish Heart and Lung foundation.References
[1] Triedman JK, Newburger JW (2016) Trends in Congenital Heart Disease. Circulation. https://doi.org/10.1161/CIRCULATIONAHA.116.023544
[2] Marelli AJ, Mackie AS, Ionescu-Ittu R, et al (2007) Congenital Heart Disease in the General Population. Circulation 115:163–172. https://doi.org/10.1161/circulationaha.106.627224
[3] Trusty PM, Slesnick TC, Wei ZA, et al (2018) Fontan surgical planning: Previous accomplishments, current challenges, and future directions. J. Cardiovasc. Transl. Res.
[4] Aristokleous N, Seimenis I, Georgiou GC, et al (2014) Impact of head rotation on the individualized common carotid flow and carotid bifurcation hemodynamics. IEEE J Biomed Heal Informatics 18:. https://doi.org/10.1109/JBHI.2014.2305575
[5] Frieberg P, Sjöberg P, Revstedt J, et al (2018) Simulation of aortopulmonary collateral flow in Fontan patients for use in prediction of interventional outcomes. Clin Physiol Funct Imaging 38:622–629. https://doi.org/10.1111/cpf.12457
[6] Tang E, Restrepo M, Haggerty CM, et al (2014) Geometric characterization of patient-specific total cavopulmonary connections and its relationship to hemodynamics. JACC Cardiovasc. Imaging
Figures


