4607
Brain oxygen extraction fraction is associated with 10minute Apgar score and severity of hypoxic ischemic encephalopathy1Department of Radiology, Johns Hopkins University School of Medicine, Baltimore, MD, United States, 2Department of Pediatrics, Johns Hopkins School of Medicine, Baltimore, MD, United States, 3Siemens Healthineers, Baltimore, MD, United States
Synopsis
Hypoxic-ischemic-encephalopathy (HIE) is a leading cause of neonatal mortality and severe neurological impairment in childhood. Quantification of cerebral oxygen utilization in HIE neonates may provide valuable information to guide the treatment and predict clinical outcomes. Oxygen-extraction-fraction (OEF) is an important index of the brain’s oxygen utilization. In this work, we used a rapid, non-invasive MRI technique to measure the global OEF in HIE neonates, and examined the association of OEF with Apgar scores and the severity of HIE. We demonstrated that global OEF was associated with 10minute Apgar score. Global OEF also decreased with the severity of HIE.
INTRODUCTION
Hypoxic-ischemic-encephalopathy (HIE), caused in part by oxygen deprivation due to birth asphyxia, is a leading cause of neonatal mortality and severe neurological impairment in childhood, and affects 1-8 newborns per 1000 live births.1 Quantification of cerebral oxygen utilization in neonates with HIE may provide valuable information to guide the treatment and predict clinical outcomes. Oxygen-extraction-fraction (OEF) is an important index of the brain’s oxygen utilization. Previous studies have shown that OEF is reduced in HIE neonates compared to healthy controls,2 and neonates with severe HIE have even lower OEF than those with moderate HIE.3 However, it is unclear whether OEF correlates with clinical indices that can predict the outcome of HIE patients. Apgar score4 is the standard assessment of the clinical status of newborns immediately after delivery. In HIE neonates, low 10min Apgar score is associated with high rate of death or disability at 18-22 months of age.5 In this work, we used a rapid, non-invasive MRI technique to measure the global OEF in HIE neonates, and examined the association of OEF with Apgar scores and the severity of HIE. We also examined whether global cerebral-blood-flow (CBF) and cerebral-metabolic-rate-of-oxygen (CMRO2) were related to these clinical assessments.METHODS
ParticipantsWe studied fifteen HIE neonates (9M/6F, birth-age=39.1±1.9 gestational weeks, postnatal-age=0.9±0.2weeks) who had MRI because of clinical implications of hypoxic brain injury. Apgar scores of each neonate at 1min, 5min and 10min after birth were obtained from the medical record. Severity of HIE was categorized by each neonate’s Sarnat score noted by clinicians after delivery.6
MRI Experiment
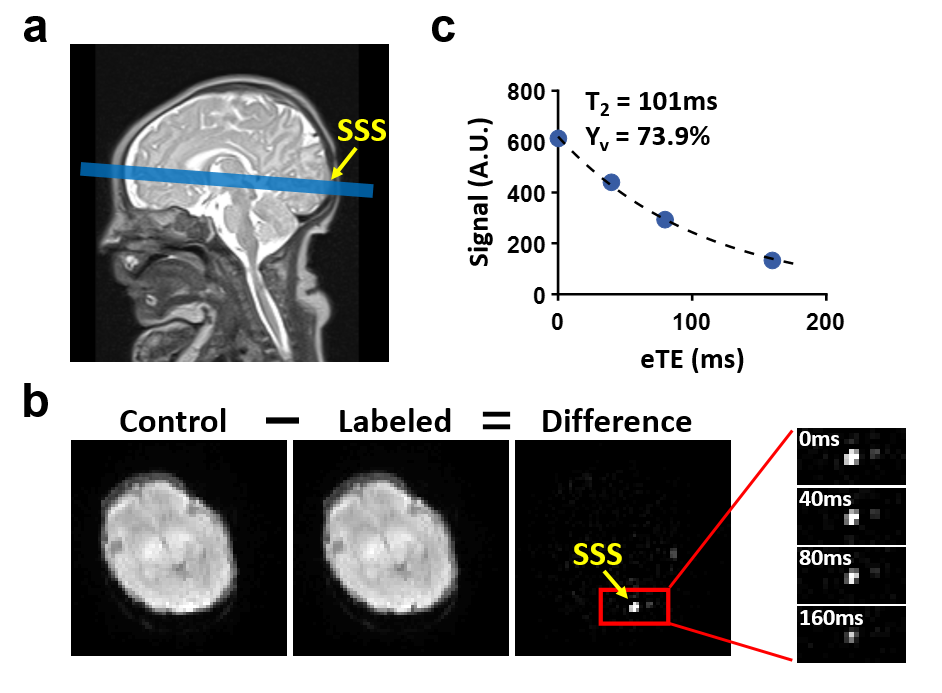
All neonates were scanned on a 3T Siemens system after rewarming from therapeutic hypothermia. The global OEF of each neonate was measured using a non-invasive T2-relaxation-under-spin-tagging (TRUST) MRI technique7 with the following parameters: FOV=160×160mm2; voxel size=2.5×2.5×5mm3; TR=3s; TI=1.02s and scan time=1.2min. During the TRUST scan, arterial oxygenation level (Ya) of each neonate was measured using an MRI-compatible pulse oximeter. In a subset of 11 neonates, global CBF was quantified by using phase-contrast MRI to measure the total blood flux of the feeding arteries to the brain, normalized by the brain volume estimated from T2-weighed anatomical images.7,8 Acquisition parameters of phase-contrast MRI included: FOV=90×90mm2, voxel size=0.5×0.5×3.2mm3, velocity-encoding=10-30cm/s.
Data Processing
The processing of TRUST and phase-contrast data followed previous literature,7,8 resulting in the global cerebral venous oxygenation (Yv) and CBF. Then, the global OEF and CMRO2 were calculated as:
$$OEF=\frac{Y_a-Y_v}{Y_a}\times100\%$$
$$CMRO_2=(Y_a-Y_v)\times CBF\times C_h$$
where Ch=8.97μmol O2/ml for a hematocrit of 0.44.7
Statistical Analysis
Linear regression analyses were performed to examine the dependence of cerebral metabolic parameters (OEF, CBF, CMRO2) on the Apgar scores (1min, 5min and 10min) and Sarnat score (1=mild, 1.5=mild-to-moderate, 2=moderate, 3=severe), respectively. Birth-age, postnatal-age and sex were used as covariates. Multiple-comparison correction was conducted for regression using Apgar scores by multiplying the P-values by 3.
RESULTS AND DISCUSSION
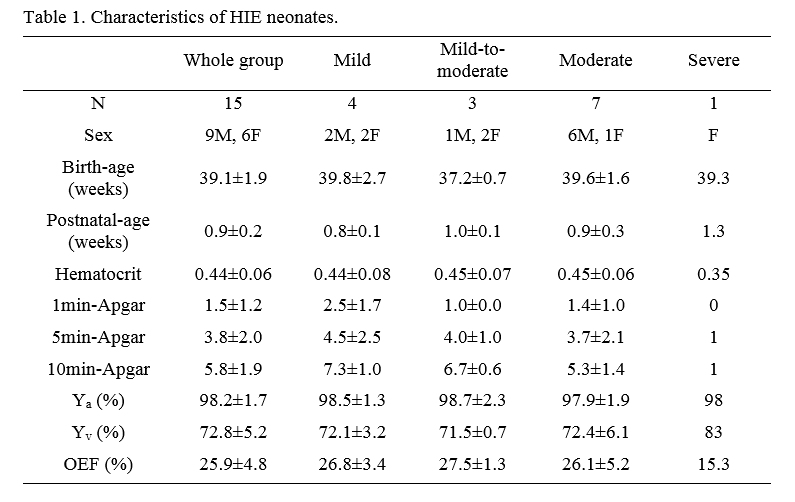
Table 1 summarizes the characteristics and clinical measures of the HIE neonates, grouped by their Sarnat scores. The 1min, 5min and 10min Apgar scores of the neonates were 1.5±1.2, 3.8±2.0 and 5.8±1.9, respectively. 10min Apgar scores significantly correlated with Sarnat scores (P=0.0004), but the 1min and 5min Apgar scores did not (P>0.05).Global OEF was successfully measured from all 15 neonates. Figure 1 shows the TRUST data of a representative neonate. Across the neonates, the mean global Yv and OEF were 72.8±5.2% and 25.9±4.8%, respectively. In the subset of 11 neonates who had CBF measurements, global CBF and CMRO2 were 16.4±4.7ml/min/100g and 38.2±13.9μmol/min/100g, respectively. The global Yv, OEF, CBF and CMRO2 values agreed well with previous literature on HIE newborns.3
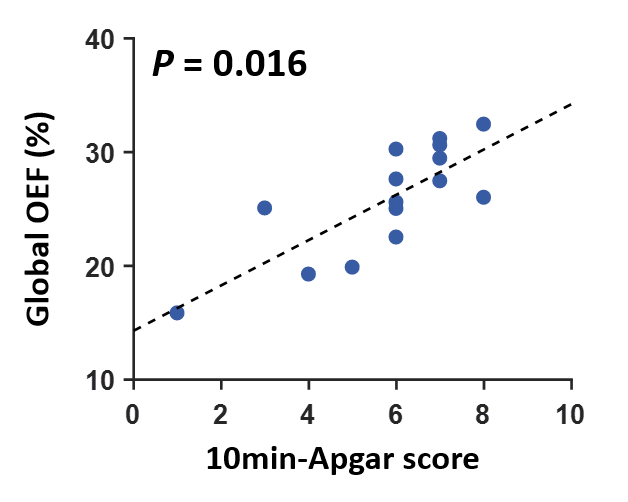
Linear regression analyses revealed that global OEF correlated significantly with 10min Apgar score (corrected-P=0.016). As shown in Figure 2, neonates with lower 10min Apgar scores also had lower OEF. It has been reported that low Apgar scores are associated with increased risks of neonatal and infant death and with long-term neurological disability (e.g., cerebral palsy, epilepsy and cognitive impairment).5,9 Furthermore, OEF was not significantly associated with birth-age, postnatal-age or sex in all analyses (corrected-P>0.1). In the subset of 11 neonates, it was found that CBF and CMRO2 were not significantly associated with Apgar scores (corrected-P>0.19). Therefore, it is plausible that OEF may also be associated with long-term clinical outcomes of these neonates. Future studies will be performed to evaluate this hypothesis.
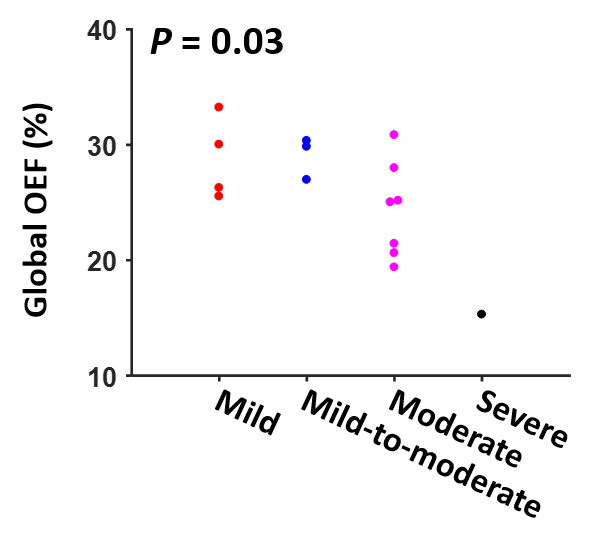
Using Sarnat score as the independent variable, linear regression analyses also found that global OEF was negatively associated with Sarnat score (P=0.03). As shown in Figure 3, neonates with more severe HIE tended to have lower OEF, which is consistent with previous reports.3 On the other hand, CBF and CMRO2 were not related to Sarnat score (P>0.9). Since Sarnat score is a standard clinical evaluation of the severity of HIE, our results suggested that OEF may be a more sensitive biomarker in detecting the severity of HIE than CBF and CMRO2.
CONCLUSION
This work demonstrated that post-hypothermia global OEF was associated with Apgar score at 10min after birth. Global OEF also decreased with the severity of HIE. These findings suggest that quantification of OEF may provide valuable information for the diagnosis and prediction of outcomes for newborns with HIE.Acknowledgements
No acknowledgement found.References
1. Kurinczuk JJ, White-Koning M, Badawi N. Epidemiology of neonatal encephalopathy and hypoxic-ischaemic encephalopathy. Early Hum Dev 2010;86:329-338.
2. De Vis JB, Petersen ET, Alderliesten T, Groenendaal F, de Vries LS, van Bel F, Benders MJ, Hendrikse J. Non-invasive MRI measurements of venous oxygenation, oxygen extraction fraction and oxygen consumption in neonates. Neuroimage 2014;95:185-192.
3. Shetty AN, Lucke AM, Liu P, Sanz Cortes M, Hagan JL, Chu ZD, Hunter JV, Lu H, Lee W, Kaiser JR. Cerebral oxygen metabolism during and after therapeutic hypothermia in neonatal hypoxic-ischemic encephalopathy: a feasibility study using magnetic resonance imaging. Pediatr Radiol 2018. doi: 10.1007/s00247-018-4283-9.
4. Apgar V. A proposal for a new method of evaluation of the newborn infant. Curr Res Anesth Analg 1953;32:260-267.
5. Laptook AR, Shankaran S, Ambalavanan N, Carlo WA, McDonald SA, Higgins RD, Das A, Hypothermia Subcommittee of the NNRN. Outcome of term infants using apgar scores at 10 minutes following hypoxic-ischemic encephalopathy. Pediatrics 2009;124:1619-1626.
6. Sarnat HB, Sarnat MS. Neonatal encephalopathy following fetal distress. A clinical and electroencephalographic study. Arch Neurol 1976;33:696-705.
7. Liu P, Huang H, Rollins N, Chalak LF, Jeon T, Halovanic C, Lu H. Quantitative assessment of global cerebral metabolic rate of oxygen (CMRO2) in neonates using MRI. NMR Biomed 2014;27:332-340.
8. Liu P, Qi Y, Lin Z, Guo Q, Wang X, Lu H. Assessment of cerebral blood flow in neonates and infants: A phase-contrast MRI study. Neuroimage 2019;185:926-933.
9. Ehrenstein V. Association of Apgar scores with death and neurologic disability. Clin Epidemiol 2009;1:45-53.
Figures