4603
Feasibility of a cued deep breathing task to map cerebrovascular reactivity in healthy and clinical pediatric cohorts1Physical Therapy and Human Movement Sciences, Northwestern University, Chicago, IL, United States, 2Biomedical Engineering, McCormick School of Engineering, Northwestern University, Evanston, IL, United States
Synopsis
Cerebrovascular reactivity (CVR) mapping with MRI is emerging as a useful metric of vascular health. Tracking natural fluctuations in CO2 (a vasodilator) during a resting state fMRI scan has been proposed as a method to map CVR, but it is uncertain whether this method is reliable. We propose adding a two-minute breathing challenge prior to a resting state acquisition to transiently reduce CO2 levels. Here, we tested the feasibility of this method in a small pediatric cohort. The breathing challenge produced more robust CVR maps in both controls and children with cerebral palsy compared to resting state data alone.
Introduction
Cerebrovascular reactivity (CVR) refers to the capacity of the brain’s blood vessels to respond to a vasoactive stimulus1, and CVR mapping with MRI is emerging as a useful metric of vascular health2. We aim to develop a protocol for mapping CVR in children with cerebral palsy in order to understand how each child’s cerebrovasculature has recovered following early brain injury. Imaging in pediatric cohorts is known to be challenging, and it is critical to construct a CVR paradigm that is robust to combat the challenges of participant compliance and movement artifacts. Others have proposed using natural fluctuations in CO2 levels to assess CVR in a resting state fMRI acquisition3,4. This is simple to execute, but it is not yet certain whether it consistently and accurately maps CVR. We propose the addition of a two-minute breathing challenge to transiently reduce CO2 levels and evoke a vasoconstrictive response. Here we scan a small cohort of pediatric participants, both typically developing and with cerebral palsy, to assess the feasibility of incorporating this CVR methodology in larger clinical studies.Methods
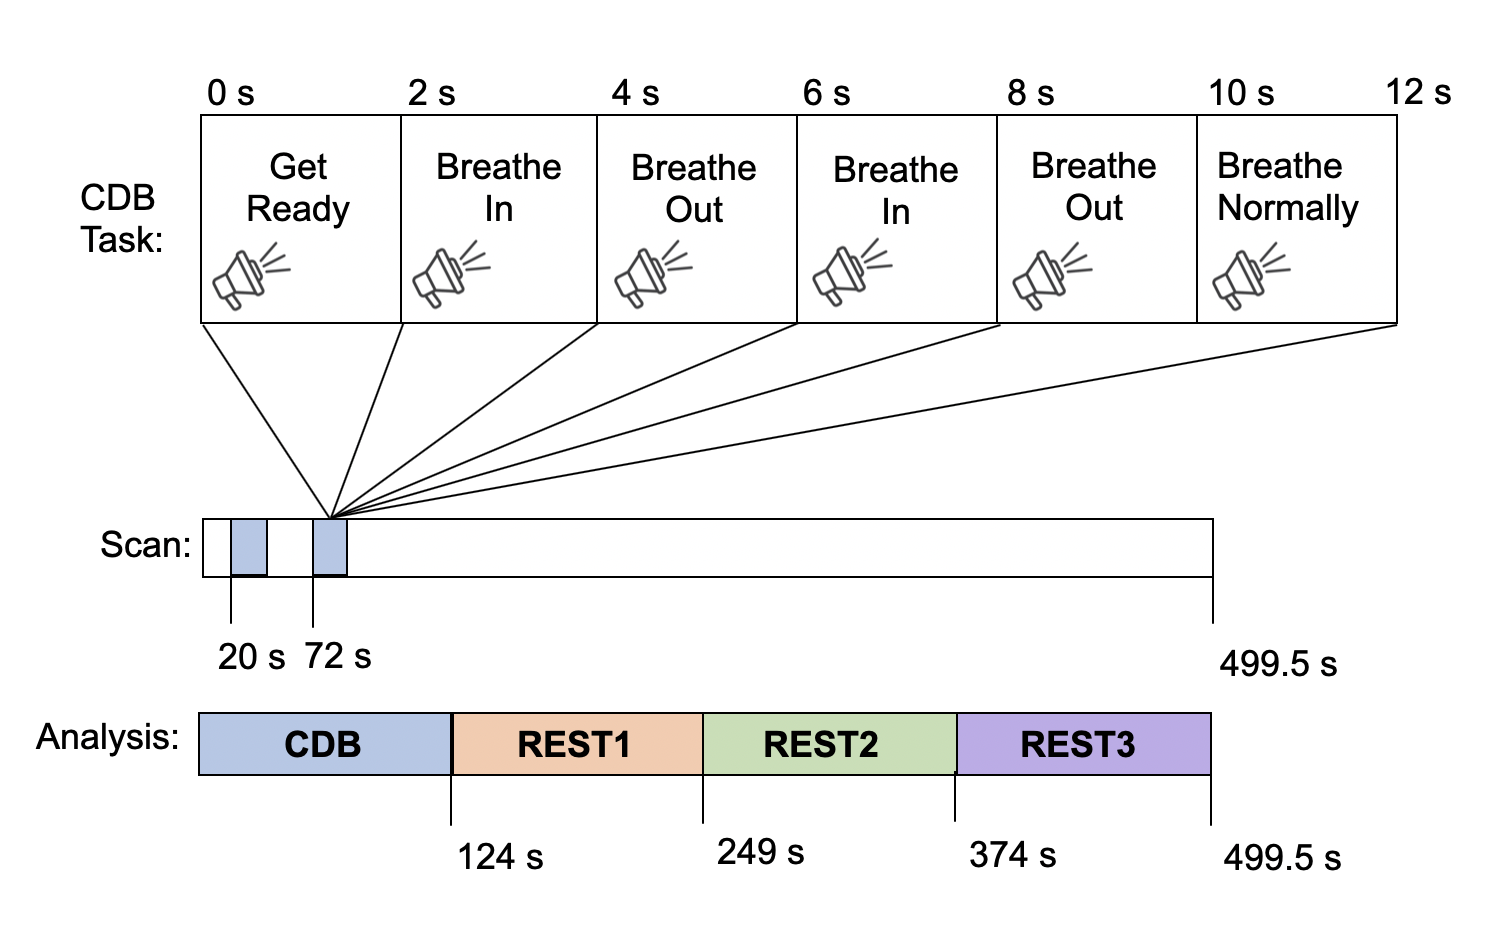
Participants: Three healthy children (2 females, 11.7±4.5y) and three children with cerebral palsy (3 females, 11.7±8.3y) were included in this pilot study. Cerebral palsy patients were included based on a record of unilateral, pediatric brain injury in the Cerebral Palsy Research Registry database5.Data acquisition: Imaging data were collected on a 3T Siemens PrismaFit scanner using a BOLD-weighted gradient-echo echo-planar imaging sequence (TR/TE=555/22 ms, 64 slices, multiband factor=8, resolution=2 mm isotropic, 900 volume acquisitions). All subjects performed a cued deep breathing (CDB) task6, immediately followed by resting-state, as shown in Figure 1. During the CDB task, participants were given verbal instructions to breathe in deeply, breathe out deeply, and breathe normally. During rest, subjects viewed a fixation cross. Expired CO2 was monitored with a nasal cannula (ADInstruments, Dunedin, NZ). A T1-weighted MPRAGE scan was also acquired (TR/TE=2000/33 ms, resolution=1 mm3).
Data analysis: Functional data were brain extracted and motion corrected, and the high-resolution T1-weighted image was co-registered to this functional space (FSL, AFNI). End-tidal carbon dioxide values (PETCO2) were extracted using a peak detection algorithm in Matlab (MathWorks, Natick, MA) and visually inspected to insert or delete misidentified peaks. fMRI data and the corresponding PETCO2 data were divided into four equal segments: the CDB task window and three subsequent rest periods. In each segment, the PETCO2 variance was calculated. Framewise Displacement (FD) was calculated using the transformations identified during motion correction7 and averaged in each scan segment.
CVR maps: The preprocessed BOLD fMRI data were modeled by polynomial drift terms, 6 motion parameters, and the PETCO2 timeseries in a generalized linear model (GLM) framework. Fitting was performed twice, for the full dataset (CDB+Rest) and the resting-state data only (Rest). Cerebrovascular reactivity (CVR) maps were obtained by dividing the fit coefficients for the PETCO2 regressor by the fitted mean of the BOLD timeseries.
Results
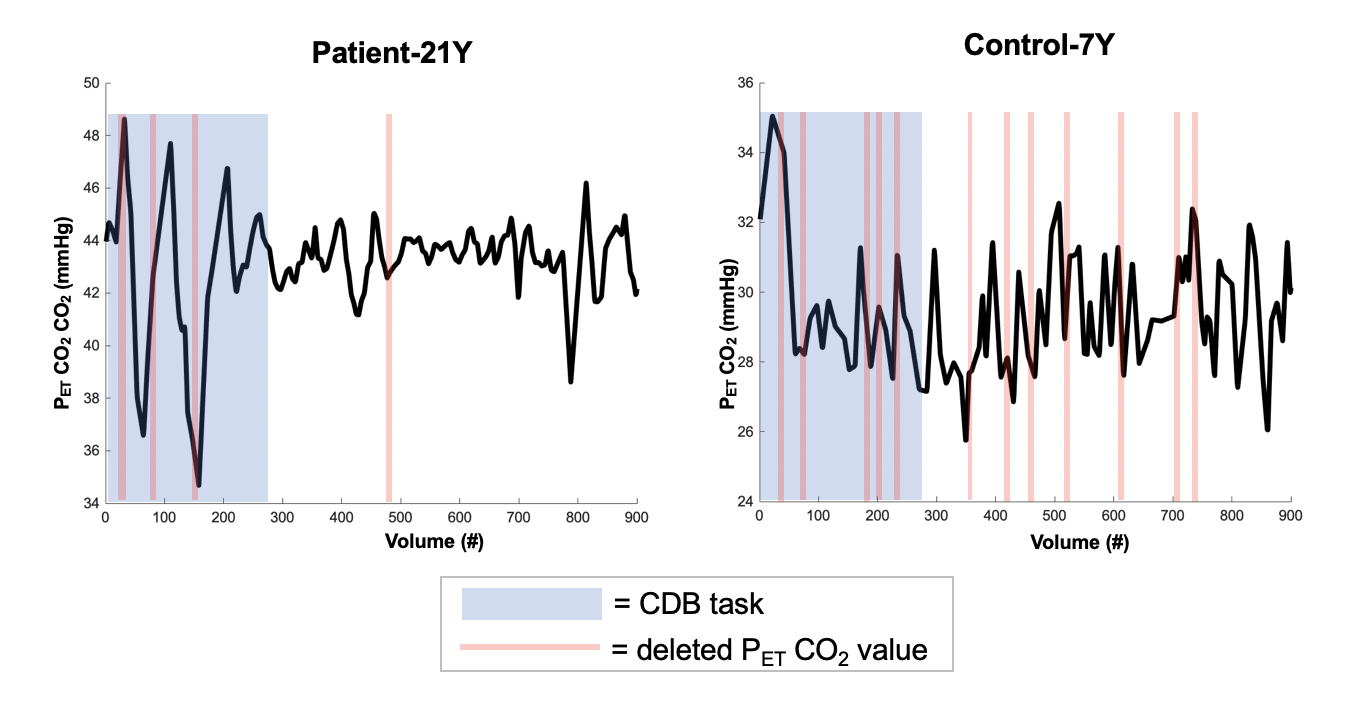
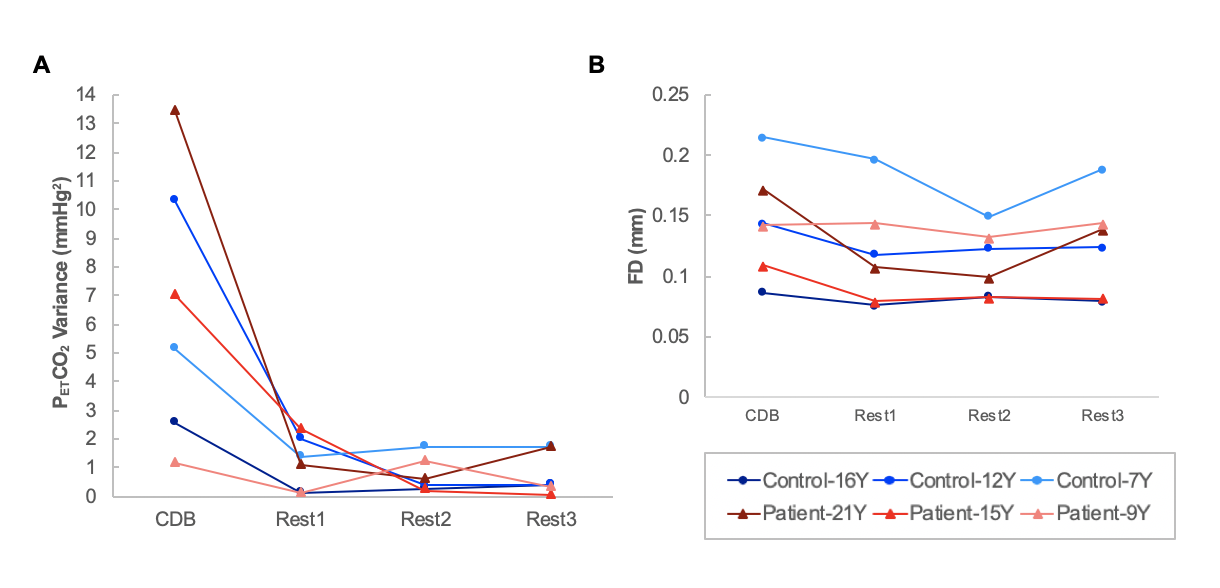
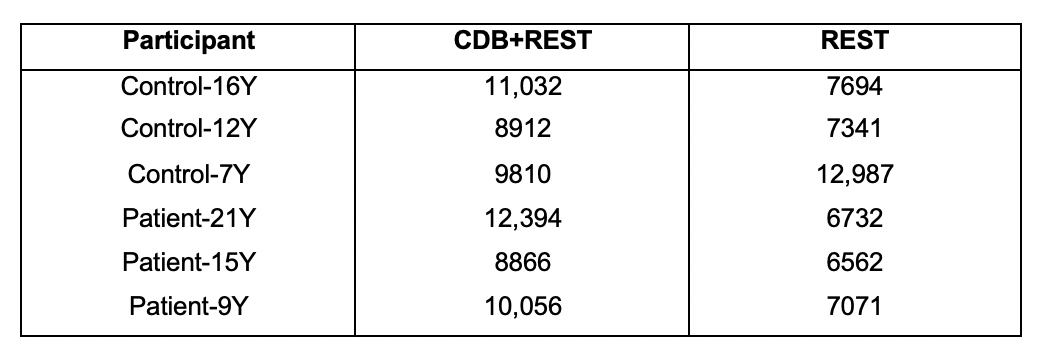
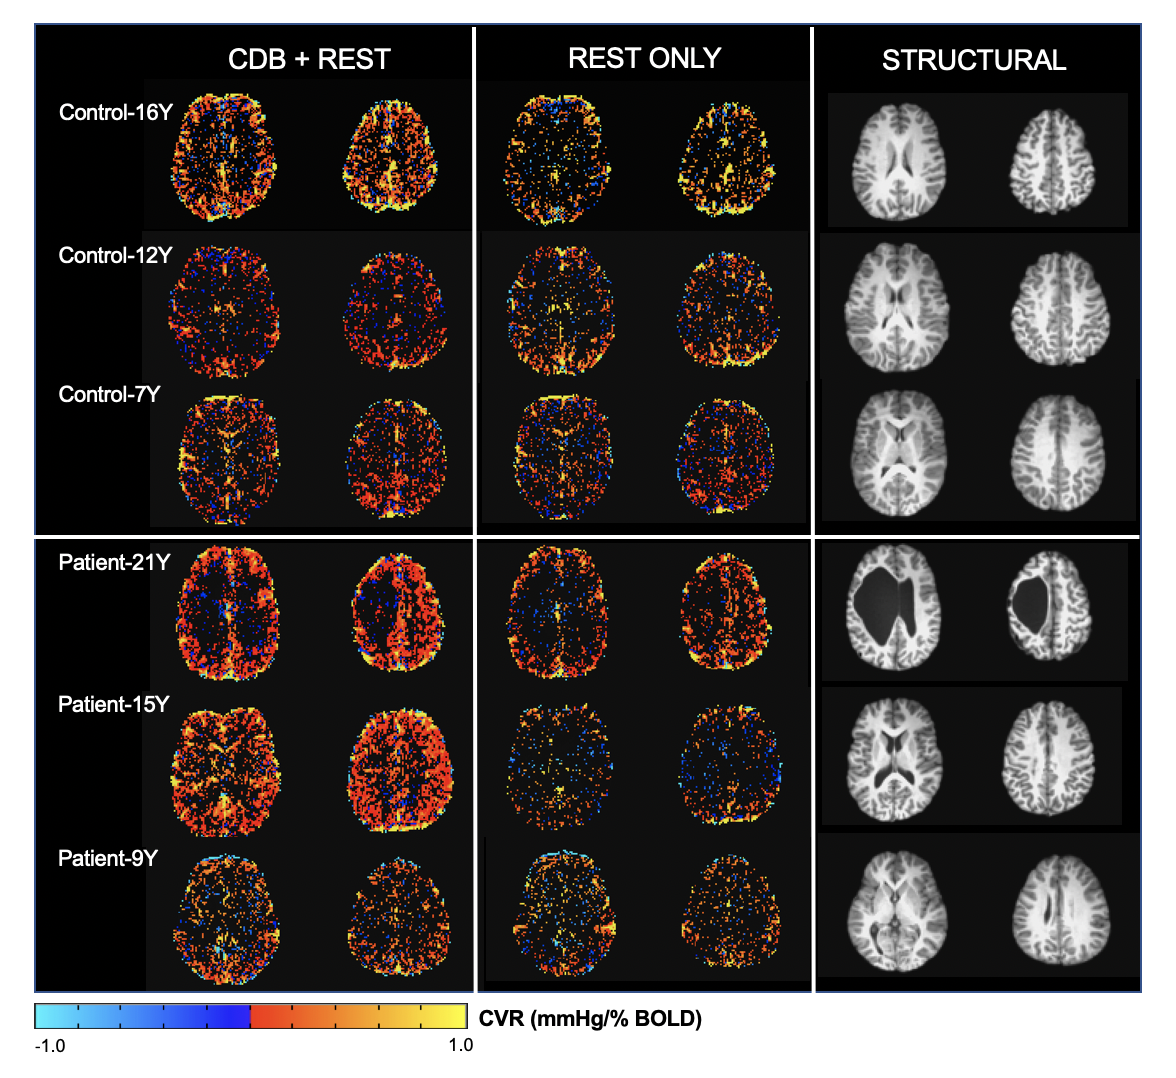
Within this pilot cohort, individual differences in participant compliance with the CDB task were observed. Figure 2 shows the end-tidal CO2 traces for two representative subjects. Figure 2A shows an example of a compliant subject where the task achieves robust PETCO2 decreases and end-tidal values are successfully identified in the majority of the scan. Figure 2B shows a non-compliant subject, with no task-related changes in PETCO2 and poor end-tidal detection. Figure 3A summarizes the variance in PETCO2 across scan segments for all subjects. All but one participant demonstrated an increased PETCO2 variance during the CDB portion of the scan compared to rest. Figure 3B shows the average FD in each scan segment. Using a paired, student’s t-test, a significant difference was found (p = 0.0458) between the group mean FD during the CDB portion of the scan and the group mean FD in the segment immediately following (Rest1), indicating the CDB task increased head motion. Figure 4 shows the CVR maps for CDB+Rest and Rest in all participants. In general, CVR maps were more robust when the full dataset (CDB+Rest) was considered, as indicated by more significant CVR values in cortical gray matter voxels. However, this improvement is not observed in all participants. Table 1 compares the number of significant voxels in the CDB+Rest and Rest fits for each subject. For all except the youngest participant (Control-7Y), there is a greater number of voxels in the full dataset.Discussion
Our initial findings indicate that for participants who can comply with the CDB task, appending this to the beginning of a standard resting state scan is a potential option for mapping cerebrovascular reactivity in pediatric cohorts. However, our results indicate that age may be a limiting factor in the success of this approach. Older participants tended to achieve higher PETCO2 variance during the task, resulting in more reliable CVR maps. Another limitation to consider is that the CDB task may introduce extra motion in the fMRI data, although this is also likely to be dependent on age. Based on this pilot study, we propose that the CDB task is a simple addition to a scan protocol that could lead to greater confidence in CVR maps and improve our understanding of vascular function in cerebral palsy.Acknowledgements
Research reported in this abstract was supported by the Eunice Kennedy Shriver National Institute of Child Health and Human Development of the National Institutes of Health under award number K12HD073945. The authors would like to acknowledge Marie Wasielewski and Carson Ingo for their support in acquiring this data.References
1. Ainslie, P. N. & Duffin, J. Integration of cerebrovascular CO2 reactivity and chemoreflex control of breathing: mechanisms of regulation, measurement, and interpretation. Am. J. Physiol. Integr. Comp. Physiol. 296, R1473–R1495 (2009).
2. Liu, P. & De Vis, J. B. Cerebrovascular reactivity (CVR) MRI with CO2 challenge: A technical review. Neuroimage 187, 104–115 (2019).
3. Liu, P. et al. Cerebrovascular reactivity mapping without gas challenges. Neuroimage 146, 320–326 (2017).
4. Golestani, A. M., Wei, L. L. & Chen, J. J. Quantitative mapping of cerebrovascular reactivity using resting-state BOLD fMRI: Validation in healthy adults. Neuroimage 138, 147–163 (2016).
5. Hurley, D. S. et al. The Cerebral Palsy Research Registry: Development and Progress Toward National Collaboration in the United States. J. Child Neurol. 26, 1534–1541 (2011).
6. Bright, M. G., Bulte, D. P., Jezzard, P. & Duyn, J. H. Characterization of regional heterogeneity in cerebrovascular reactivity dynamics using novel hypocapnia task and BOLD fMRI. Neuroimage 48, 166–175 (2009).
7. Power, J. D., Barnes, K. A., Snyder, A. Z., Schlaggar, B. L. & Petersen, S. E. Spurious but systematic correlations in functional connectivity MRI networks arise from subject motion. Neuroimage 59, 2142–2154 (2012).
Figures