4593
Improved quantitative accuracy using high-resolution DTI guided QSM to profile myelin maturation in pediatric brains
Lijia Zhang1, Chris Petty1, and Allen Song1
1Duke University Brain Imaging and Analysis Center, Durham, NC, United States
1Duke University Brain Imaging and Analysis Center, Durham, NC, United States
Synopsis
Quantitative susceptibility mapping (QSM) has the potential to help access brain development, in particular, the magnetic susceptibility changes during the myelination processes in the white matter. However, the quantitative accuracy of QSM is limited by its angle dependency to the fiber orientation. In this study, we propose a method utilizing ultra-high resolution diffusion tensor imaging (DTI) to delineate the major fiber bundles (i.e. corpus callosal fibers), followed by tract-based QSM, to largely remove the angle dependence and accurately quantify the magnetic susceptibility changes during brain development.
Introduction
Quantitative susceptibility mapping (QSM) has seen increased utility in assessing brain development. However, magnetic susceptibility has been demonstrated to be anisotropic and dependent on the fiber orientation with respect to the main magnetic field (B0). The purpose of this study is to develop ultra-high resolution DTI tract-guided QSM to minimize the orientation dependence of susceptibility measures, as well as to assess the myelination pattern during brain development in pediatric brains. In particular, the posterior-anterior myelination pattern of the corpus callosal fibers were evaluated using the proposed DTI-guided QSM method.Methods
DTI data were obtained with high-resolution MUSE (MUltiplexed Sensitivity Encoding) diffusion MRI sequence on a GE UltraHigh Performance (UHP) 3T MRI scanner (Waukesha, WI), equipped with a high-power 60 cm gradient coil with a peak strength at 115 mT/m, running on the Premier Platform. A total of 15 diffusion directions were used at a b=800 s/mm2. A high isotropic spatial resolution at 1 mm was achieved with TE of 59 ms. In the same session, a spatially matched QSM protocol using a 3D SWAN sequence (16 TE increments, TR=44.3 ms, flip angle = 15 degrees, 1 mm3 resolution) was carried out. The T1, DTI and QSM images were coregistered, and then the corpus callosum ROI was extracted by warping the JHU DTI MNI “Eve” WMPM Type II template1 to subject’s DTI space via Large Deformation Diffeomorpic Metric Mapping (LDDMM)2. DTI tractography was accomplished by MRtrix3 with streamline tracking followed by spline filtering3 and spherical-deconvolution informed filtering (SIFT)4. The angles of the corpus callosal fibers were calculated from the principal eigenvector of the diffusion tensor, and the macroscopic magnetic susceptibility measures were overlaid onto the fibers to illustrate the angle dependency, which can then be largely removed by deriving the rotationally-invariant magnetic susceptibility anisotropy (MSA)5. Experiments and analyses were carried out in an initial cohort of eight pediatric patients (ages 2-4). To profile the asymmetric posterior to anterior brain development and myelination, the corpus callosum was further parcellated into four regions based on Witelson’s scheme6: anterior midbody, posterior midbody, isthmus and splenium, then the differences of the MSA of each segments were assessed.Results and Discussion
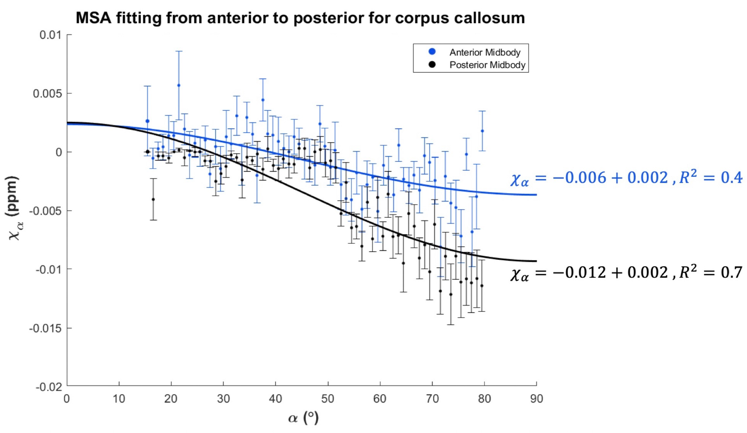
Shown in Fig. 1 is an example of parcellation of the corpus callosal fibers of a representative subject (male, 3.79 years old), with macroscopic susceptibility values overlaid onto the fibers. The macroscopic magnetic susceptibility ($$$\chi_\alpha$$$) in all voxels along the fiber bundle were then fitted using $$$\chi_\alpha=MSA\cdot sin^2\alpha+\chi_0$$$ [Eqn. 1]7, where MSA is the magnetic susceptibility anisotropy, which is rotationally-invariant and is proportional to the volume fraction of local myelin lipids. $$$\chi_0$$$ is the baseline susceptibility subject to the choice of frame of reference and absolute susceptibility.Fig. 2 shows the MSA fitting results of the anterior and posterior midbody using macroscopic susceptibility values from QSM, guided by the angles derived from DTI. It was found that the posterior region fits better into Eqn. 1 and is more diamagnetic (i.e. better myelination) than the anterior.
Fig. 3 further illustrates this pattern by showing the derived MSA from the anterior to posterior corpus callosum for all subjects. A clear posterior-anterior order of diamagnetism and therefore myelin maturation was demonstrated, as the splenium is more diamagnetic than the midbody (p=0.007) and the posterior midbody is more diamagnetic than the anterior (p=0.011), providing convergent evidence that the posterior corpus callosum is better myelinated than the more anterior parts8,9.
Conclusion
We have developed a DTI-guided QSM method to more accurately quantify the magnetic susceptibility of major fiber tracts with high spatial accuracy and minimal angle dependence, which can be used to better evaluate white matter myelin maturation pattern of the brain. It is anticipated that this quantitative technique may find broad utility to help characterize white matter development in healthy brains as well as to assess various white-matter related brain disorders.Acknowledgements
The study is supported in part by NIH grant R01 NS 075017.References
- Oishi, Kenichi, et al. Atlas-based whole brain white matter analysis using large deformation diffeomorphic metric mapping: application to normal elderly and Alzheimer's disease participants. Neuroimage 46.2 (2009): 486-499.
- Beg, M. Faisal, et al. Computing large deformation metric mappings via geodesic flows of diffeomorphisms. International journal of computer vision 61.2 (2005): 139-157.
- Veraart, Jelle, Els Fieremans, and Dmitry S. Novikov. Diffusion MRI noise mapping using random matrix theory. Magnetic resonance in medicine 76.5 (2016): 1582-1593.
- Smith, Robert E., et al. "SIFT: spherical-deconvolution informed filtering of tractograms." Neuroimage 67 (2013): 298-312.
- Li, Wei, et al. Magnetic susceptibility anisotropy of human brain in vivo and its molecular underpinnings. Neuroimage 59.3 (2012): 2088-2097.
- Witelson, Sandra F. Hand and sex differences in the isthmus and genu of the human corpus callosum: a postmortem morphological study. Brain 112.3 (1989): 799-835.
- Argyridis, Ioannis, et al. Quantitative magnetic susceptibility of the developing mouse brain reveals microstructural changes in the white matter. Neuroimage 88 (2014): 134-142.
- Luders, Eileen, Paul M. Thompson, and Arthur W. Toga. The development of the corpus callosum in the healthy human brain. Journal of Neuroscience 30.33 (2010): 10985-10990.
- Keshavan, Matcheri S., et al. Development of the corpus callosum in childhood, adolescence and early adulthood. Life sciences 70.16 (2002): 1909-1922.
Figures
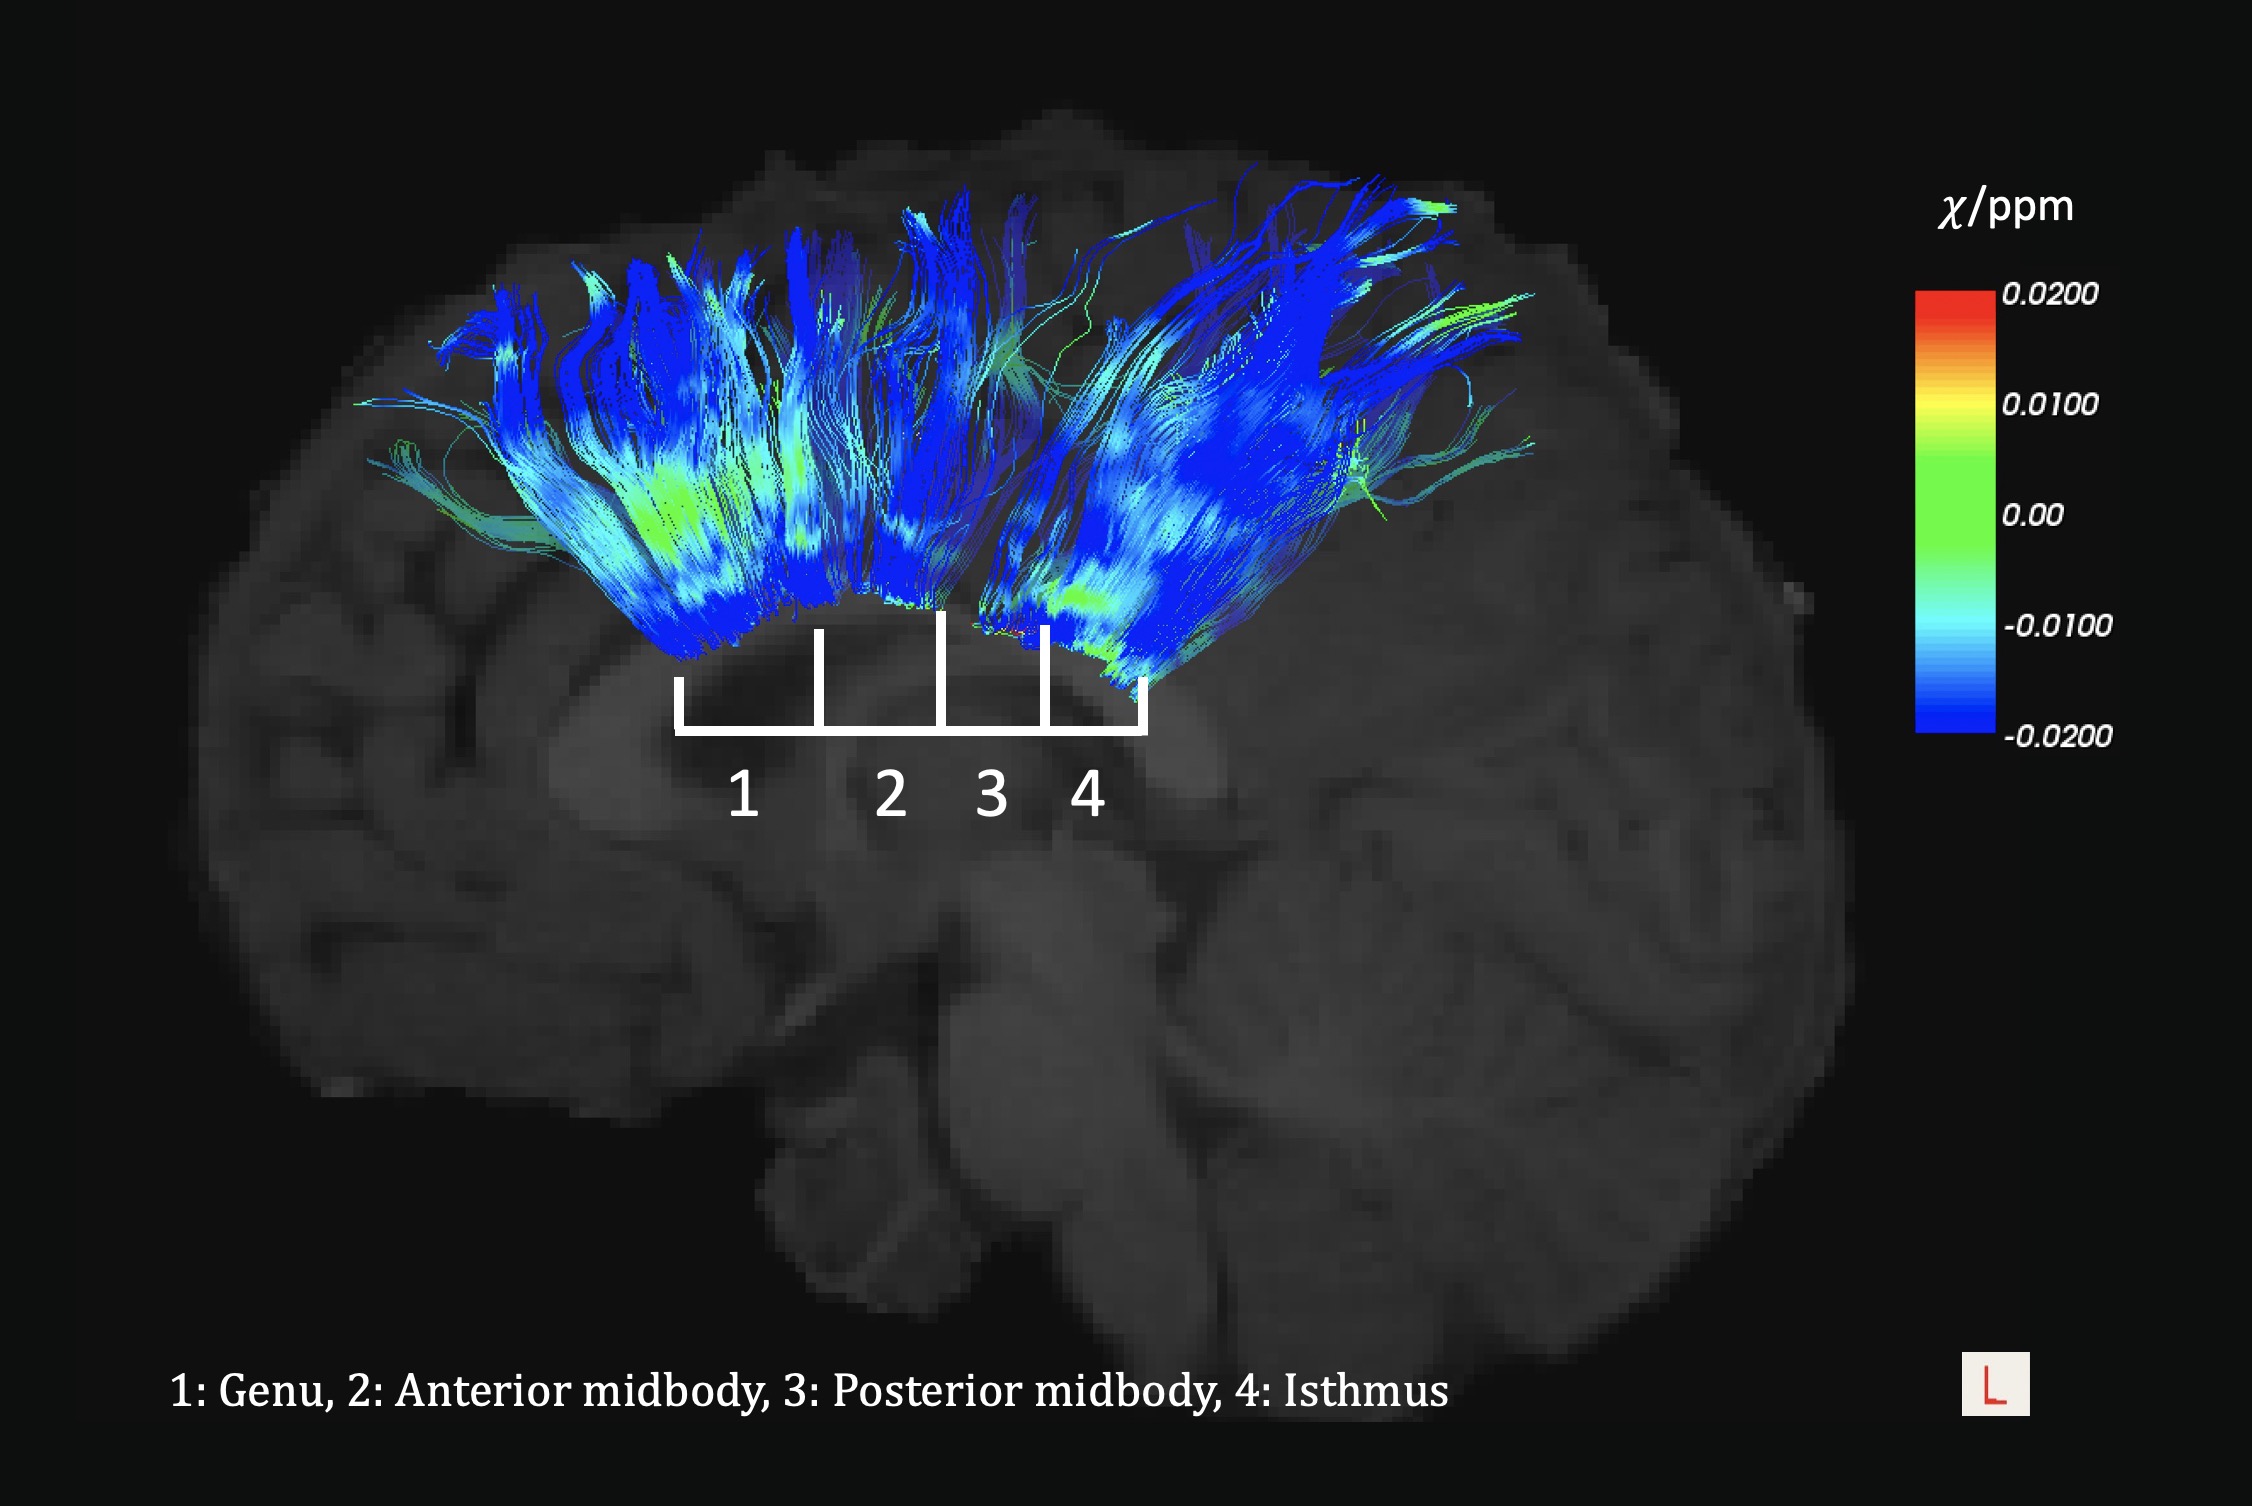
Corpus callosum parcellation with macsroscopic susceptibility
overlaid onto fibers
MSA
fitting for the anterior and posterior midbody
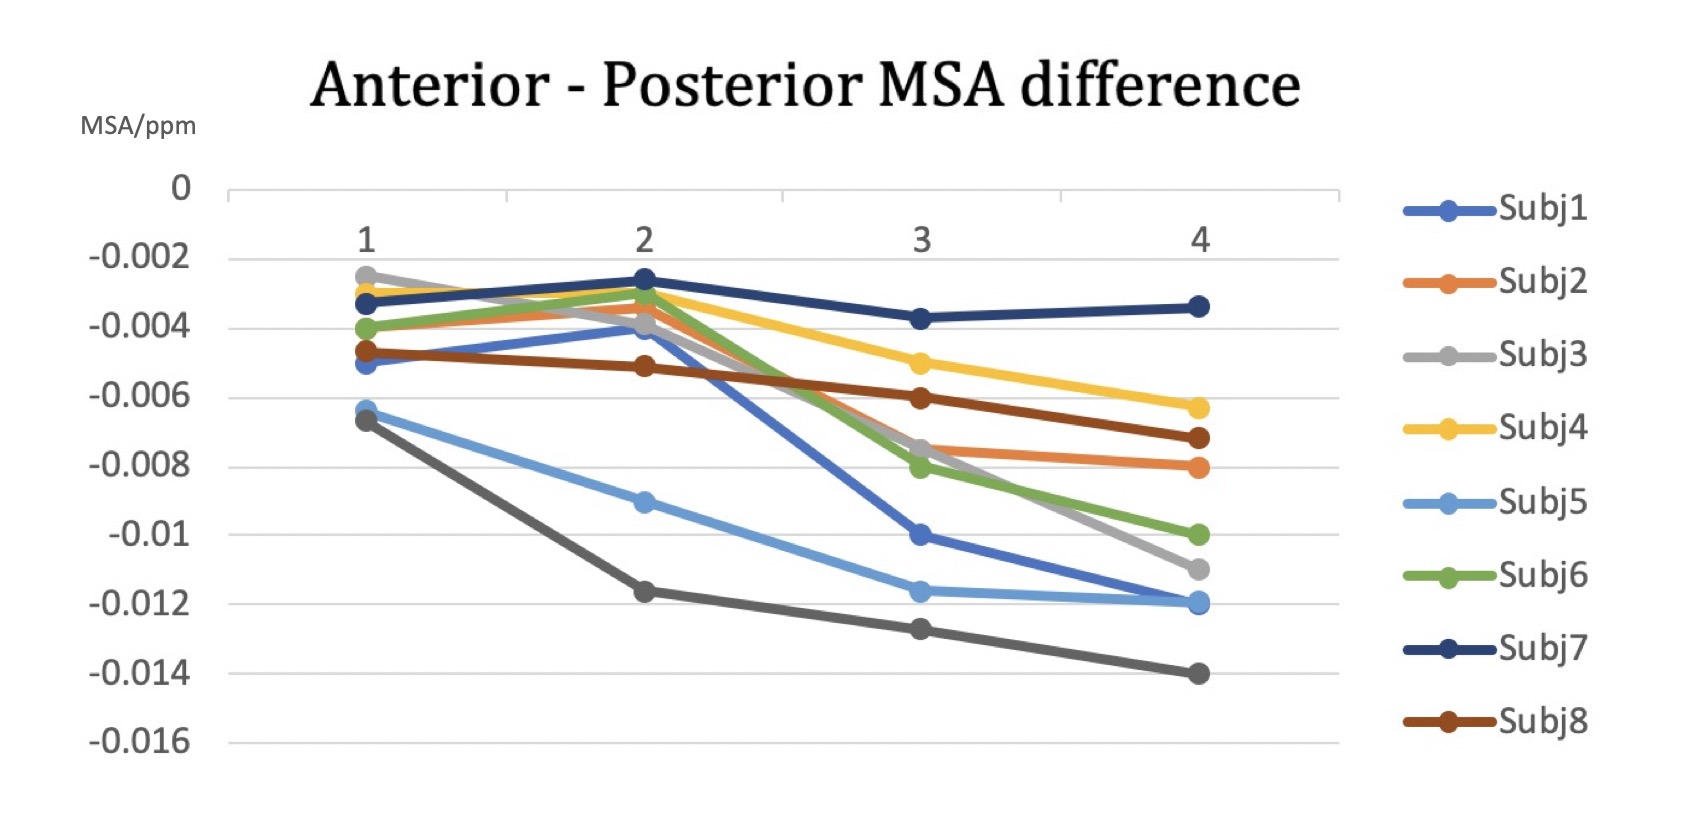
MSA geometric distribution of the corpus callosal fibers