4588
Resting State Functional Connectivity and Angiogenesis-related Gene Co-Expression Networks in early brain development1Division of Development and Growth, Department of Pediatrics, University of Geneva, Geneva, Switzerland, 2Institute of Bioengineering, Ecole Polytechnique Fédérale de Lausanne (EPFL), Lausanne, Switzerland, 3Division of Newborn Medicine, Department of Medicine, Harvard Medical School, Boston, MA, United States, 4Institute of Mathematics, Ecole Polytechnique Fédérale de Lausanne (EPFL), Lausanne, Switzerland
Synopsis
During early brain development, rs-functional connectivity exhibits regional and age-specific activation patterns. We hypothesize that these rs-fMRI patterns might reflect maturity of intracerebral microvascular compartment linked to spatio-temporal genetic expression patterns. The genetic patterns were explored through postmortem human brain specimens and the rs-fMRI connectivity using a longitudinal preterm dataset. rs-functional connectivity and angiogenic genes expression show spatio-temporal differences during early brain development. We observe an increased role of the primary somatosensory and motor cortices from late-fetal to neonatal periods that might be driven by an increased expression of important angiogenic genes in these regions.
Introduction
Functional resting state MRI (rs-fMRI) reflects a combination of effects from cerebral blood flow, volume and oxygenation1. During brain development preterm infants show regional and age-specific rs-fMRI activation patterns2. We hypothesize that these activation patterns reflect maturity of intracerebral microvasculature. The spatio-temporal gene expression patterns that drive angiogenic events have been estimated using postmortem human brain specimens3. We aim to compare the spatio-temporal changes in rs-fMRI to the spatio-temporal changes in genes controlling angiogenesis, to identify regional functional connectivity modifications and its correlation to gene networks relevant for angiogenesis in the developing human neocortex.Methods
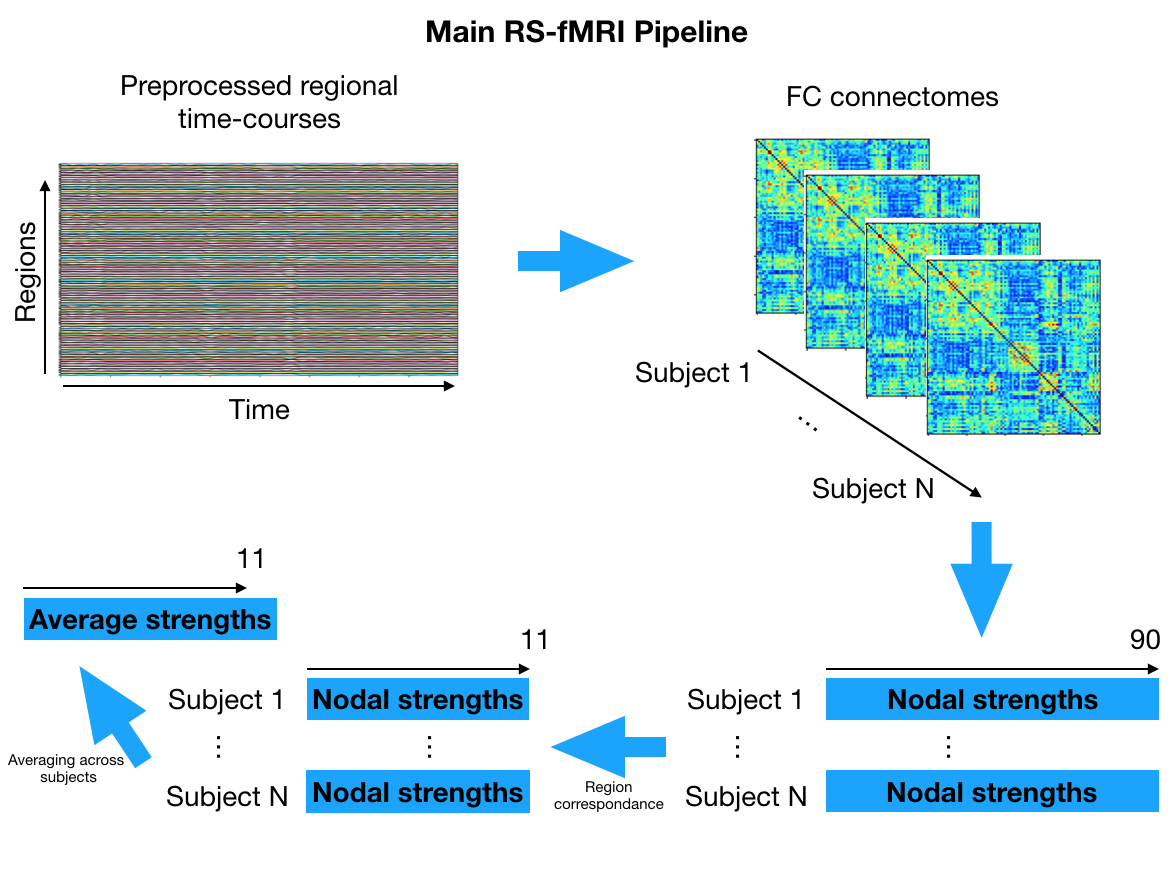
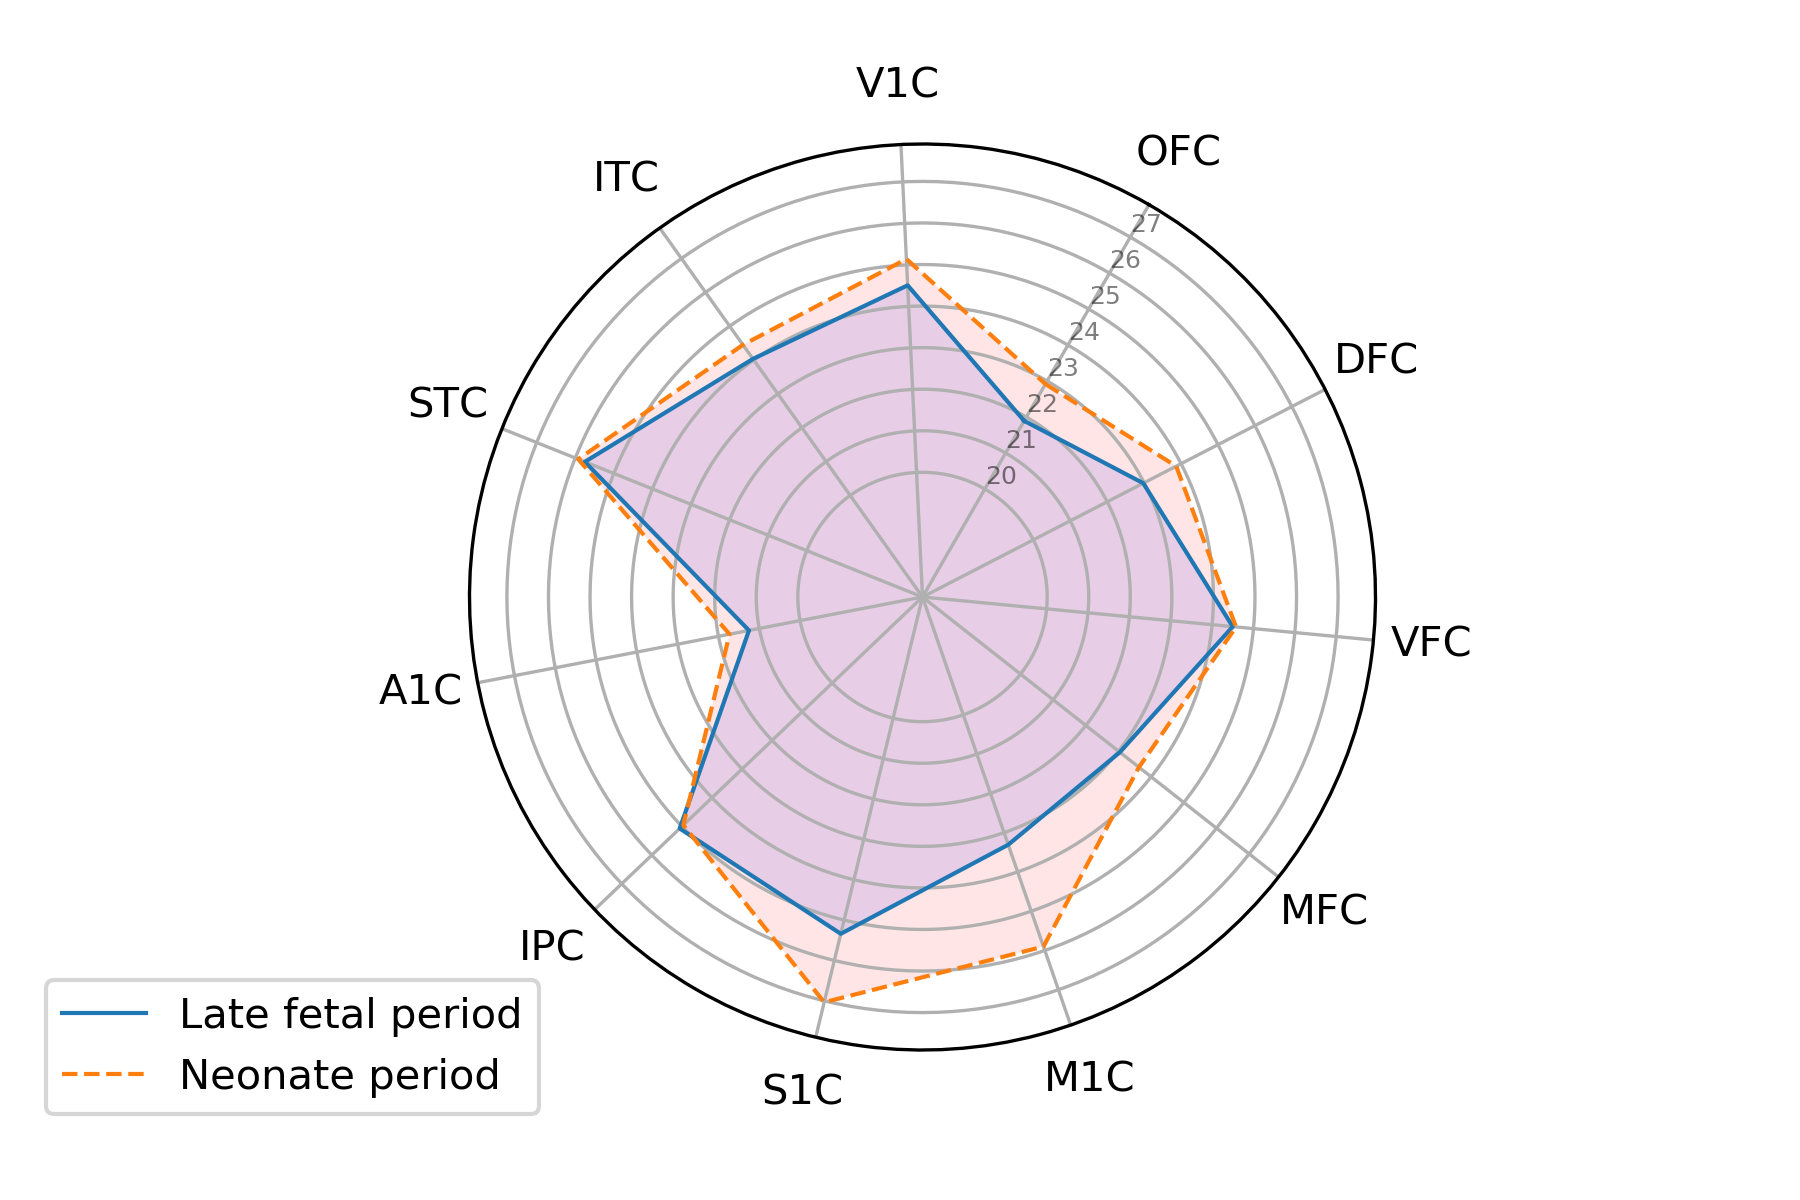
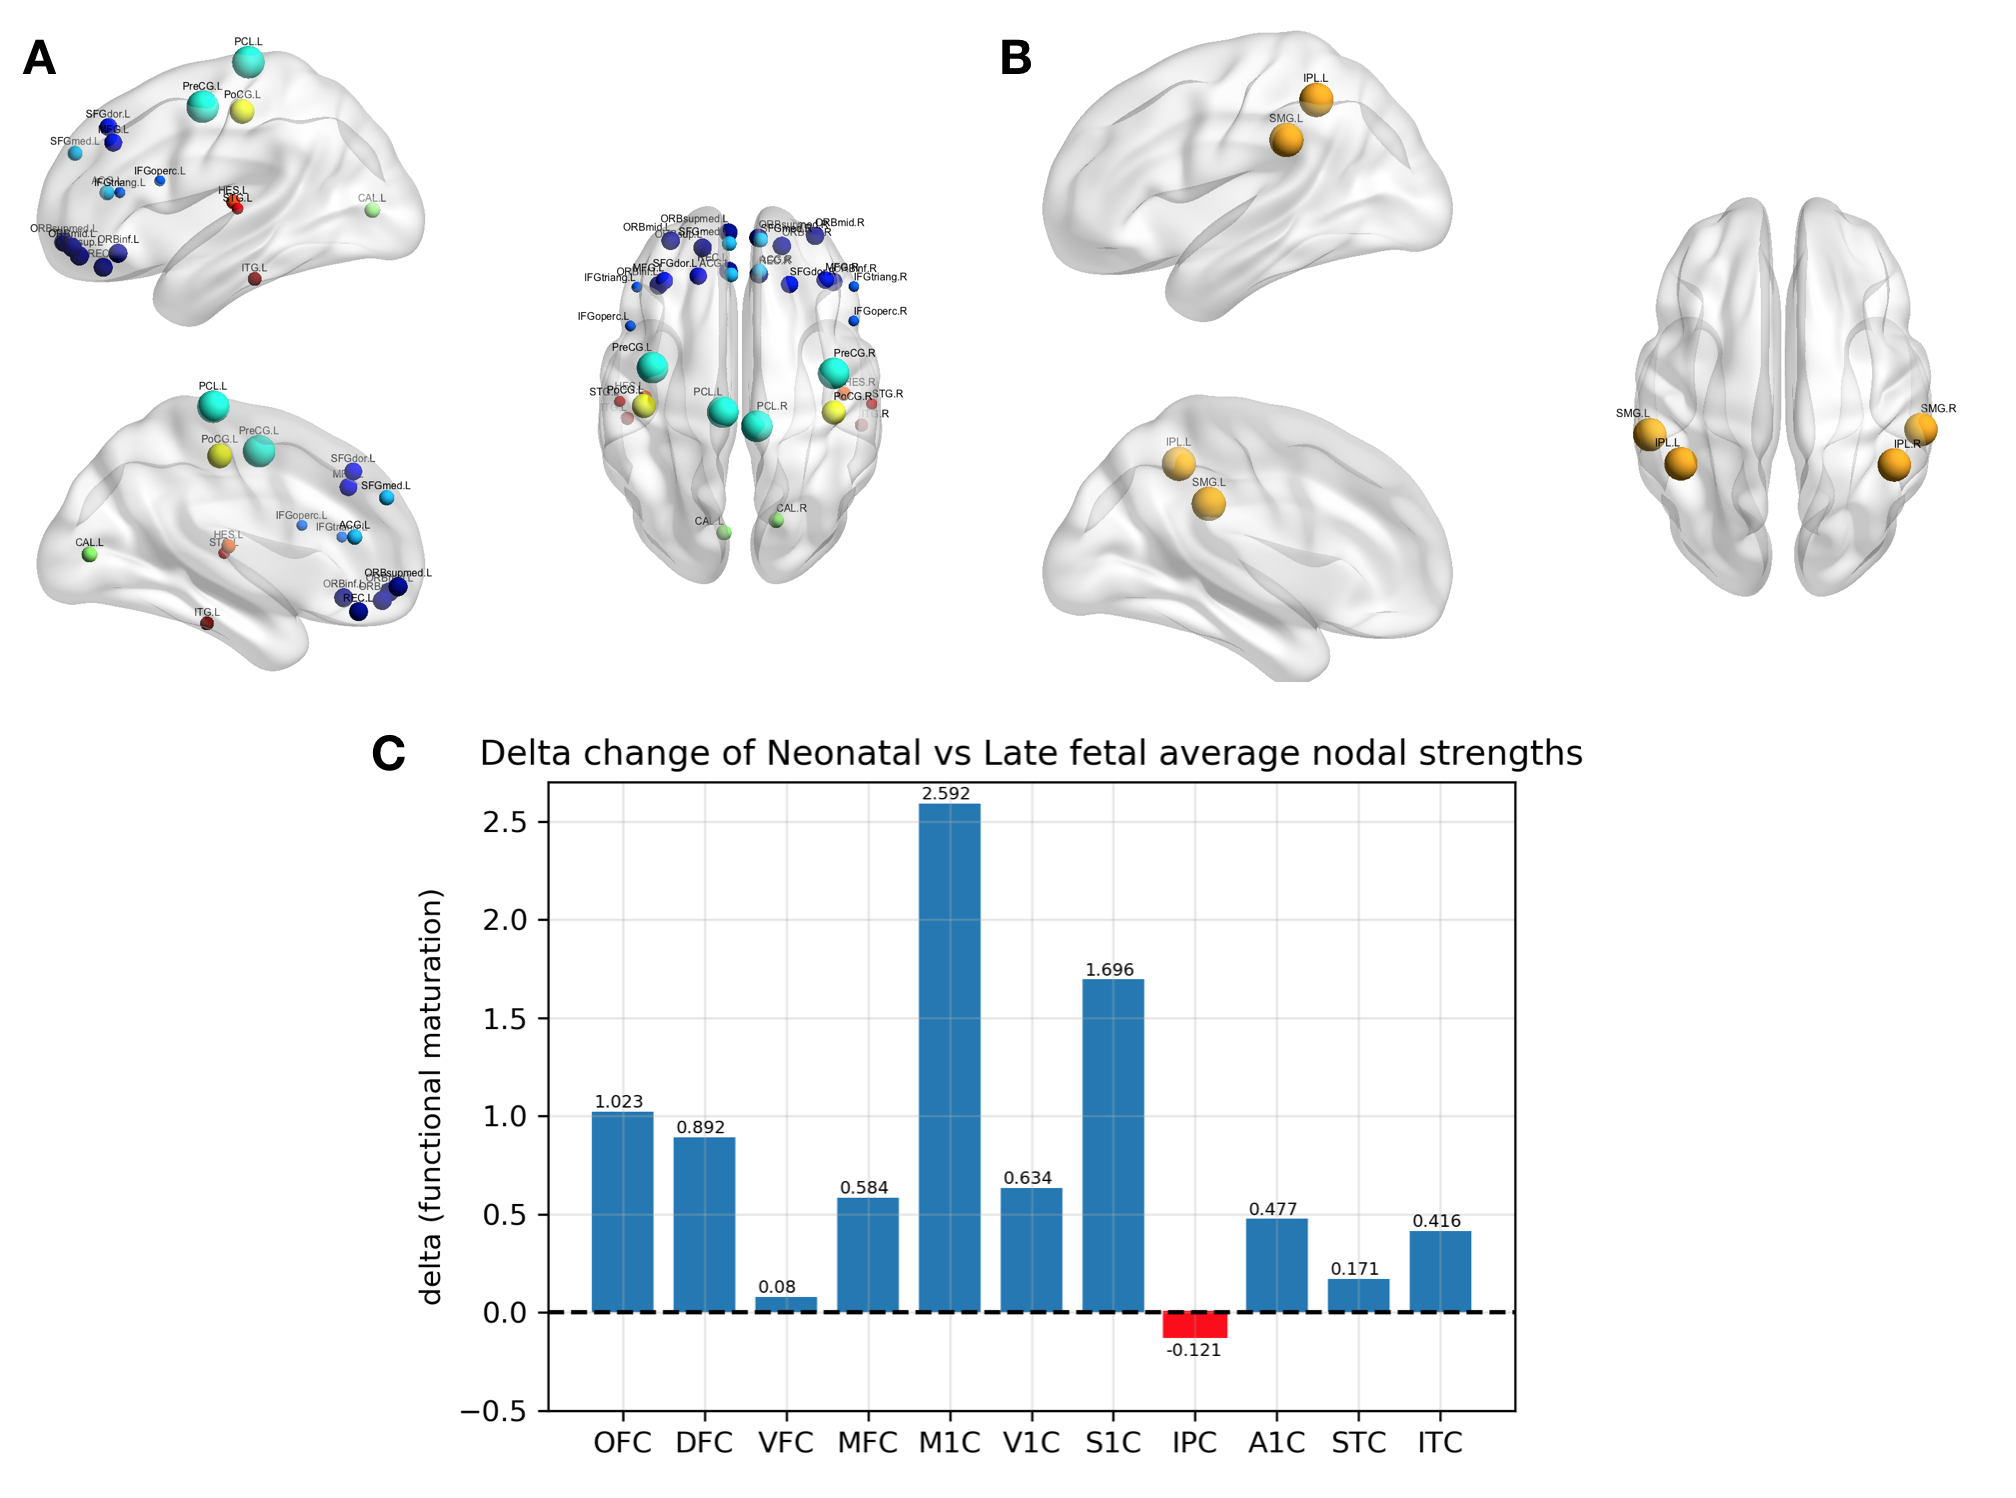
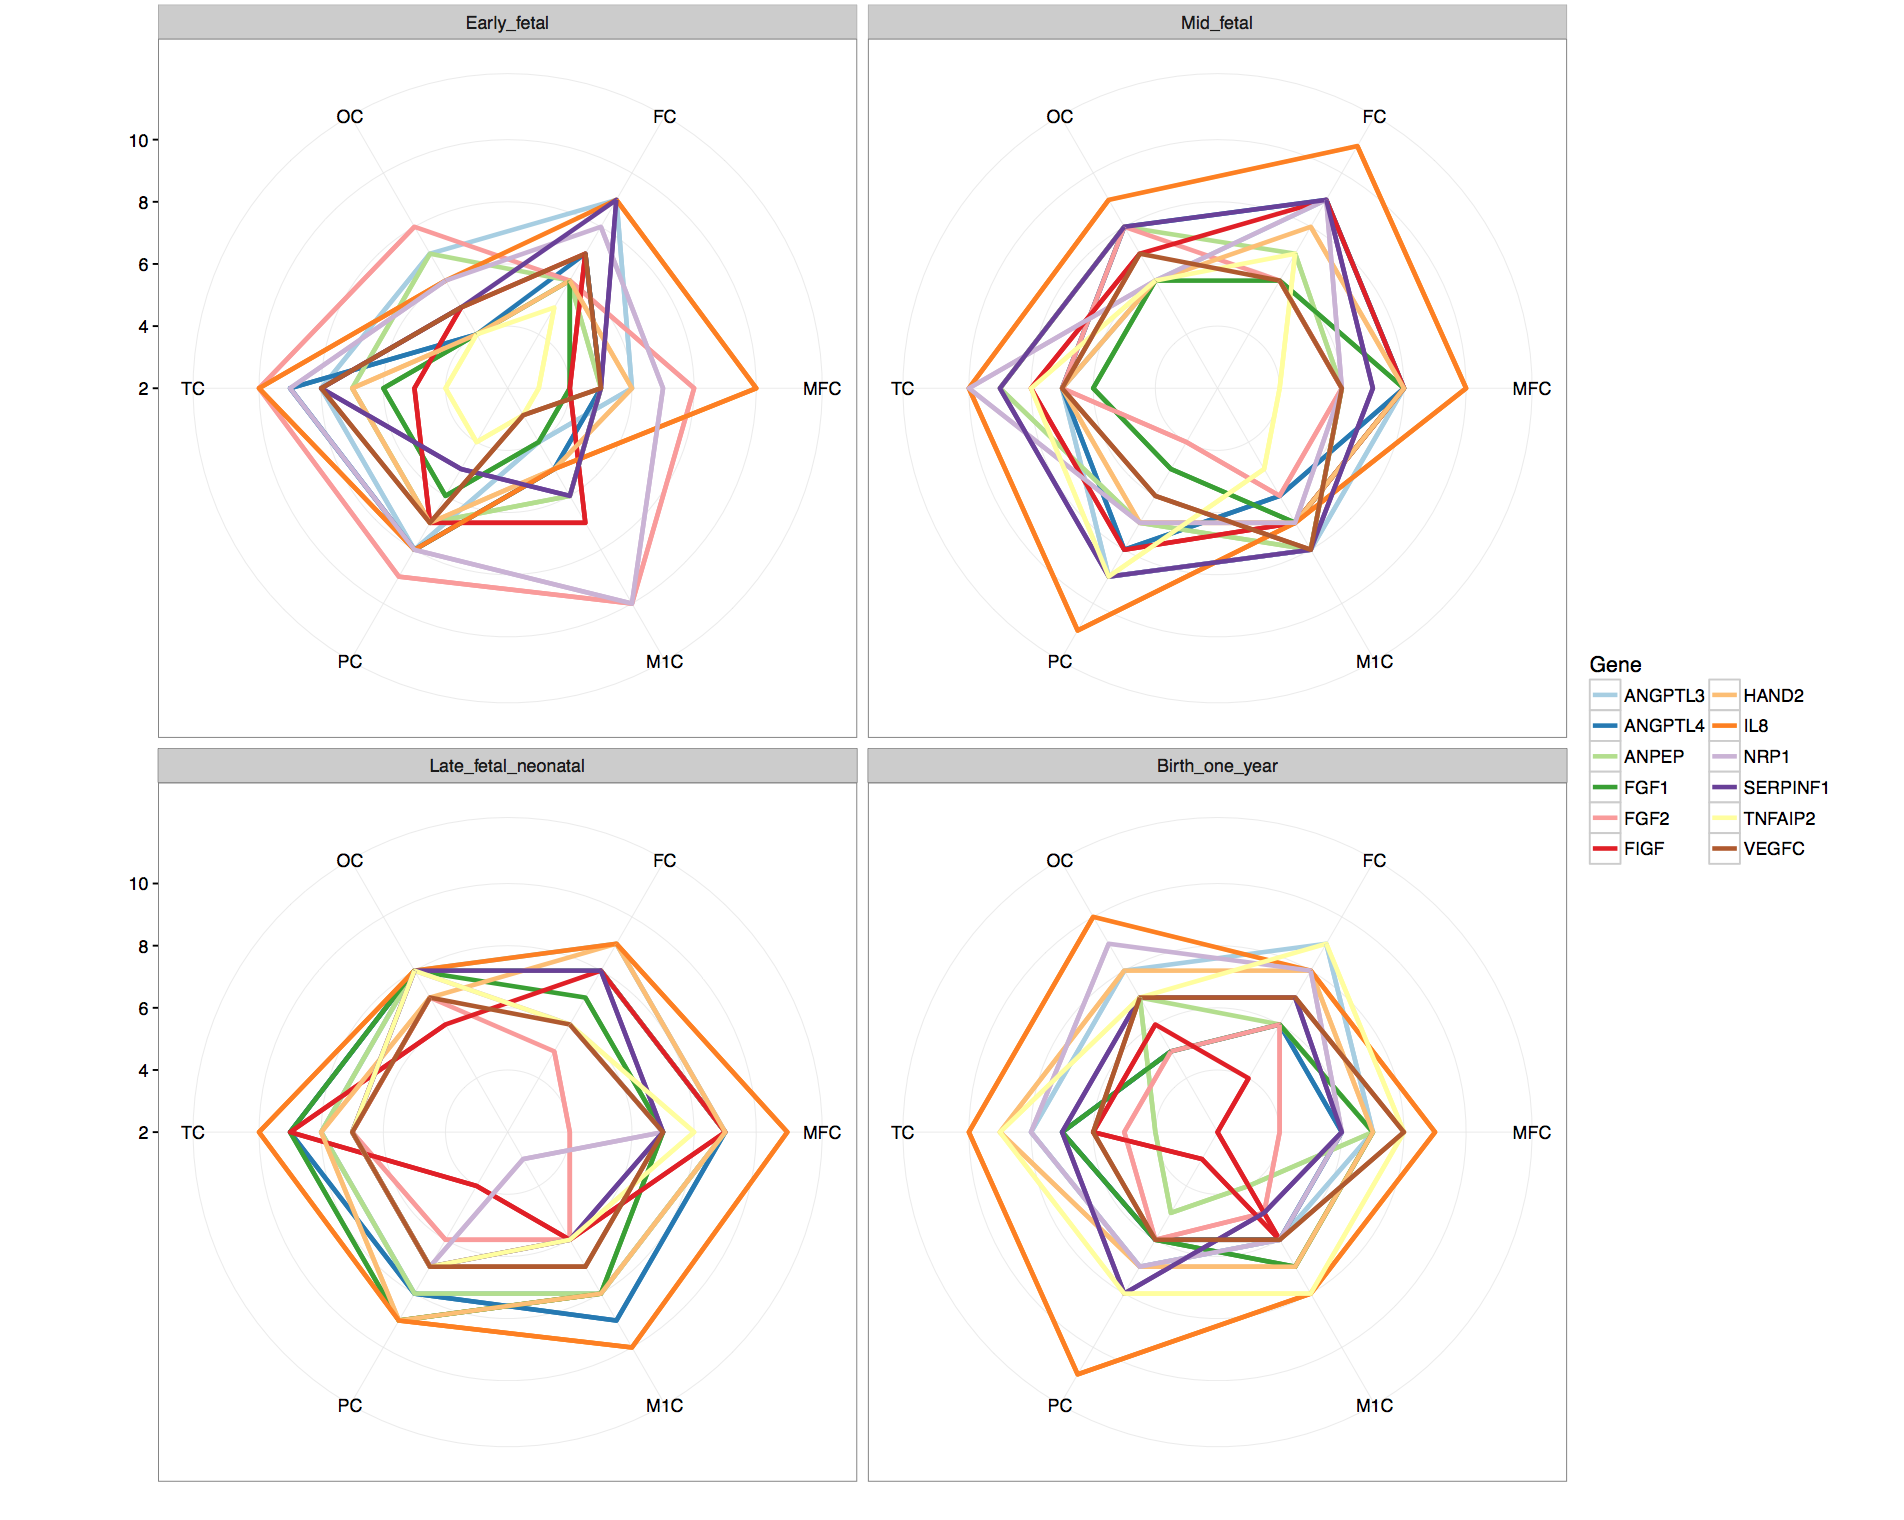
Genetic dataset: We used publicly available data on gene expression during prenatal human brain development (https://www.brainspan.org). Eleven regions of the neocortical gene expression patterns were selected according to anatomical vascular territories. The periods were divided into early (8-13PCWs), mid (13-19PCWs), late-fetal (19-38PCWs) and neonatal (birth to 1year). For each period and for each region we constructed an association network in which nodes represented genes and two genes are connected if the partial correlation between their gene expression values (in that specific region and period) is significantly different from zero. The gene association networks were estimated using the SIMONE package in R. The 44 association networks were used to study the evolution of most important genes. After computing node degrees in each network, a gene is considered as important if its node degree is larger than the 95% quantile of all node degrees (in all 44 networks) in more than one region or period. We studied the longitudinal evolution and spatial distribution of the nodal degrees for each gene in each period.rs-fMRI dataset: rs-fMRI data of 38 preterm newborns at 33 post-conceptional weeks (PCWs) and 52 preterm and full-term newborns at 40 PCWs were acquired at University Hospital of Geneva: these timepoints correspond to the late-fetal and neonatal genetic periods, respectively. An EPI sequence (TR=700ms, Siemens 3T Prisma Magnetom scanner) was used resulting in 590 volumes/subject. For each subject, the functional data were realigned and co-registered to the T2 using SPM12. Volumes with a frame-wise displacement (FD)>0.5mm were removed, along with the previous and two subsequent images. Subjects with more than 1/3 of motion-affected volumes were excluded. The UNC neonatal atlas4 (90 regions) was registered to each subject’s T2-space using Advanced-Normalization-Tools5. The deformation field was applied to the atlas Gray/White/CSF tissues (TMPs) and to the atlas image to bring them into the T2 space. Using these TPMs, the subject’s T2 is segmented and the subject-specific probability maps were obtained. GM voxel signals were extracted by masking the atlas using the GM TPM obtained by the segmentation, and by reslicing it to the functional space. Average regional BOLD time-courses were extracted for each subject. Finally, the FC of each subject was constructed based on the accordance measure6 that captures coupling between brain regions, resulting in a 90x90 connectome. For each subject, a weighted, undirected graph was constructed. The nodal strength was computed for all 90 nodes and averaged according to the correspondence between these regions and the 11 genetic regions resulting in 11 strength measures per subject (Figure 1). These measures were averaged across subjects for each timepoint (Figure 2) and the delta change neonate vs late-fetal was calculated (functional maturation, Figure 3).
Results
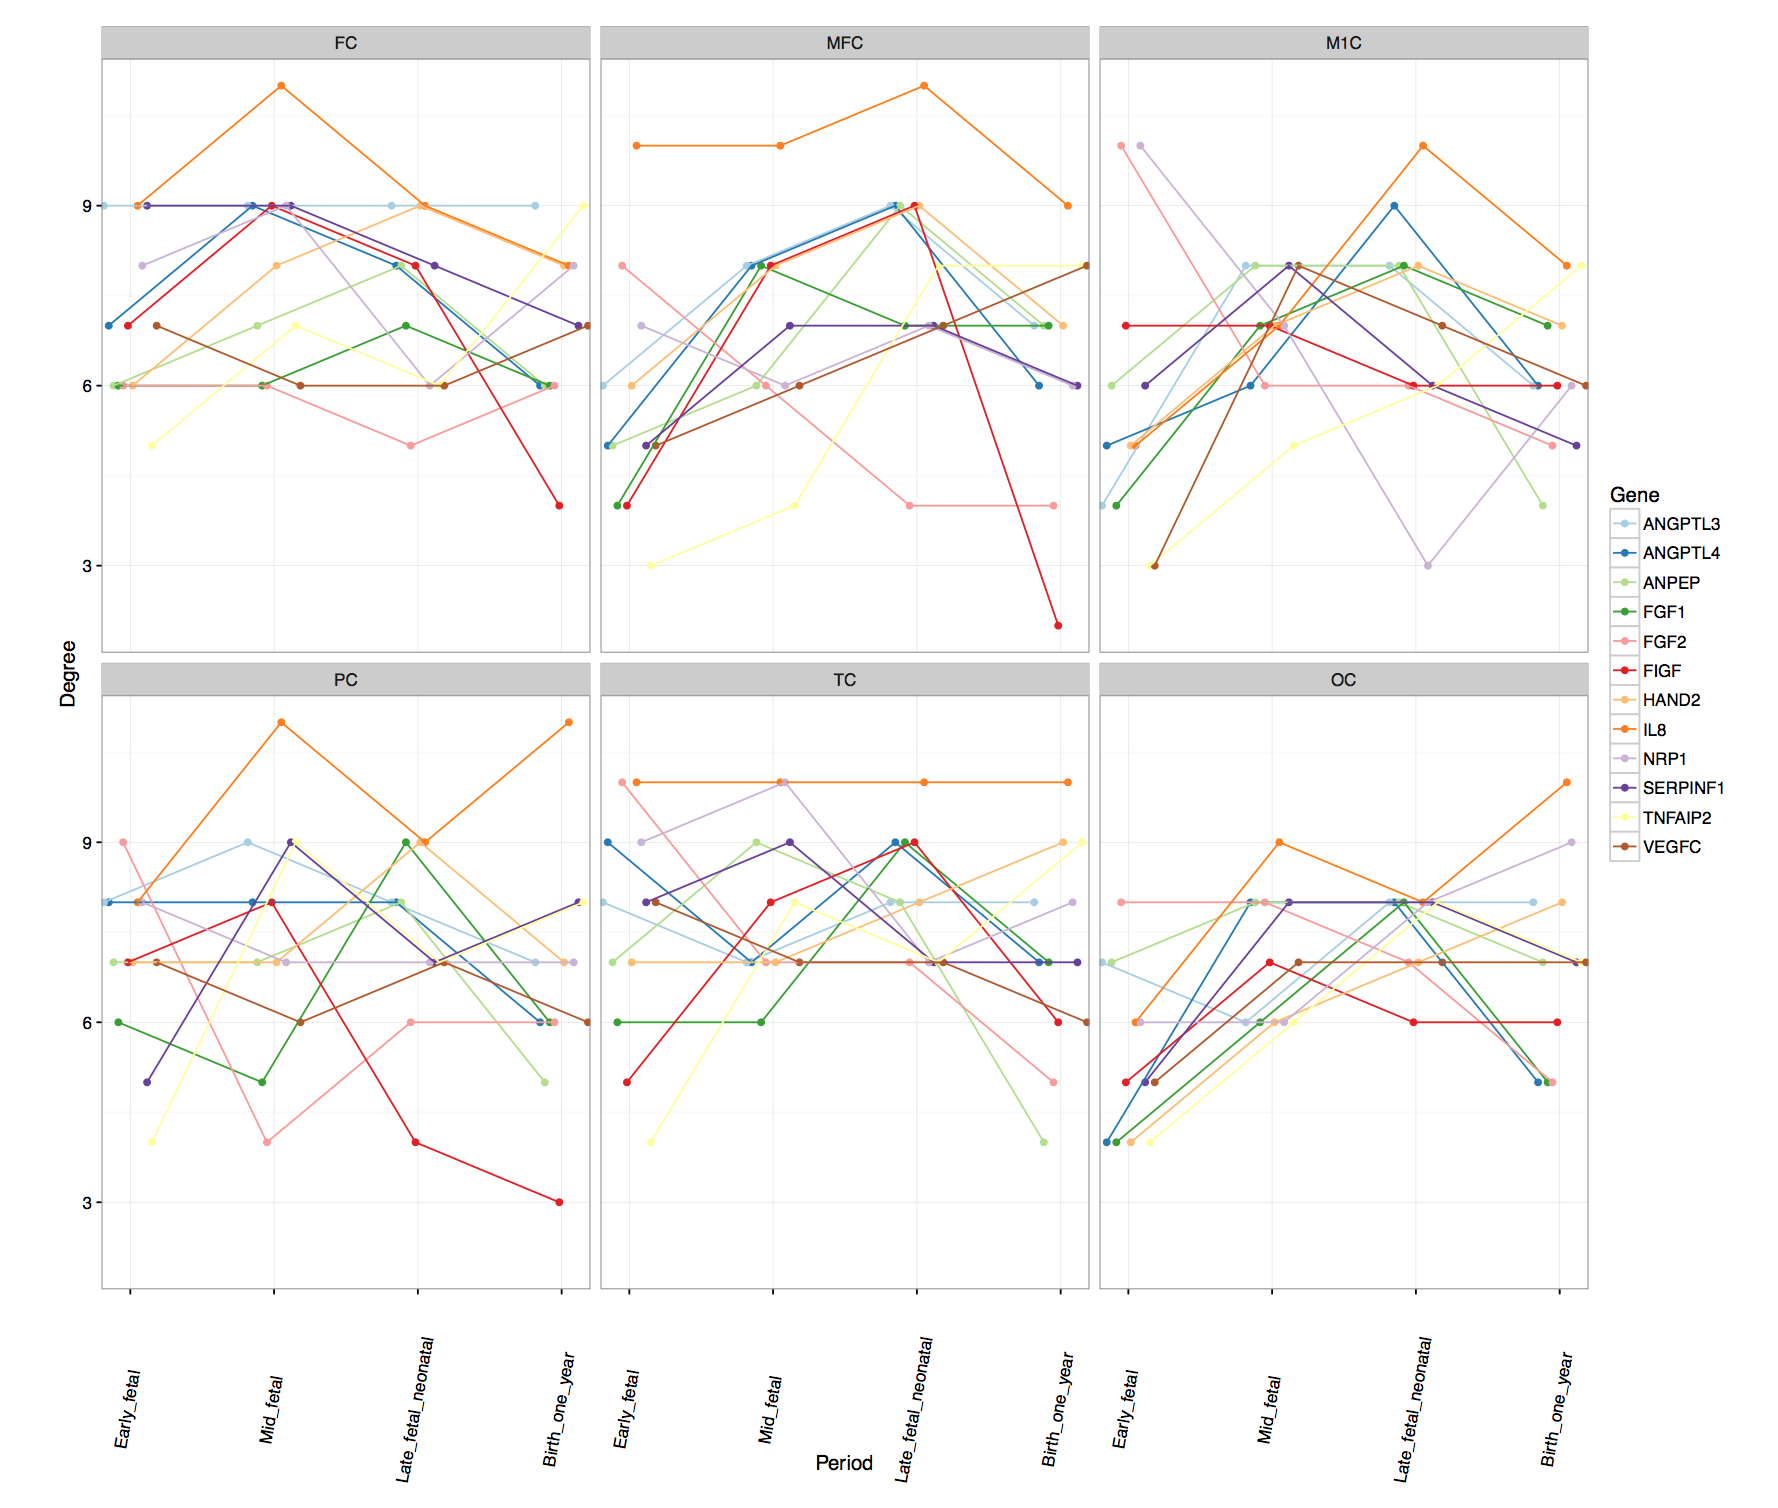
rs-fMRI results: Regional and temporal differences of the nodal strengths are found in the rs-fMRI data (Figure 2-3). For both late-fetal and neonatal periods, the highest average nodal strengths are in the primary somatosensory and posterior superior temporal cortices. Regarding longitudinal resting-state activity pattern modification, from 33 weeks to term age there is a higher increase of functional connectivity mainly in the primary motor and primary somatosensory cortices, translating the increasing importance of primary sensori-motor areas connectivity during brain development.Genetic results: Angiogenic-genes expression varies across the different periods and brain regions. Regional differences at each time point regarding gene nodal degree are illustrated in Figure 4, while longitudinal changes for each brain region in Figure 5. From early-fetal to late-fetal period, there is an increase of nodal degree of the most common angiogenic growth factors genes, comprising VEGF, FGF1, angiopoietins (ANGPTL3, ANGPTL4) and TNFAIP2, in line with the important brain growth and vascular development until birth. Il-8, which also holds a role in neovascularization, was the gene with consistently highest nodal degree in most of the brain regions in mid-fetal, late fetal and neonatal periods. Up to late-fetal period, in primary motor cortex there is an increase of FGF1, ANGPTL3, VEGFC, IL-8 and TNFAIP2 expression, while in the parietal cortex of FGF1, VEGF, FGF2 and IL-8 angiogenic factors, which might precede and explain the augmentation in rs-connectivity in these regions.
Discussion / Conclusion
Different patterns of angiogenesis related gene co-expressions drive regional and temporal differences in cortical angiogenesis, which might contribute to the changes observed in rs-fMRI patterns. The rs-fMRI results highlight the increasing role of the primary somatosensory and motor cortices during the late-fetal and neonatal period, what might be related to an increased expression of important angiogenic factors in these regions preceding the rs-connectivity alterations. Our results indicate spatio-temporal differences in vascular development related to gene expression in neocortical areas during early brain development.Acknowledgements
No acknowledgement found.References
1. Buxton RB, Uludag K, Dubowitz DJ, Liu TT. Modeling the hemodynamic response to brain activation. Neuroimage 2004; 23: S220-S33.
2. Smyser CD, Inder TE, Shimony JS, et al. Longitudinal analysis of neural network development in preterm infants. Cereb Cortex 2010; 20(12): 2852-62.
3. Kang HJ, Kawasawa YI, Cheng F, et al. Spatio-temporal transcriptome of the human brain. Nature 2011; 478(7370): 483-9.
4. Shi F, Yap PT, Wu GR, et al. Infant Brain Atlases from Neonates to 1-and 2-Year-Olds. Plos One 2011; 6(4).
5. Avants BB, Tustison NJ, Song G, Cook PA, Klein A, Gee JC. A reproducible evaluation of ANTs similarity metric performance in brain image registration. Neuroimage 2011; 54(3): 2033-44.
6. Meskaldji D, Morgenthaler S, and Van De Ville D. New measures of brain functional connectivity by temporal analysis of extreme events. IEEE 12th International Symposium on Biomedical Imaging (ISBI), 2015.
Figures