4585
Mapping the spatiotemporal developmental pattern of the cortex and its adjacent white matter for preterm neonates using MRI1USC Stevens Neuroimaging and Informatics Institute, Keck School of Medicine of USC, University of Southern California, Los Angeles, CA, United States, 2University of California, San Francisco, San Francisco, CA, United States, 3USC Stevens Neuroimaging and Informatics Institute as department, Keck School of Medicine of USC, University of Southern California, Los Angeles, CA, United States
Synopsis
Myelination is essential for normal brain function. The development of myelin begins in the third trimester of pregnancy and enables rapid synchronized communication between different brain regions. During the 3rd trimester of gestation overlapping with preterm birth, the neurodevelopment undergoes intensive cyto and myeloarchitecture changes. The T1/T2 ratio is a surrogate for the degree of myelination but has not been used to study early neurodevelopment. Using T1/T2 ratio, we show the unique spatiotemporal pattern of the cyto and myeloarchitecture changes in preterm neonates. This result may be useful in prediction of neurodevelopmental outcome and functional impairments in preterm survivors.
Background and Purpose
In third trimester of gestation, the neurodevelopment underwent intensive cyto and myeloarchitecture changes including neural apoptosis, dendrites development, pre-myelination and myelination in the cortex and underlying WM1. Understanding of these changes in this early developmental period is crucial because this period largely overlaps with preterm birth and the occurrence of prematurity-related brain injury which may disrupt the normal neurodevelopment, subsequently resulting in cognitive or neuromotor impairment. Descriptive properties of T1 / T2 ratios measured using T1 weighted and T2-weighted MRI are of particular interest in the preterm population because they can infer information about tissue composition, such as macromolecule composition, water content and lipid and map the myelin maturation2. Several myelin-specific studies have described serial quantitative measures by using MRI and diffusion imaging in various cohorts from very preterm to healthy human infants2 3. Although these studies identified the microstructure of the tissue and serve as markers of axonal maturation, they found myelination changes in an only limited number of gray and white matter regions in the very preterm brain. In the current study, using very/extremely preterm neonates, we leveraged spatiotemporal T1/T2 ratio changes to demonstrate nonlinear changes of cyto- and myeloarchitecture.Methods
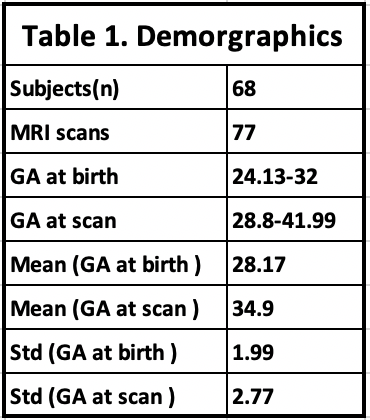
Our dataset comprised 68 preterm infants (table 1). These infants underwent 77 MR scanning as soon as they were clinically stable and before discharge from the hospital (postmenstrual age (PMA): 28-41 weeks). T1-weighted (T1w) and T2-weighted (T2w) images were acquired using a 3-Tesla system (spatial resolution: 0.7x0.7x1 mm3 for T1w, 0.4x0.4x2mm3 for T2w). T1w and T2w images were denoised to enhance the images against motion artifacts, and masked. Three types of brain tissues (GM, WM, and CSF) were then segmented using joint label fusion method on T1w images. Next, the cortical surfaces of neonates were extracted from the segmentation using NEOCIVET pipeline4 5. The T2w images was then registered to the pre-processed T1w image with a rigid registration. Then, T1/T2 intensity ratio were sampled on the cortical surface (=surface placed middle between GM/WM and GM/CSF borders) and the superficial white matter surface (= surface 2mm below the GM/WM border), which were triangulated with 81,924 vertices (163,840 polygons). These features were further re-sampled to the surface template using the transformation obtained in the surface registration, to allow inter-subject comparison. We used poly2 models as it best characterized the nonlinear trajectory of T1/T2 ratio changes in relation to PMA, resulting in the least fitting error.Results
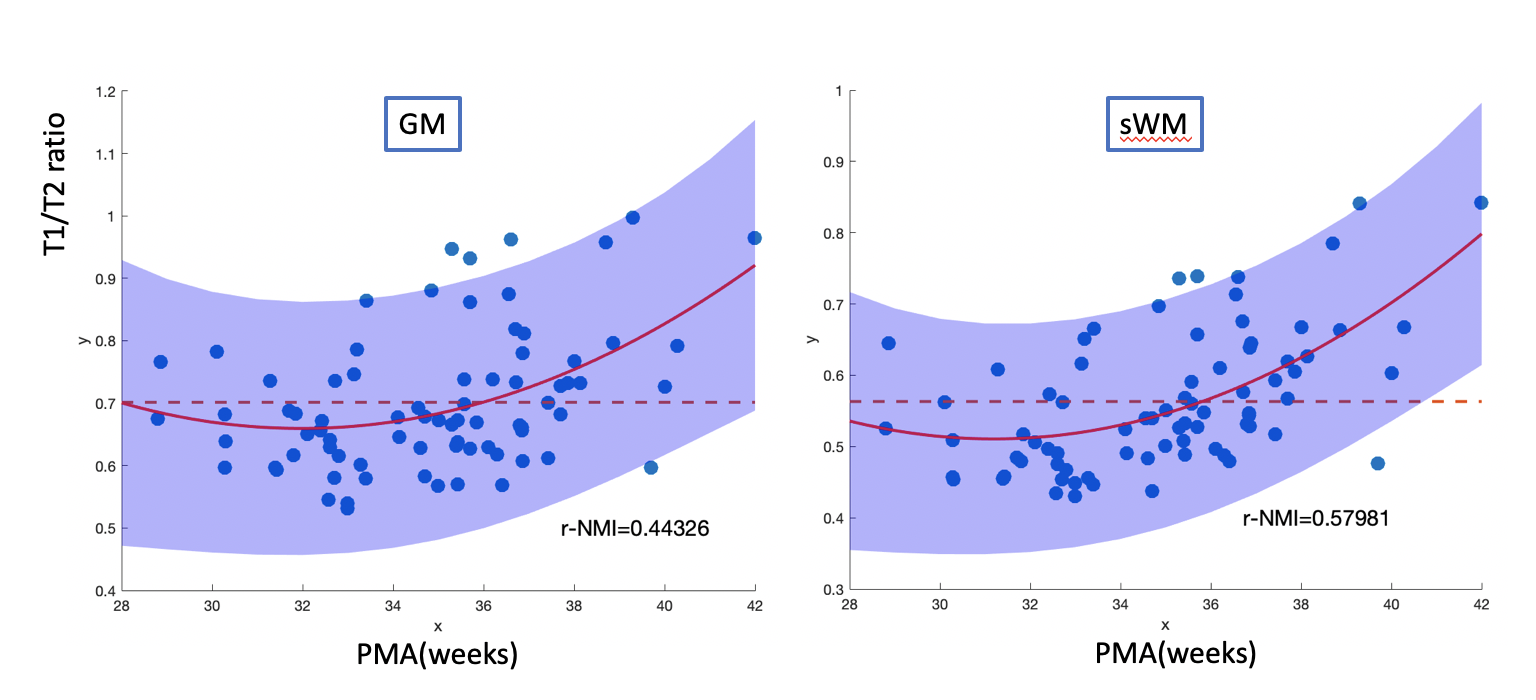
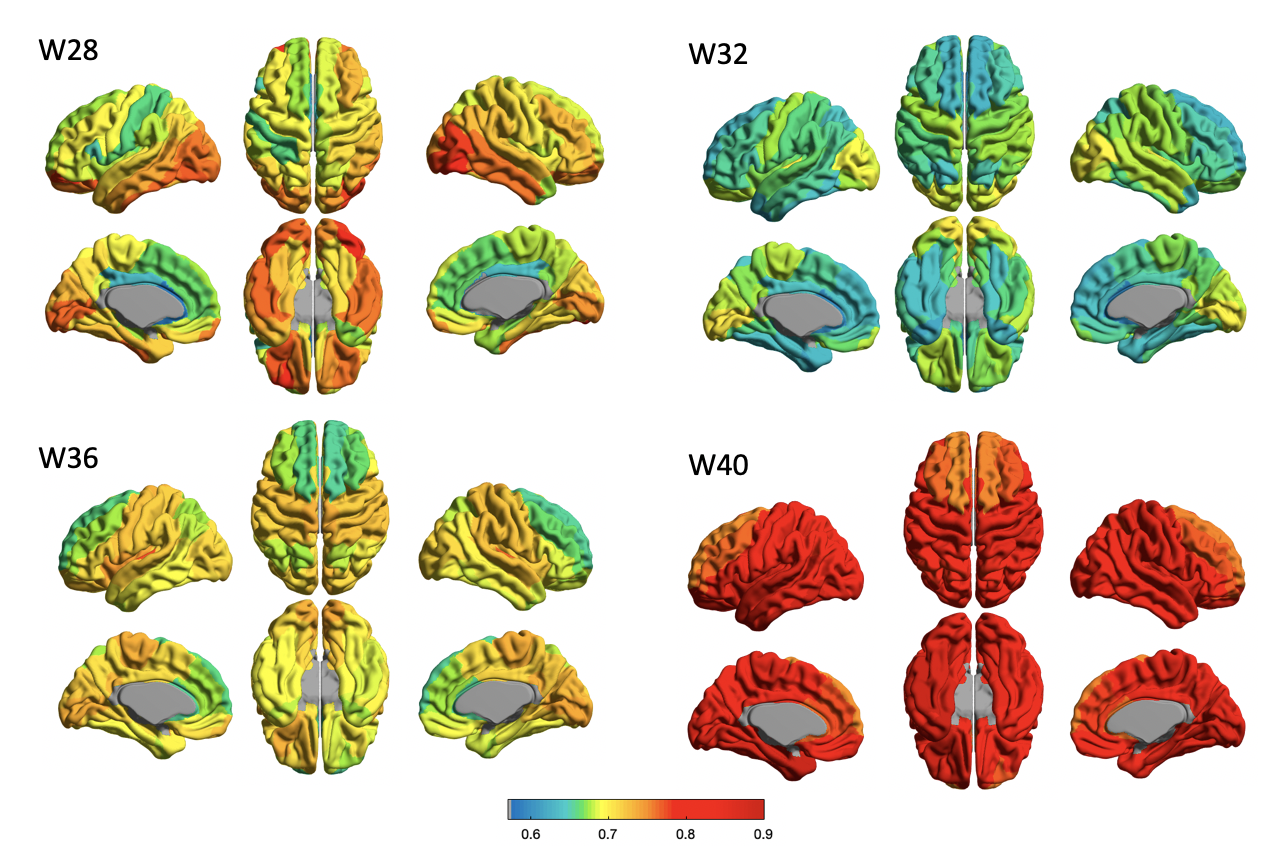
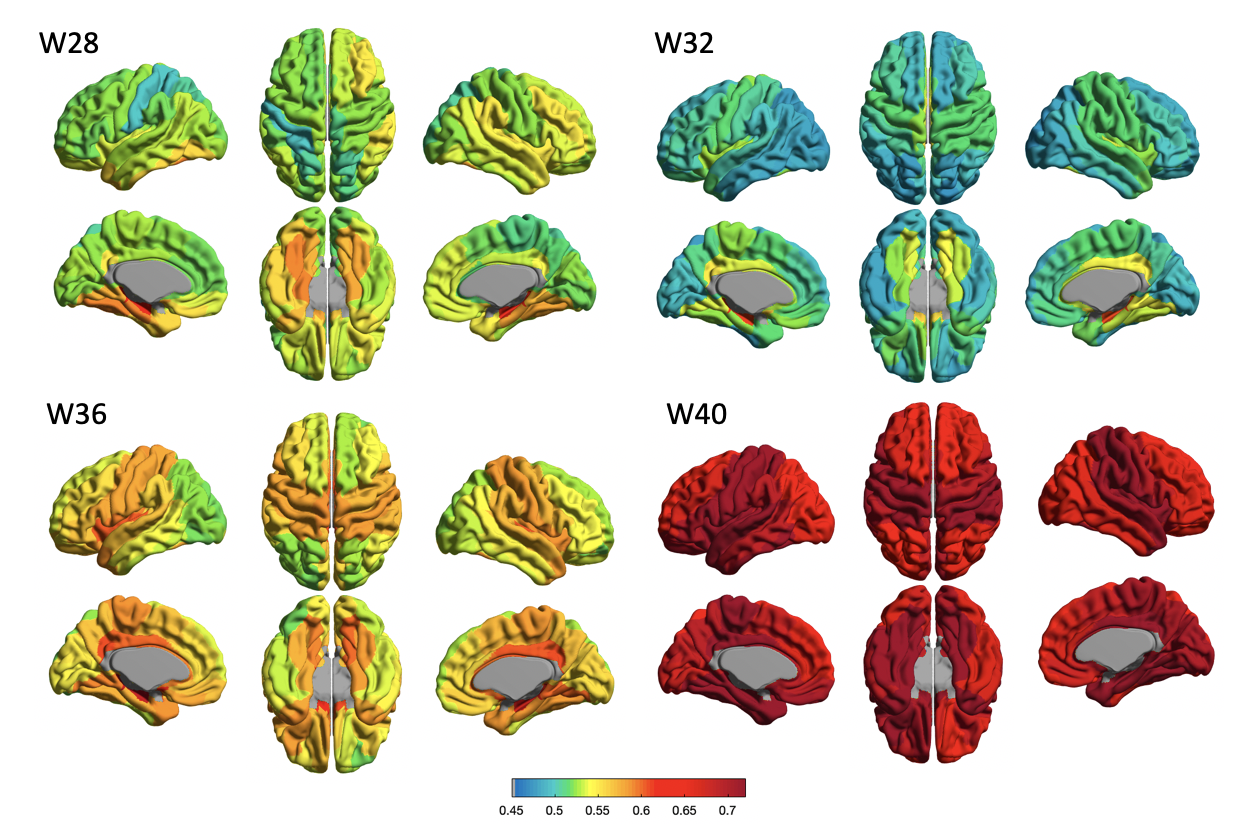
For the mid-cortical surface, the Poly2 model fitted to mean T1/T2 ratio and PMA presents a developmental trajectory with a declined T1/T2 ratio along with PMA until 32 gestational week (GW) and an increase after 32 GW. This may indicate the rapid transition from a state of pre-myelination process6 to that of early myelination. The Poly2 model was also fitted to each of T1/T2 ratio values measured in 23 cortical regions of interest. All cortical regions showed a similar “U-shape” developmental trajectory with significant effects (Fig 1. r>0.44; p < 0.0001). We analyzed the temporo-spatial pattern of T1/T2 ratio changes over PMA by visualizing each region’s fitted T1/T2 value at 28, 32, 36, and 40 weeks; Fig 2). For the superficial WM (sWM), we observed that WM started myelination earlier than GM (Fig 3.), seeing the same U-shape trajectory (table 2, mean PMA 30.82 weeks vs. 32.21 weeks). Both GM and sWM exhibited more rapid development in the central and temporal cortices, and slower development in occipital and frontal cortices. In GM, the frontal cortex showed the latest development.Discussion & Conclusion
The ‘U shape’ developmental trajectory of T1/T2 ratio for early in vivo brain maturation has not been demonstrated previously and will require further studies to confirm and verify. The changes in T1/T2 ratio during this early period of brain development has shown that there are significant T1 and T2 changes which result from increased structural organization across all regions of the brain and potential myelin development in the white matter. The T1/T2 increases after 32 weeks found in our study may indicate the lipid signal increase related to membrane turnover, potentially indicating myelination.Acknowledgements
No acknowledgement found.References
1. Rakic, S. and N. Zecevic, Programmed cell death in the developing human telencephalon. Eur J Neurosci, 2000. 12(8): p. 2721-34.
2. Schneider, J., et al., Evolution of T1 Relaxation, ADC, and Fractional Anisotropy during Early Brain Maturation: A Serial Imaging Study on Preterm Infants. AJNR Am J Neuroradiol, 2016. 37(1): p. 155-62. 3. Counsell, S.J., et al., MR imaging assessment of myelination in the very preterm brain. American Journal of Neuroradiology, 2002. 23(5): p. 872-881.
4. Kim, H., et al., NEOCIVET: Towards accurate morphometry of neonatal gyrification and clinical applications in preterm newborns. Neuroimage, 2016. 138: p. 28-42.
5. Liu, M., et al. A Skeleton and Deformation Based Model for Neonatal Pial Surface Reconstruction in Preterm Newborns. in 2019 IEEE 16th International Symposium on Biomedical Imaging (ISBI 2019). 2019. IEEE.
6. Barateiro, A. and A. Fernandes, Temporal oligodendrocyte lineage progression: in vitro models of proliferation, differentiation and myelination. Biochim Biophys Acta, 2014. 1843(9): p. 1917-29.
Figures