4582
Preliminary Study on Quantitative Assessment of Fetal Brain Using MOLLI T1 Mapping Sequence1West China Second University Hospital, Sichuan University, Chengdu, China, 2Key Laboratory of Birth Defects and Related Diseases of Women and Children (Sichuan University), Ministry of Education, Chengdu, China, 3West China Second University Hospital, Chengdu, China, 4MR Collaborations, Siemens Healthineers Ltd., Shanghai, China, 5MR Scientific Marketing, Siemens Healthineers Ltd., Xian, China
Synopsis
A modified Look-Locker inversion recovery T1 mapping technique was used to study the development of fetal brain. Our study found the MOLLI sequence with a short scan time could reduce the impact of fetal brain movements and perform robust T1 measurements. T1 values differ in brain regions and gestational weeks (from 24 to 36). A negative correlation was found between T1 values and gestational age in thalamus, posterior limb and brain stem. Therefore, T1 measured by the MOLLI sequence could be used as a biomarker for evaluating fetal brain development.
Purpose
T1 relaxation time provides a more quantitative biomarker than traditional T1 weighted images for disease progression. 1 T1 relaxation time has been reported as a tool to assess developmental status during brain development for children (3 months through 60 months in age). 2 However, fetal brain imaging suffers from unexpected fetal motion during the scan which put higher request towards the MR T1 mapping technique. The scan time of the conventional acquisition sequence used for brain T1 mapping is a bit long, which is unavoidably affected by fetal motion. A modified Look-Locker inversion recovery (MOLLI) T1 mapping sequence is commonly used in cardiac T1 mapping imaging with a quite fast readout scheme that partly conquers the motion artifact during the scan. Therefore, it might also be suitable for the T1 mapping imaging of fetal brain. In this work, we optimized the MOLLI sequence for the fetal brain development study. 3 T1 values of the fetal brain were measured in several chosen ROIs, and their correlations with gestational age were also calculated.Material and methods
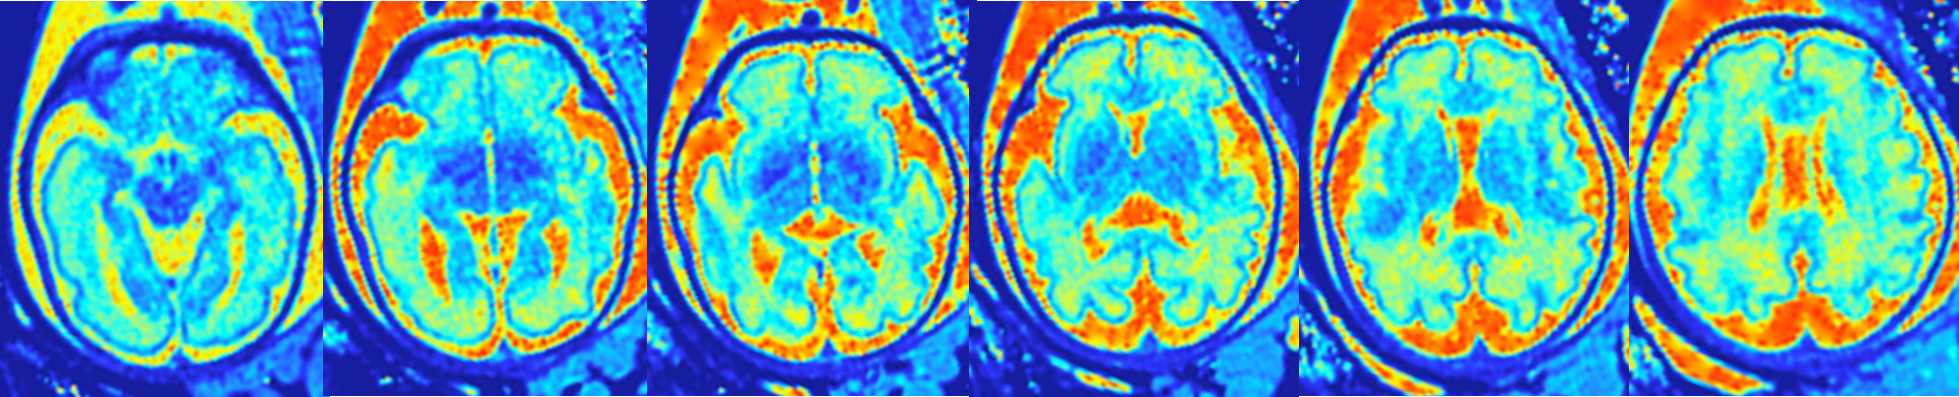
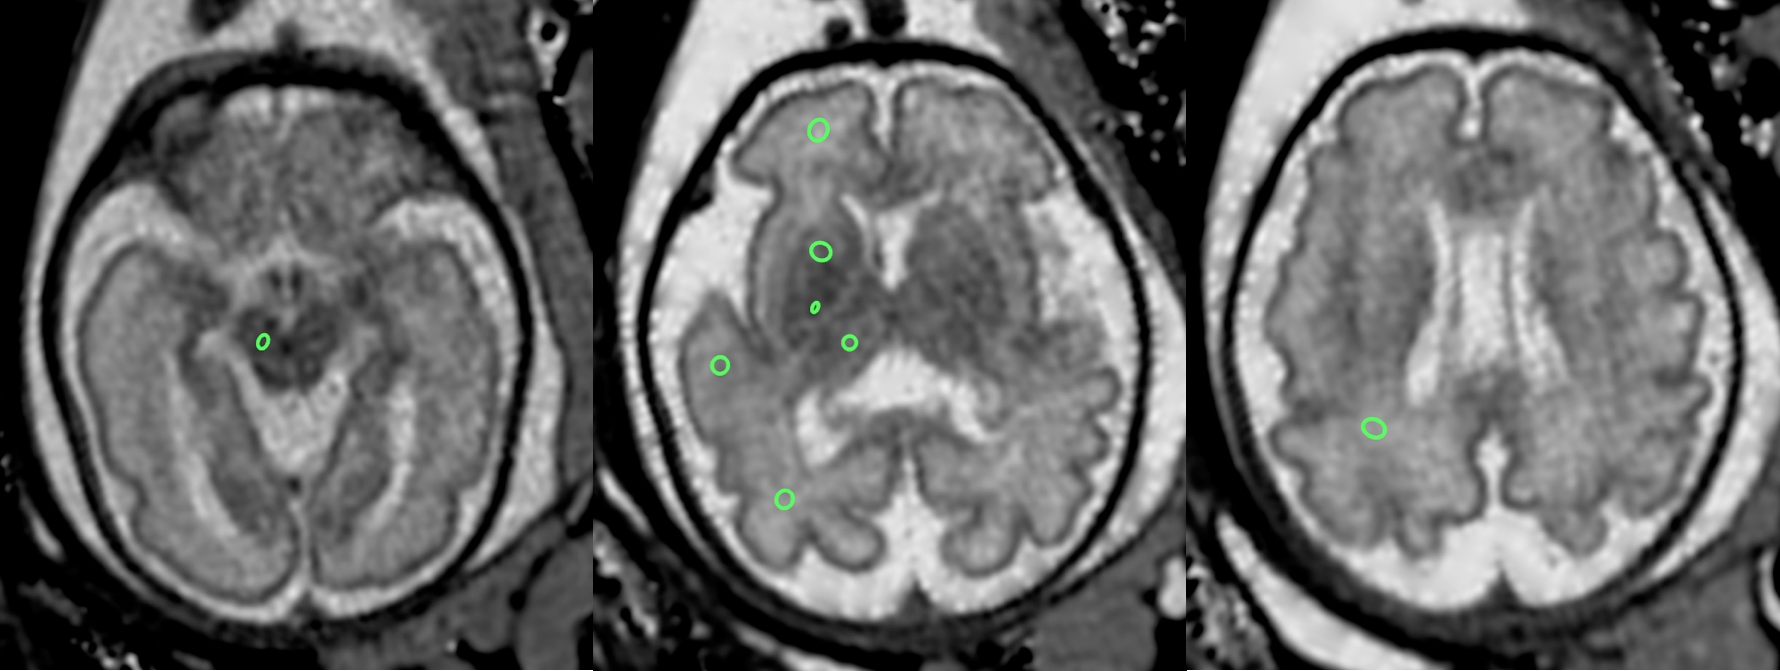
In this study, 31 fetuses under mid-late pregnancy (from 24 weeks gestation to 36 weeks gestation) were enrolled. The experiments were performed on a 3T MR Scanner (MAGNETOM Skyra, Siemens Healthcare, Erlangen, Germany). The T1 mapping of fetal brains were quantified using a MOLLI sequence with a virtual ECG gating of 800ms R-R interval and a 7b(3b)3b acquisition scheme to allow the full recovery of long T1 tissues. Thus, ten images with different T1 recovery time were acquired. Imaging parameters were: TR / TE = 2.5 / 1.7 ms, FOV = 300 x 300 mm2, resolution = 1.2 x 1.2 mm3, slice thickness = 3 mm, and total acquisition time = 1: 05 min for 6 slices. The fetuses were divided into two groups: middle pregnancy group (24-28 weeks, 11 cases), and late pregnancy group (> 28 weeks, 20 cases). T1 values were measured from the selected region of interests (ROIs) using OsiriX imaging software (Pixmeo, Geneva, Switzerland). The chosen ROIs shown in Figure 1 were including each brain lobe white matter, basal ganglia, and important initial myelination areas, such as the posterior limb of the internal capsule, the thalamus (the ventrolateral nucleus), the brainstem and other areas.Results
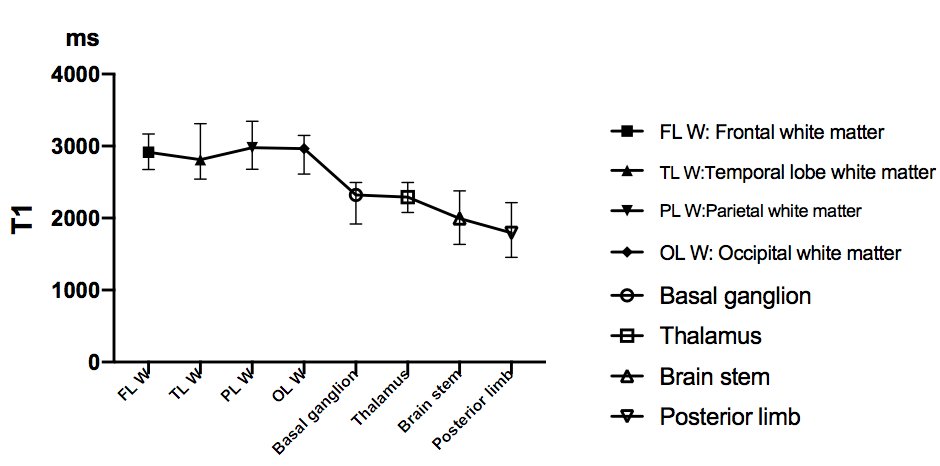
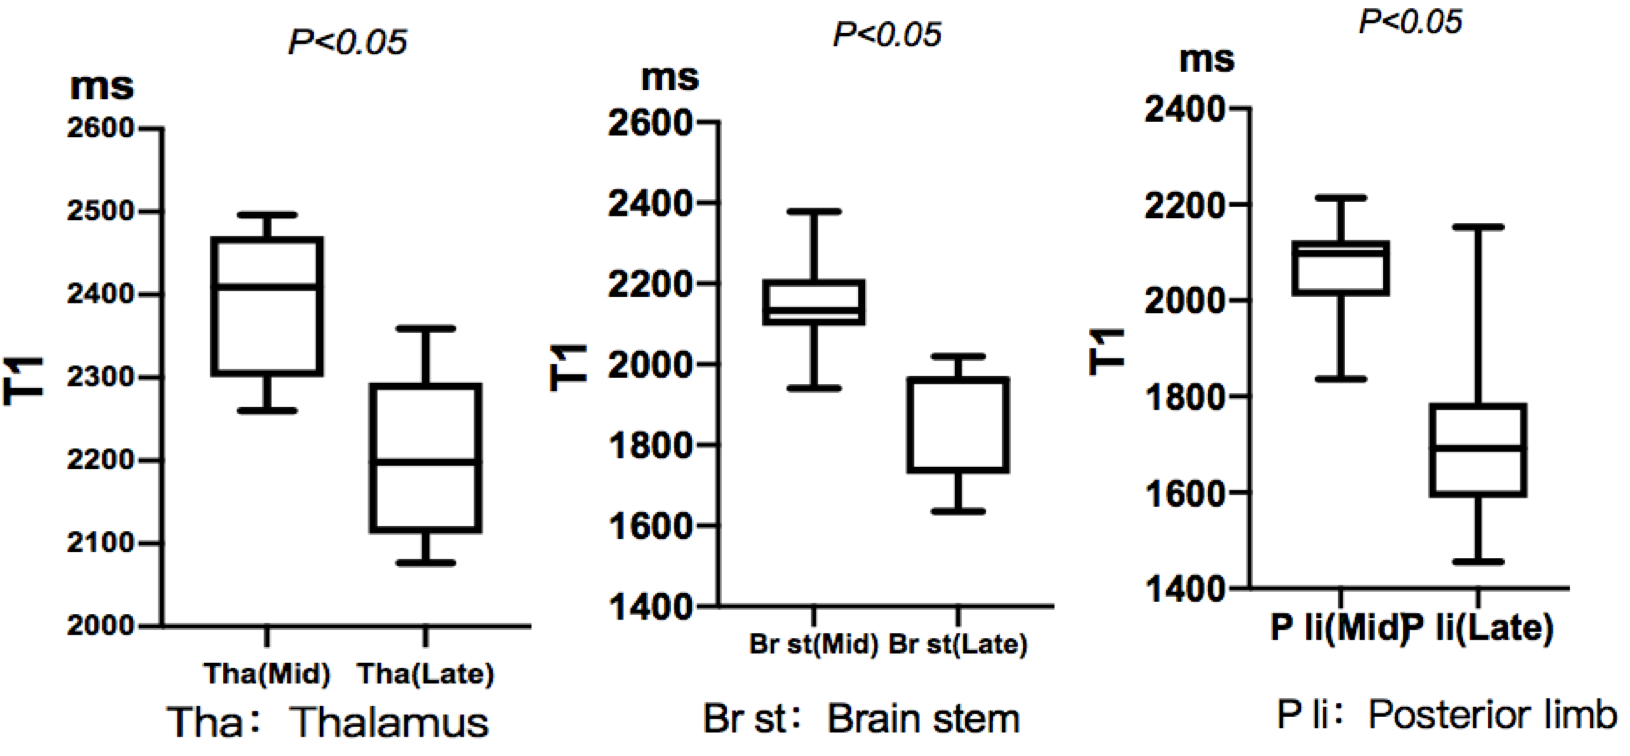
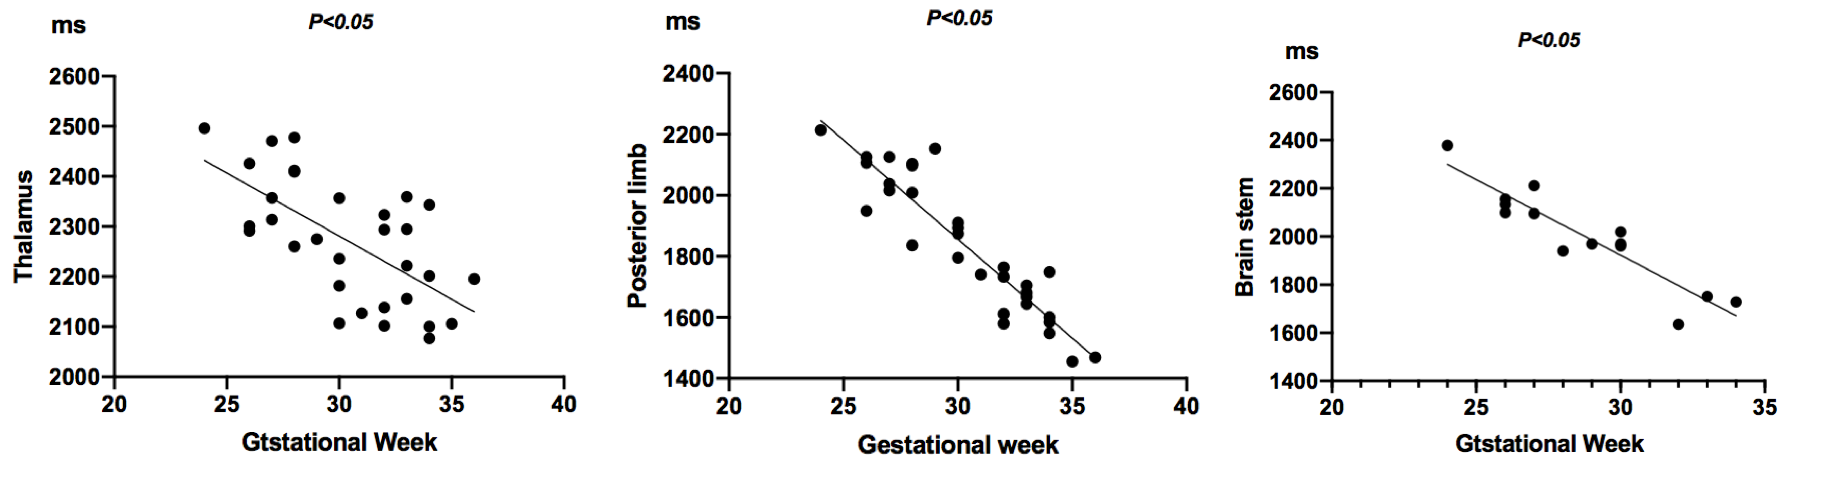
T1 values in different brain regions are compared and shown in Figure 3. T1 varies from about 2000 ms to 3000 ms among different regions, i.e., thalamic (2271±123.1 ms, P < 0.001), the parietal white matter (2962±139.7 ms,P < 0.001), and the occipital white matter (2951±129.4ms, P = 0.741). There is a downward trend in white matter to gray matter nuclei. The relationship between T1 values and gestational weeks are shown in Figure 4 and 5. Significant differences are found in the T1 value between middle- and late- pregnancy group in thalamus, posterior limb, and brain stem (P<0.05). The averaged T1 values also show a negative correlation with gestational weeks in thalamus, posterior limb, and brain stem. F values were 21.07, 67.73, 166.8 (P<0.001). While, no significant correlation is found in the frontal lobe (P=0.157), occipital lobe (P=0.057), and basal ganglia (P=0.309).Discussion
This study found that the optimized MOLLI sequence could be used to measure the T1 value of fetal brain tissue. The scan time for each slice is short making it more robust to motion artifacts. To get rid of the partial recovery effect for fetal brain tissues with long T1, we used a 7-3-3 acquisition pattern in MOLLI. Because T1 in the fetal brain is longer than the new born. 4 The recovery time for the volume inversion pulse is 8000 ms, which is enough to allow fully recovery of the longitudinal magnetizations. In this work, the measured T1 values of different brain regions are found different, especially at white matter and deep gray matter nuclei in the middle- and late- pregnancy, there is a negative correlation between the gestational ages with T1 values, especially in the brain region where the myelinated tissue occurs firstly. The T1 values show a decreasing process with the growth of gestational age, which is consistent with the developmental process of myelination.Conclusion
The quantitative function of fetal brain tissue can be achieved using the MOLLI sequence. The myelination process of the fetus can be reflected using the quantitative T1 values. It would be a useful biomarker for the diagnosis of fetal diseases and structural development using MRI.Acknowledgements
No acknowledgement found.References
1. Deoni SC, Dean DC, O'Muircheartaigh J,et al. Investigating white matter development in infancy and early childhood using myelin water faction and relaxation time mappingt[J]. Neuroimage. 2012 Nov 15;63(3):1038-53.
2. Girard N, Raybaud C, Poncet M. In vivo MR study of brain maturation in normal fetuses[J].AJNR Am J Neuroradiol. 1995 Feb;16(2):407-13.
3. Catherine Gare.MRI of the Fetal Brain: Normal Development and Cerebral Pathologies[M].Springer-Verlag Berlin Heidelberg,2004.
4. Harkins KD, Xu J1,2, Dula AN, et al.The Microstructural Correlates of T1 in White Matter. Magn Reson Med. 2016 Mar;75(3):1341-5.
Figures