4569
Mono-exponential bi-exponential and stretched-exponential diffusion imaging in characterization of nonalcoholic fatty liver disease
Xianfu Luo1, Jing Ye1, Weiqiang Dou2, Jun Sun1, and Wei Xia1
1Radiology, Clinical Medical School of Yangzhou University, Northern Jiangsu People’s Hospital, Yangzhou, China, 2GE Healthcare,MR Research China, Beijing, China
1Radiology, Clinical Medical School of Yangzhou University, Northern Jiangsu People’s Hospital, Yangzhou, China, 2GE Healthcare,MR Research China, Beijing, China
Synopsis
We aimed to compare mono-exponential bi-exponential and stretched-exponential diffusion-weighted imaging(DWI) model in characterizing nonalcoholic liver disease (NAFLD) by providing multiple quantitative parameters. The diagnosis performance for early detection nonalcoholic steatohepatitis (NASH) was compared using characteristic operating curve analysis. Stretched-exponential DWI performed as well as bi-exponential DWI and better than mono-exponential DWI in the noninvasive characterization of NAFLD severity.
Introduction
Nonalcoholic fatty liver disease (NAFLD) is ranging from simple steatosis to steatohepatitis. Nonalcoholic steatohepatitis (NASH) is a potentially serious form of NAFLD in which an inflammatory response to steatosis damages the liver with a 20-50% risk of developing fibrosis and cirrhosis, even hepatic carcinoma . Previous studies have reported that ADC has an inverse relationship with hepatic fat content1. While ADC, obtained from a mono-exponential model, reflects water molecular diffusion by assuming a Gaussian-distribution. The bi-exponential and stretched-exponential model, making no assumption regarding tissue compartmentalization, may have additional potential in the analysis of steatohepatitis2-3. So far, to our knowledge, no study has compared the mono-exponential bi-exponential and stretched-exponential model in the severity assessment of NAFLD. Therefore, in this study, we aimed to investigate the feasibility and accuracy of the mono-exponential bi-exponential and stretched-exponential model in early diagnosis of NASH.Materials and Methods
Animal modelThirty-five male 8-week-old New Zealand rabbits (Ca. 1800g) were randomly divided into five group as follows: Group 1 (n=7) standard diet; Groups 2-5 were fed high-fat/cholesterol diet(including seven with high fat diet for 1 week, seven with high fat diet for 3 weeks, seven with high fat diet for 4 weeks and eight with high fat diet for 8 weeks). The weight of chow was restricted to 100 g/rabbit per-day.
MR acquisition
All MR scanning were performed on a 3.0 T clinical scanner (Discovery 750w, GE Healthcare, USA). A 16-chanels surface-coil (GEM-flex) was wrapped on the abdomen of rabbit. Diffusion weighted imaging technique with twelve b-values (0, 25, 50, 75, 100, 150, 200, 300, 400, 500, 600, 800sec/mm2) was employed for liver imaging, in which scan repetitions were 4 for b-values between 0 and 100sec/mm2 and between 500 and 600sec/mm2, were 2 for b-values between 100 and 400sec/mm2, and were 8 for b-value of 800sec/mm2. Other scan parameters were of repetition time/echo time 2500/77.4ms, FOV 15.0cm×10.0cm, matrix 128×128, slice thickness 3.0mm. The acquisition time was 5 minutes 30 seconds.
Imaging Data analysis
All imaging data were processed at a GE workstation (AW4.6; GE Medical Systems).
For mono-exponential DWI model, ADC values were calculated as follows: S(b)/S(0)=exp(-b·ADC). --------------[Eq1]
For bi-exponential DWI model, pure water diffusion (D), pseudodiffusion (D*) and perfusion fraction (f) were calculated:
S(b)/S(0)=[(1-f)·exp(-b·D*)]+[f·exp(-b·D)] -----------[Eq2].
For the stretched-exponential DWI model, the water molecular diffusion heterogeneity index (α) and distributed diffusion coefficient ( DDC ) were calculated by following formula:
S(b)/S(0)=exp[-(b·DDC)α]------------------- [Eq3].
Histological analysis
Liver samples were obtained after MR scanning and the specimens were stained with haematoxylin-eason and Masson’s trichrome. In histological analysis, NASH CRN-NAS scoring system was used to grading the severity of NAFLD, in which categorized as normal (NAS=0), simple-steatosis (NAS=1,2), borderline(NAS=3,4) and NASH (NAS≥5) .
Statistical analysis
All statistical analyses were performed using SPSS software version-21.0. One-way-analysis-of-variance was performed to identify significant difference among different severity groups of NAFLD. Spearman rank correlation analysis was used to estimate the correlation between ADC,D,D*,f DDC, α, with the severity of NAFLD. In addition, characteristic operating curve (ROC) was applied to evaluate the diagnostic efficiency of diffusion parameters, for NASH early detecting. The significant threshold was set as P = 0.05.
Results
Both α and D increased with increasing NAFLD severity (r = 0.852, 0.473, respectively; P < 0.05). ADC, f and DDC decreased as NAFLD severity increased (r = -0.549, -0.807, -0.631, respectively; P < 0.05). (Fig.1).Both α and f a significant difference was observed between borderline and NASH groups(Fig. 2).In addition, the area-under-the-receiver-operating-characteristic-curve (AUC) was calculated for ADC, D,D*, f, DDC and α, respectively (Fig.3). Both α [AUC]=0.942) and f (AUC=0.921) had significantly greater AUC than ADC (AUC=0.717) in this differentiation of NASH from borderline or less severe groups (P < 0.05), indicating the most robust diagnosis for NASH.Discussion and conclusion
In this study, mono-exponential bi-exponential and stretched-exponential DWI models were applied to assess the severity of NAFLD in a rabbit model. While comparable behavior was found in f from bi-exponential model and α in the stretched-exponential model, showed the best performance in NASH diagnosis compared with ADC in mono-exponential model. Additionally, as the aggravation of NAFLD, fat accumulation, hepatocyte ballooning and perivascular fibrosis increase tissue heterogeneity3 . While, previous study showed perfusion fraction was decreased in the progress of NAFLD, we assume that heterogeneity in fluid viscosity have more influence on α than that of tissue heterogeneity. Thus, α showed a positive correlation with the severity of NAFLD, and f showed a negative correlation with the severity of NAFLD. In conclusion, we therefore can demonstrate that bi-exponential and stretched-exponential model were superior to mono-exponential model in accurate assessment of NAFLD and in the differentiation NASH from simple steatosis.Acknowledgements
Funded by the Youth Project from Department of Science and Technology of Jiangsu (BK20160450); Top Six Talent Summit Project of Jiangsu Province Human Resources and Social Security Department (2016-WSN-277).
References
- Joo I, Lee JM, Yoon JH, Jang JJ, Han JK, Choi BI. Nonalcoholic Fatty Liver Disease: Intravoxel Incoherent Motion Diffusion-weighted MR Imaging-An Experimental Study in a Rabbit Model. Radiology 2014;270(1):131-140.
- Seo N, Chung YE, Park YN, Kim E, Hwang J, Kim MJ.Liver fibrosis: stretched exponential model outperforms mono-exponential and bi-exponential models of diffusion-weighted MRI. ..Eur Radiol. 2018 Jul;28(7):2812-2822.
- Jin YN, Zhang Y, Cheng JL, Zheng DD, Hu Y. Monoexponential, Biexponential, and stretched-exponential models using diffusion-weighted imaging: A quantitative differentiation of breast lesions at 3.0T. J Magn Reson Imaging. 2019 Nov;50(5):1461-1467.
- Kim HC1, Seo N, Chung YE, Park MS, Choi JY, Kim MJ. Characterization of focal liver lesions using the stretched exponential model: comparison with monoexponential and biexponential diffusion-weighted magnetic resonance imaging. Eur Radiol. 2019 Sep;29(9):5111-5120.
Figures
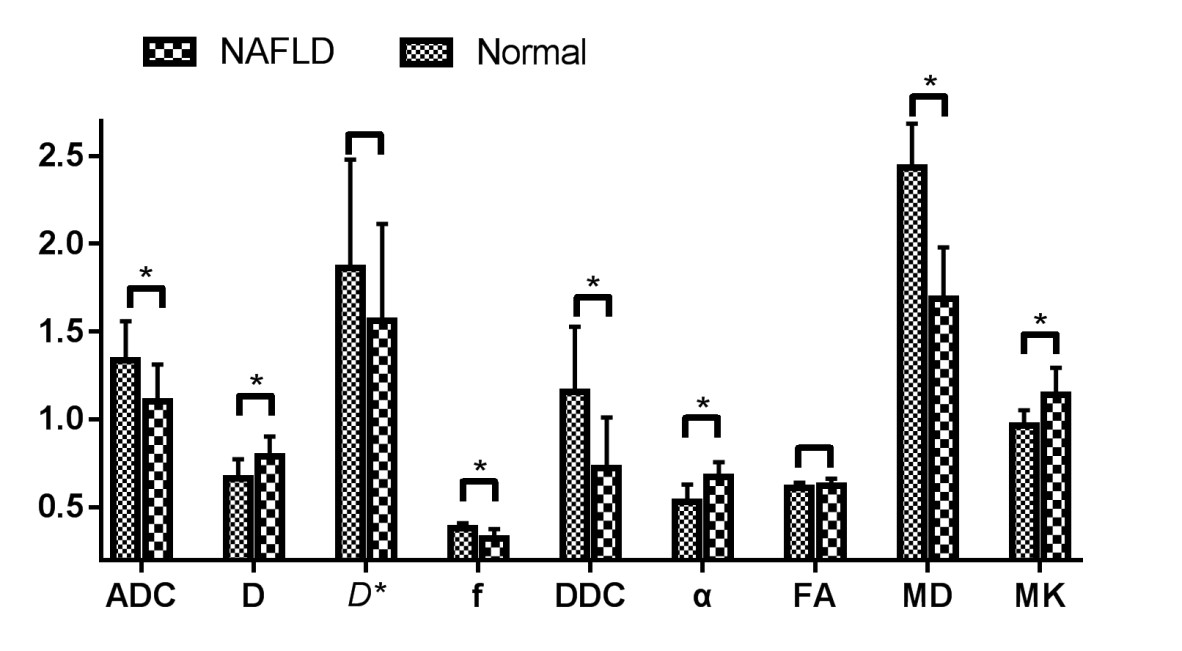
Fig.1 Compared with normal liver the NAFLD showed significantly decrease of ADC D* DDC f, While increase of D and Alpha.
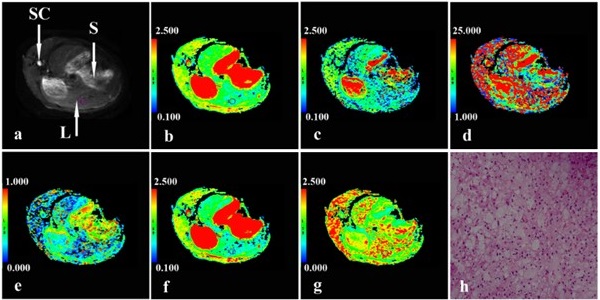
Fig. 2 A rabbit with a high-fat/cholesterol diet feeding for 8 weeks. (a) axial imaging with b value of 0 s/mm2, ADC, D, D*, f, DDC and α pseudo-color maps (b-g) from monoexponential, biexponential ,and stretched-exponential DWI models were 1.002×10⁻³mm2/s, 0.812×10⁻³mm2/s, 13.731×10⁻³mm2/s, 29.102%, 0.763×10⁻³mm2/s, 0.859, respectively. Histological specimen (h) (magnification, ×200). S=stomach, L=liver, SC=spinal canal.
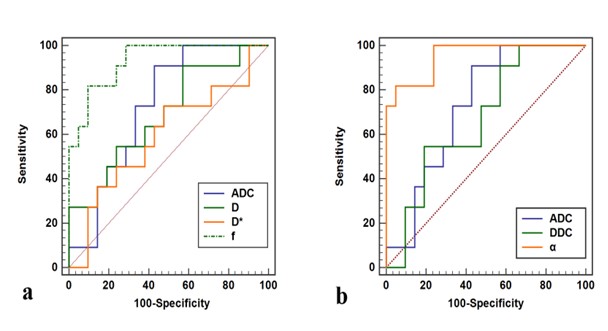
Fig.3 Compare receiver operating characteristic curve for (a) bi-exponential vs. mono-exponential model; (b) stretched-exponential vs. mono-exponential model in distinguishing NASH from borderline or less severity group.