4567
Characterisation of placentome function using combined diffusion-relaxometry MRI and flow anisotropy
Dimitra Flouri1,2, Jack RT Darby3, Stacey L Holman3, Sunthara R Perumal4, Anna L David5,6, Andrew Melbourne1,2, and Janna L Morrison3
1School of Biomedical Engineering & Imaging Sciences, King's College London, London, United Kingdom, 2Department of Medical Physics & Biomedical Engineering, University College London, London, United Kingdom, 3Early Origins of Adult Health Research Group, University of South Australia, Adelaide, Australia, 4Preclinical Imaging and Research Laboratories, South Australian Health and Medical Research Institute, Adelaide, Australia, 5Institute for Women's Health, University College London, London, United Kingdom, 6NIHR University College London Hospitals Biomedical Research Center, London, United Kingdom
1School of Biomedical Engineering & Imaging Sciences, King's College London, London, United Kingdom, 2Department of Medical Physics & Biomedical Engineering, University College London, London, United Kingdom, 3Early Origins of Adult Health Research Group, University of South Australia, Adelaide, Australia, 4Preclinical Imaging and Research Laboratories, South Australian Health and Medical Research Institute, Adelaide, Australia, 5Institute for Women's Health, University College London, London, United Kingdom, 6NIHR University College London Hospitals Biomedical Research Center, London, United Kingdom
Synopsis
Abnormal development of the placenta is postulated as the root cause of preeclampsia and fetal growth restriction. Diffusion-Weighted imaging techniques are considered to give additional placental information. Animal models have been important in invasive validation studies for MRI measurements, as they allow for controlled experiments and analysis of multiple time-points during pregnancy. This study characterises diffusion and perfusion properties of the placenta such as the apparent diffusion coefficient, T2 measurements, fractional anisotropy and perfusion fraction derived from intravoxel incoherent motion analysis on sheep placental tissue in order to validate new imaging markers of placental function.
Introduction
The placenta constitutes the vital link between the mother and fetus. It is implicated in many pregnancy complications such as pre-eclampsia and fetal growth restriction (FGR)1-3. Placental MRI is emerging as a technique with substantial promise to improve prediction, diagnosis and monitoring of pregnancy complications. Diffusion-Weighted imaging (DWI) characterises water motion on a molecular level and provides information on placental microstucture and function4,5. The apparent diffusion coefficient (ADC) serves a convenient measure and shows alteration in placental pathology such as FGR6. T2-relaxometry has the potential to estimate oxygenation levels, and flow fractional anisotropy (FA) can measure the anisotropy imposed on the water diffusion by the tissue microstructure7. Intravoxel inchoherent motion model (IVIM) can obtain perfusion-related measures such as perfusion fraction $$$(f)$$$. Validating measurements in human placenta in-vivo is not possible due to tests invasiveness. However, pregnant sheep are a resilient model of chronic fetal instrumentation and have been used to study fetal circulatory physiology relevant to the clinic7-10. The objective of the present work was to characterise ADC, T2, $$$f$$$ and FA of sheep placental tissue.Methods
Study Population & MR ImagingAll experimental protocols were reviewed and approved by the Animal Ethics Committee of the South Australian Health and Medical Research Institute and abide by the Australian Code of Practice for the Care and Use of Animals for Scientific Purposes developed by the National Health and Medical Research Council.
At 105-110 days gestation nine ewes were anaesthetised (induction:diazepam (0.3mg/kg),ketamine (7mg/kg); maintenance:2.5% isoflurane),intubated and ventilated with 1:5L oxygen to air gas mixture (Lyppards,South Australia,Australia) for MRI session on a 3T Siemens Skyra Scanner (Erlangen,Germany) 9,10. DWI was performed at 7 b‐values (b = 0,10,20,30,50,70,100,200,300,500,600s.mm-2) and T2 relaxometry at 10 echo times (TE = 81,90,96,120,150,180,210,240,270,300ms). Data also acquired at b‐value 50s.mm-2 and 200s.mm-2 for TE = (81,90,120,150,180,210,240ms). Diffusion tensor imaging is also acquired in 30 non-colinear directions at b-values of 50s.mm-2 and 100s.mm-2 and echo time 69ms. Voxel resolution was $$$0.9 \times 0.9 \times 2.5$$$mm.
Model-Fitting
We manually delineated regions of interest (ROIs) containing the placentomes on the first b=0 image with the lowest TE (ITK-SNAP Version 3.6.0, 2017). We applied log-linear voxel-wise fitting to obtain measurements of ADC, T2 and FA. IVIM f-parameter was obtained using a Levenberg-Marquardt algorithm. All model fitting was implemented in MATLAB (MathWorks,Natick).
Statistical Analysis
We used Wilcoxon signed-rank test to determine significant differences between FA at low and high b-values at a significance of $$$p<0.05$$$ (MATLAB,MathWorks,Natick).
Results
Fig.1 shows an example of the parameter maps obtained with DWI techniques and T2-relaxometry and Tab.1 summarised the results from all ewes.Average placentome ADC is 0.0015 mm2s-1 which is consistent with cellular tissue in other vascular organs such as the liver and human placenta4,5 .
The average T2 is 169.94ms. This is consistent with a highly perfused and saturated tissue. The sheep placentome comprises interdigitated fetal and maternal capilliary tissue and a multi-layer trophoblast space. The blood pool compartment is likely to consist of highly saturated maternal blood and a lower saturation fetal blood pool.
FA was found to be significantly higher at low b-value than at high b-value (FA(b=50)=0.73,FA(b=100)=0.51,$$$p=0.004$$$). This suggests that it is related to the radial blood flow component of the sheep placentome. This anisotropy decreases further at high b-value implying that the diffusion signal from the trophoblast space does not have detectable anisotropy. Visual inspection of FA maps shows the direction to be predominantly radial within the placentome stucture (Fig.1).
Values of $$$f$$$ from IVIM are consistent across all ewes and placentomes. As a measurement of vascular density, these values are low in comparison to human placenta but comparable to other vascular organs such as the human liver13. The $$$f$$$-values are consistent with the intravascular nature of the fetal and maternal blood pools and the epitheliochorial placentome.
Discussion
This study is the first to perform DWI, T2-relaxomentry and FA analysis in sheep placental tissue. Values of ADC and IVIM-analysis were consistent between ewes and with literature values11. Although the sheep and human placenta share fundamental properties in their function, the sheep placentome is quite different in appearance compared to the human placenta12. In contrast to human single-discoid placenta, the sheep placentome is comprised of the order of 80-100 discrete placentomes12. In the sheep, the exchange takes place between interdigitated fetal and maternal villi, giving rise to a directional structure as inferred from the high flow FA at low b-value, in the human placenta there is no maternal villous structure and the villius tree is free floating in the maternal blood pool. Despite these features, the sheep and human placenta both play a similar role maintaining two separated blood supplies in close proximity in order to facilitate exchange of oxygen and nutrients. This similarity means that the sheep placenta is amenable to the same multi-compartment placental MRI models that have been applied to the human.Conclusion
We have characterised the diffusion properties of placentomes in uncomplicated pregnancy at mid-gestation. Future work will investigate how these properties change with gestational age and placental dysfunction. Establishing robust validation of MR properties in-vivo and at histological findings will help support the translation of advanced MR measurement of placental function into the clinical setting.Acknowledgements
This research was supported by the Wellcome Trust (210182/Z/18/Z), Wellcome Trust/EPSRC (NS/A000027/1) and the Radiological Research Trust.References
- Brosens I, Pijnenborg R, Vercruysse L, Romero R. The “Great Obstetrical Syndromes” are associated with disorders of deep placentation. Am J Obstetrics Gynecol. 2011; 204:193–201.
- Swanson AM, David A. Animal models of fetal growth restriction: Considerations for translational medicine. Placenta. 2015; 36(6):623-630.
- Morrison, JL . Sheep models of intrauterine growth restriction: fetal adaptations and consequences. Clin Exp Pharmacol Physiol. 2008; 35(7):730–43.
- Melbourne A, Aughwane R, Sokolska M, et al. Separating fetal and maternal placenta circulations using multiparametric MRI. Magn Reson Med. 2018; 00:1–12.
- Le Bihan D, Turner R, Douek P, Patronas N. Diffusion MR imaging: clinical applications. AJR AM J Roentgenol. 1992; 159:591-599.
- Razek A, Khalek AA, Mahmoud T, Abdel SE. Apparent Diffusion Coefficient of the Placenta and Fetal Organs in Intrauterine Growth Restriction. JCAT. 2019; 43(3): 507-512.
- Schrauben EM. et al. Fetal hemodynamics and cardiac streaming assessed by 4D flow cardiovascular magnetic resonance in fetal sheep. J. Cardiovasc. Magn. Reson. 2019; 21, 8.
- Duan AQ, Darby JRT, Soo JY et al. Feasibility of phase-contrast cine magnetic resonance imaging for measuring blood flow in the sheep fetus. Am J Physiol Regul Integr Comp Physiol. 2017; [Epub ahead of print].
- Duan AQ, Lock MC, Perumal SR, et al. Feasibility of detecting myocardial infraction in the sheep fetus using late gadolinium enhancement CMR imaging. J Cardiovasc Magn Reson. 2017; 19(1):69-80.
- Morrison JL, Berry MJ, Botting KJ, Darby JRT et al. Improving pregnancy outcomes in humans through studies in sheep. Am J Physiol Regul Integr Comp Physiol. 2018; 315(6): R1123 – R1153.
- Orton MR, Collins DJ, Koh DM et al. Improved Intravoxel Incoherent Motion Analysis of Diffusion Weighted Imaging by Data Driven Bayesian Modeling. Magn Reson Med. 2014; 71: 411–420.
- Hafez SA, Borowicz P, Reynolds LP and Redmer DA. Maternal and fetal microvasculature in sheep placenta at several stages of gestation. J. Anat. 2010;216: 292–300.
- Jerome, N. P. et al. Extended T2-IVIM model for correction of TE dependence of pseudo-diffusion volume fraction in clinical diffusion-weighted magnetic resonance imaging. Phys. Med. Biol. 2016; 61(24):N667-N680.
Figures
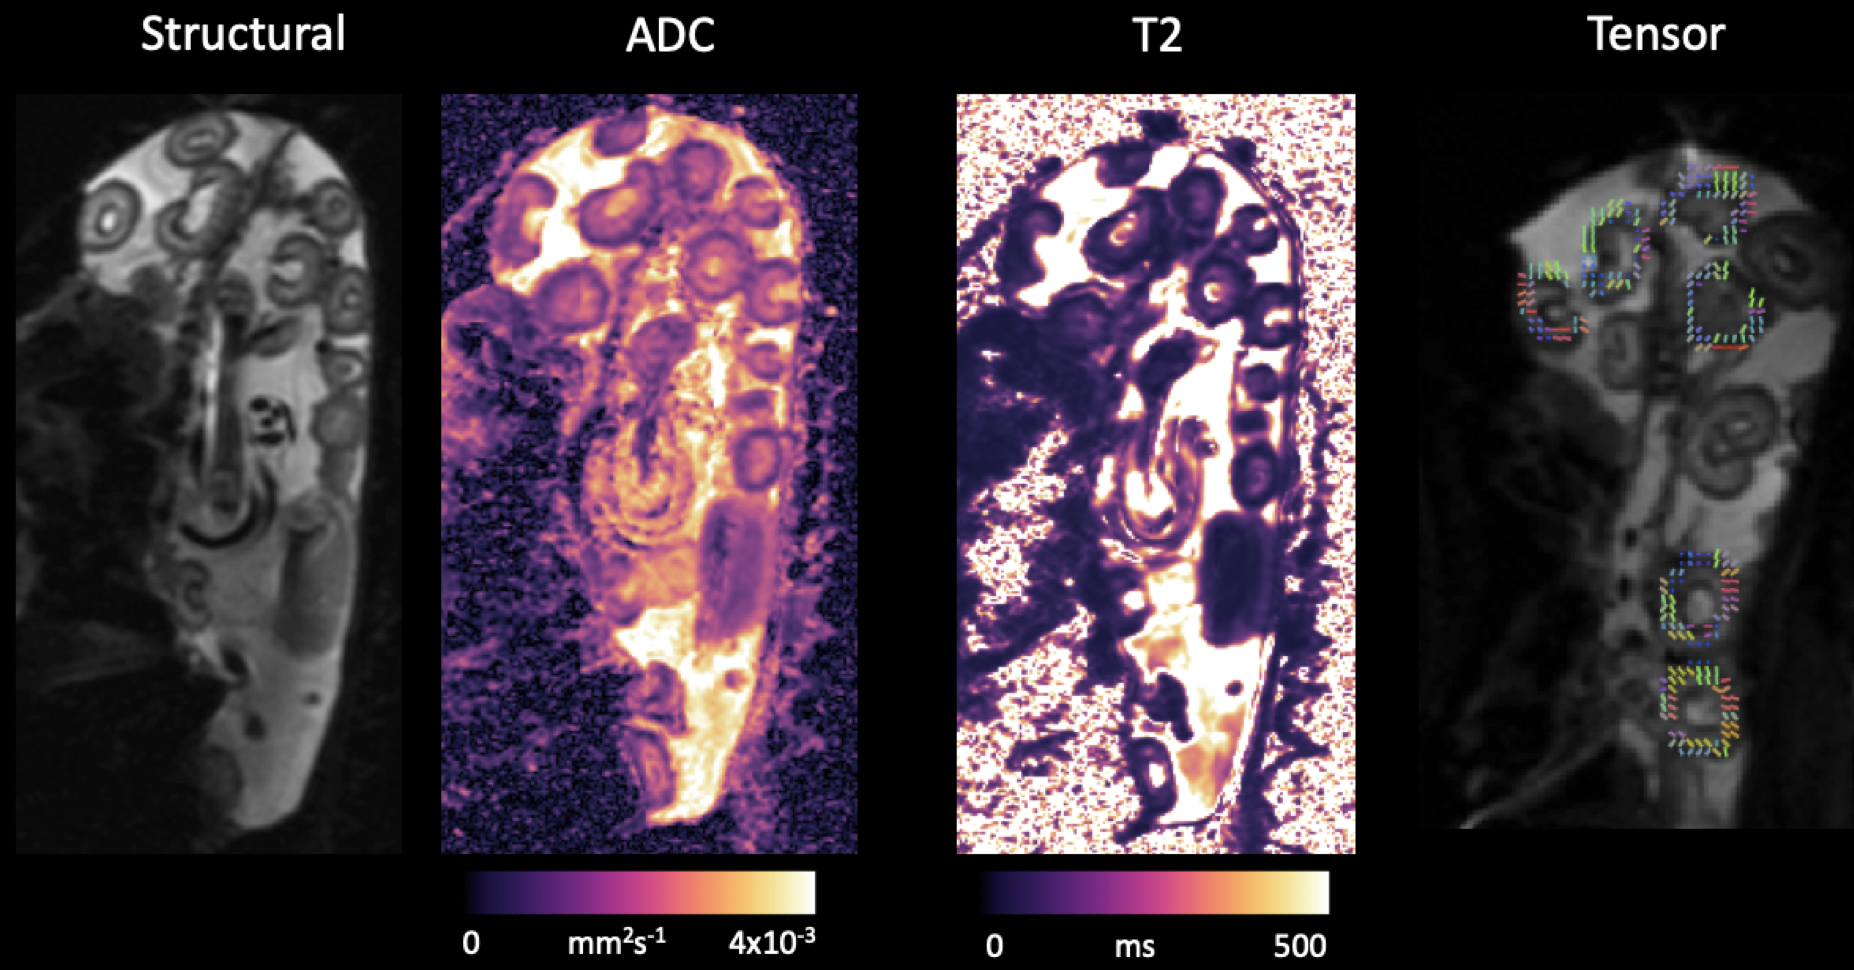
Figure 1: Figure shows example of the ADC, T2
and FA maps of a single subject.
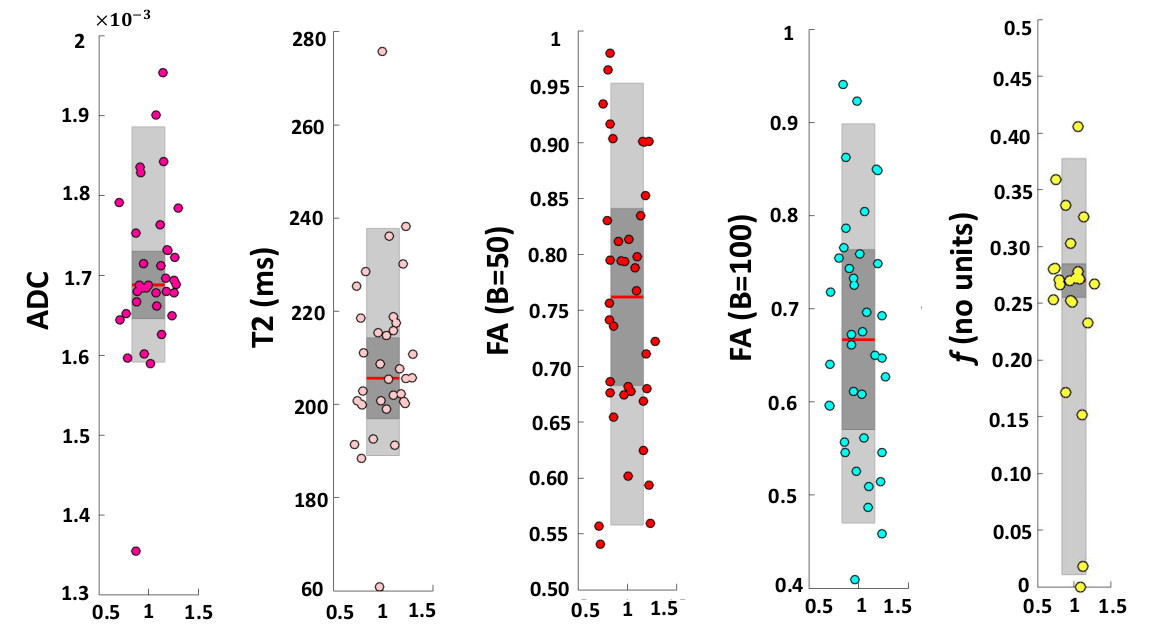
Figure 2:
Box-plots summarising results of a single subject. Each plot shows: the median
(red line), the 25th and 75th percentile (grey box) and
individual means of each placentome in a single sheep (circles).
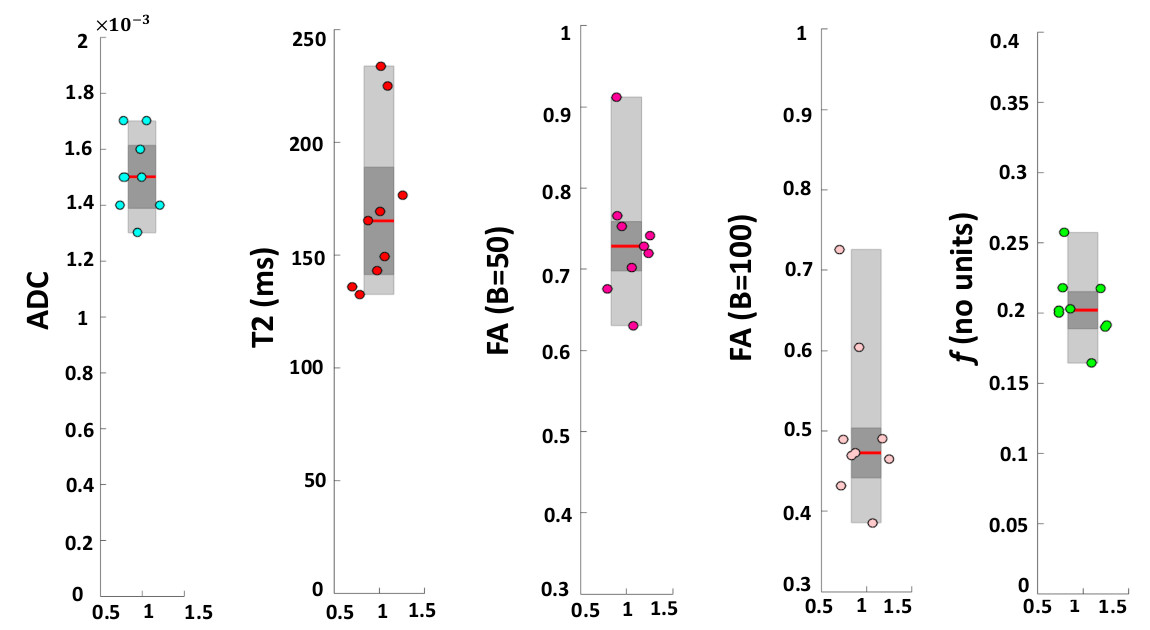
Figure 3:
Box-plots summarising results over the 9 singleton pregnancies. Each plot
shows: the median (red line), the 25th and 75th
percentile (grey box) and individual means of each subject ROIs (circles).
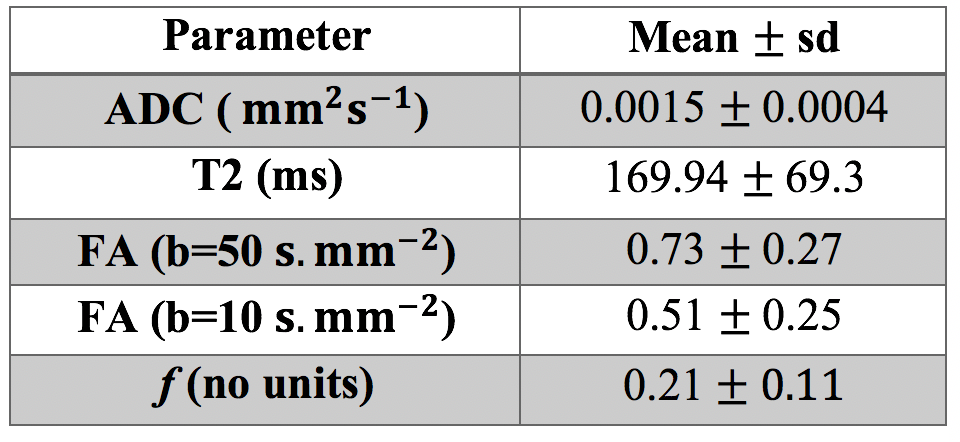
Table 1: Average placentome parameters derived over the 9 singleton pregnancies. Results are presented as mean values ± standard deviation (sd).