4566
Assessment with Partial Peripheral Nerve Transection with Diffusion MRI1VUIIS, Vanderbilt University Medical Center, Nashville, TN, United States
Synopsis
High-resolution DTI of ex vivo rat sciatic nerve yields viable biomarkers of peripheral nerve recovery following partial transection and surgical repair. FA values decreased with increasing cut depth at 4 weeks. By week 12, the three partial cuts showed elongated FA distributions, most likely representing regions with regenerated (high FA values) and degenerated axons (low FA values). FA finding are influenced by pathological features that affect diffusion both perpendicular and parallel to the axons.
Introduction
Surgical repair is recommended after peripheral nerve transections; however, the management of these patients is challenged by a lack of biomarkers to nerve regeneration. For example, both standard electrodiagnostics and clinical examinations provide little information until the target is reinnervated, leading to poor outcomes in cases where a secondary surgery is required (nearly 40% of nerve repairs fail) 1. Previous work has shown that indices from diffusion tensor imaging (DTI) may provide viable biomarkers of nerve de/regeneration in injury models; however, they have not been systematically evaluated following nerve repair procedures. As a result, we evaluated the ability of diffusion MRI indices to assess nerve regeneration following graded partial transections and surgical repair in a rat sciatic nerve injury model, with the long-term goal of validating these MRI findings against histological and behavioral measurements in the same animals.Methods
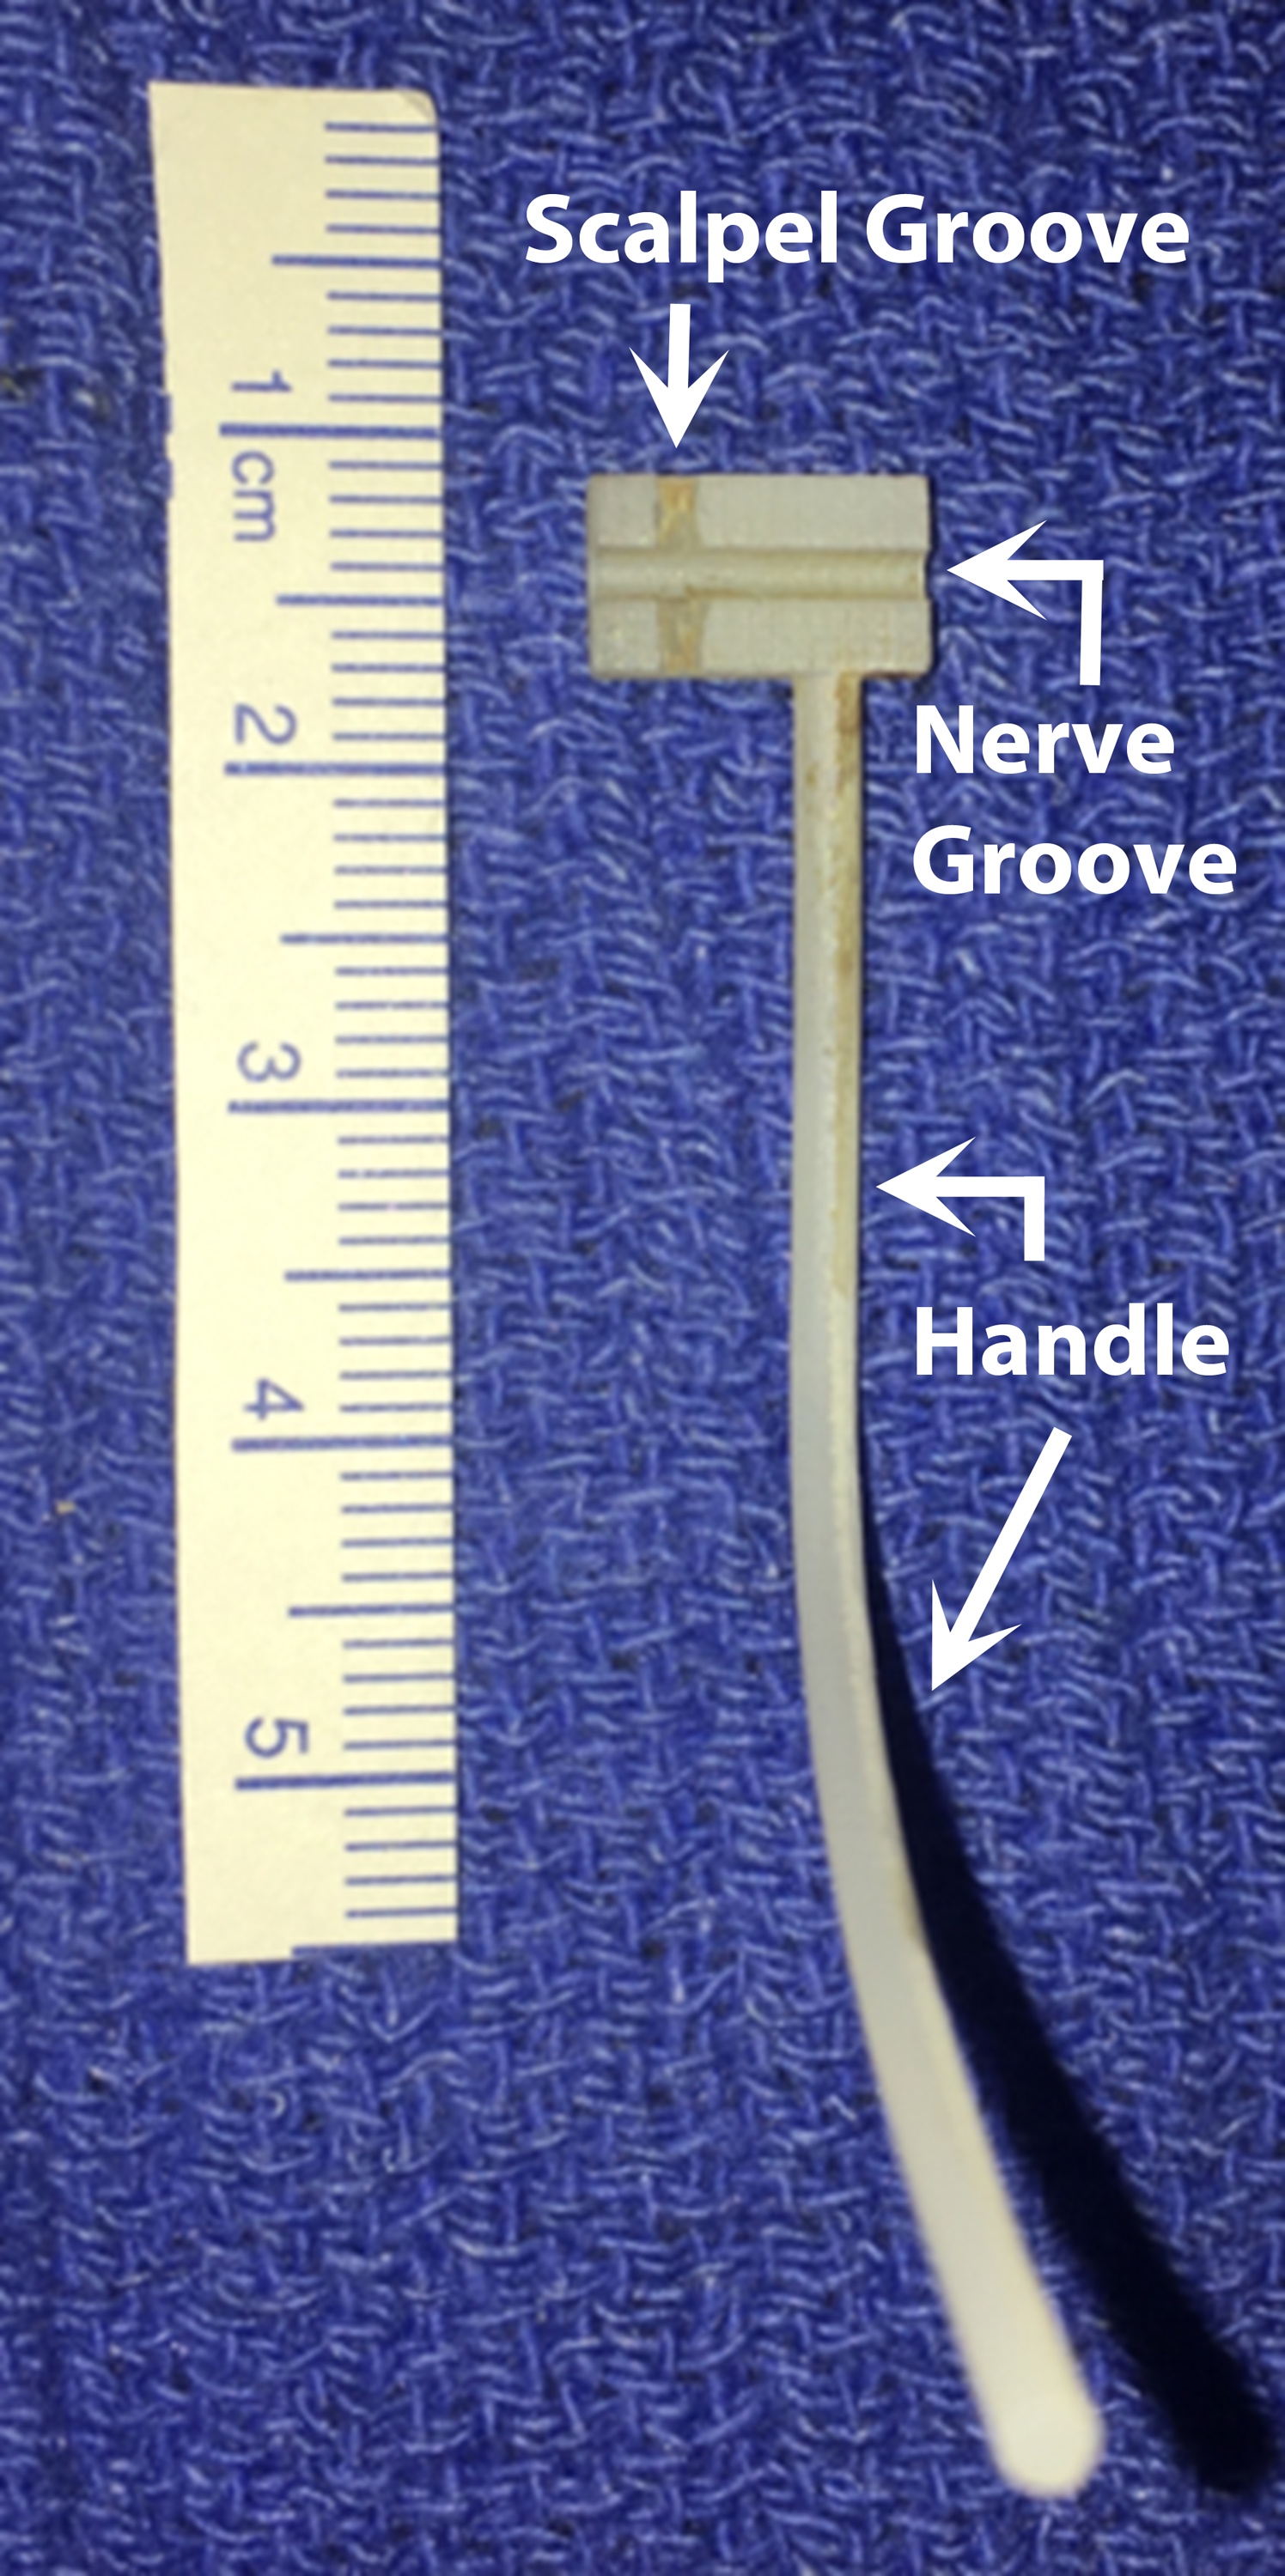
This study used a rat sciatic injury model (female Sprague-Dawley) with partial transection injuries of 25% (n = 12), 50% (n = 12), and 75% (n = 12) followed by interrupted 9-0 nylon epineurial suturing repair. A 3D printed device was used for partial cuts (Figure 1). The device consisted of a block with a handle attached, a channel along the block to hold the healthy nerve, and a groove perpendicular to the channel to control the cut depth of the bisection with the scalpel. Additional sham surgeries (n = 12, nerve freed proximally and distally without damage) and crush injuries (n = 12, application of a Hemostat for 10 sec) were included for comparison. Animals were euthanized at 4 or 12 weeks after injury/repair. These times were chosen because previous work 4,6 has shown that i) edema/inflammation has subsided by 4 weeks, ii) crush/sham nerves generally recover by 4 weeks, and iii) transected nerves with successful repairs have a slower recovery that is incomplete until approximately 12 weeks. Following euthanasia, 1-cm segments of the sciatic nerve were excised from the hindlimb, fixed in glutaraldehyde, washed in PBS to remove the excess fixative, and doped with 1mM of GD-DTA to reduce scan times. Images were acquired (7-T, 16-cm bore Varian) with a 3D diffusion-weighted spin-echo sequence with 20 diffusion directions, b-values=2000 and 4000 s/mm2 and gradient pulse duration/diffusion time (𝛿/Δ)=4/12 ms. Additional parameters included: resolution=125x125x375 𝜇m3, FOV=60x60x160 mm3, TE/TR=22/425 ms, NEX=2, and scan time=15 hours. Diffusion tensors and voxel-wise indices (V1, FA, AD, RD) estimated 7. In addition, fiber tracts and lengths were reconstructed using ExploreDTI 8.Results
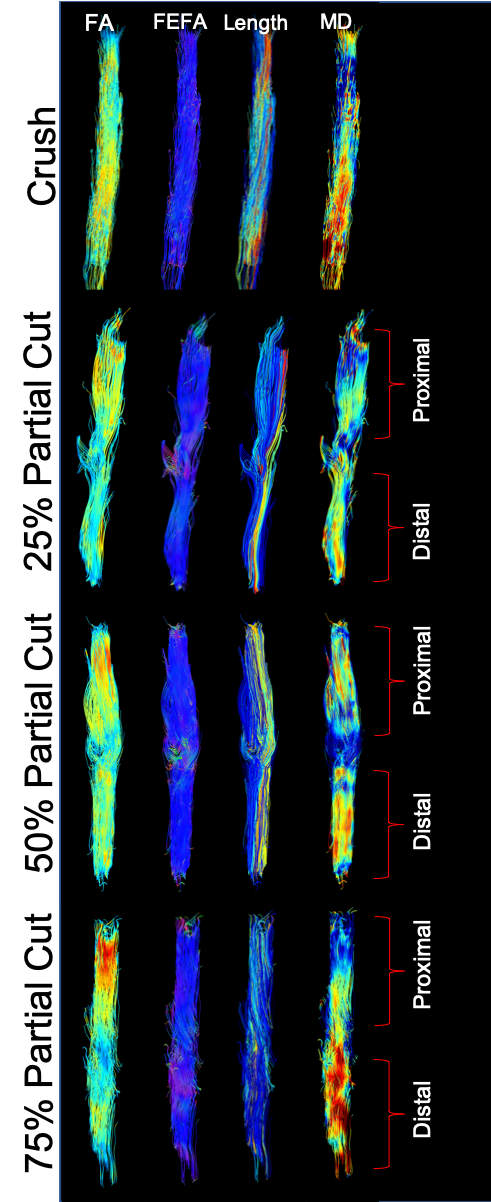
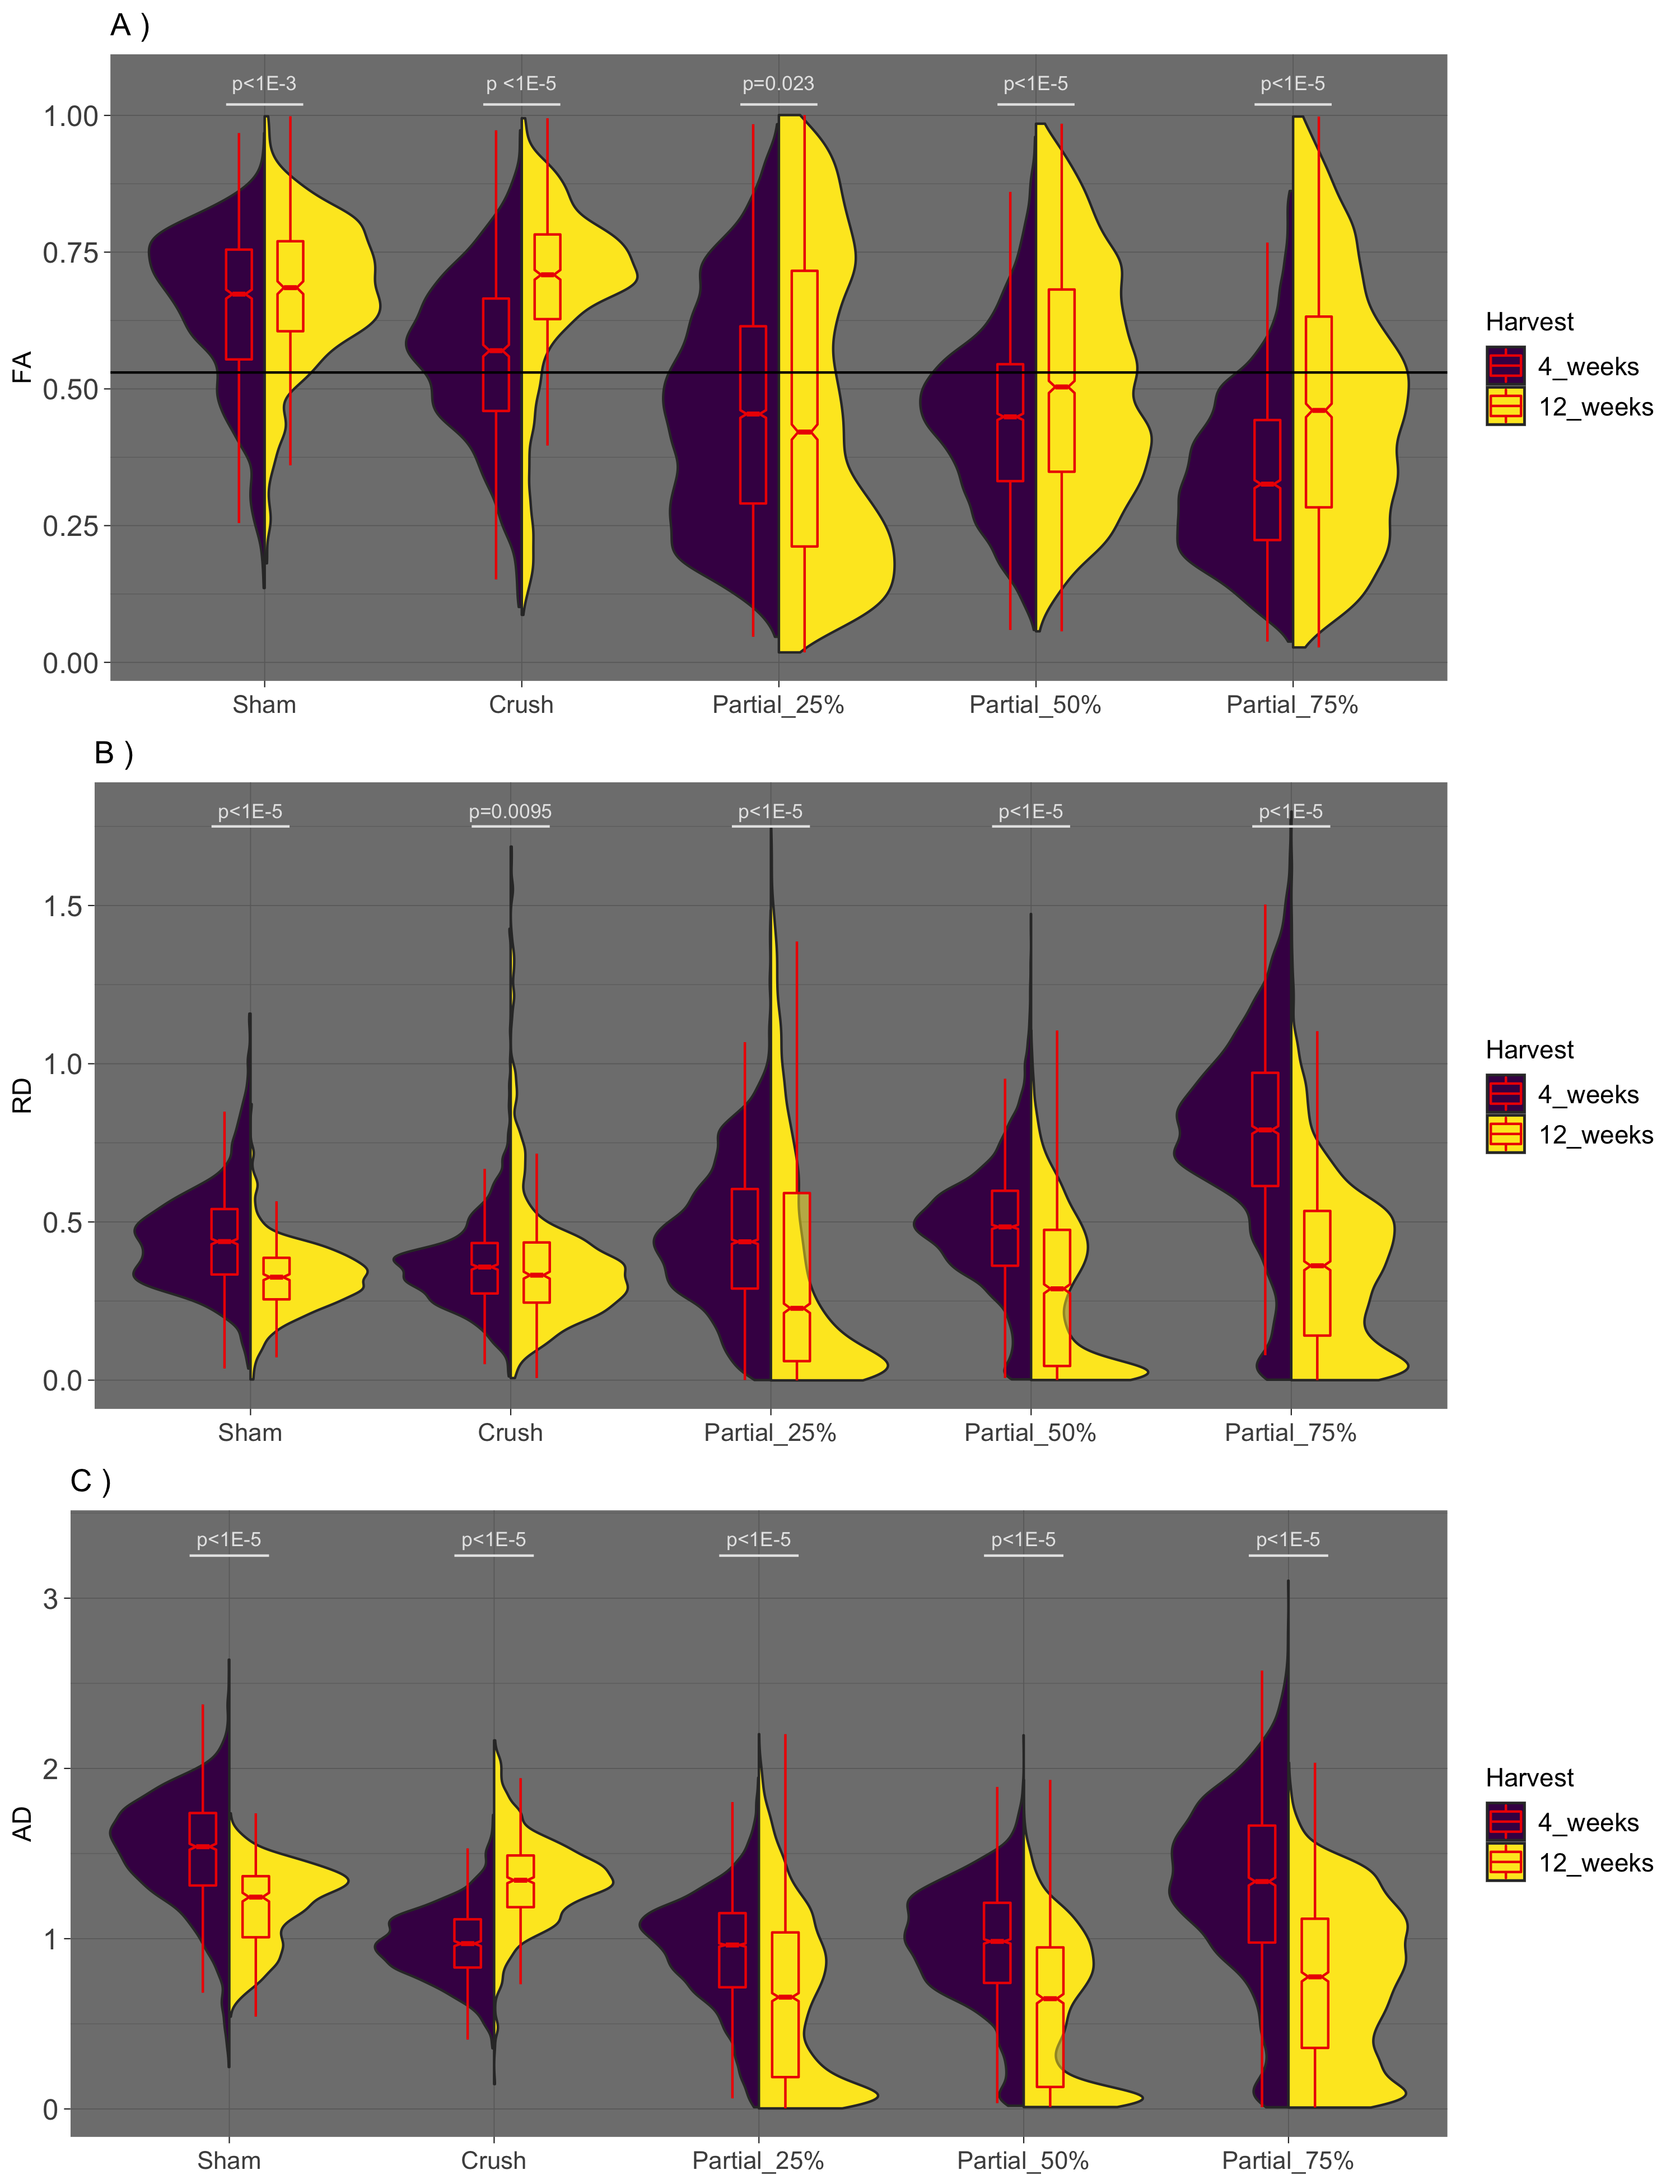
Representative fiber tracts for crush and partial cuts/repairs at 12 weeks are shown in Figure 2, with color-coding by FA, FEFA (V1*FA), fiber length, and MD. Note the inverse relationship between fiber length and cut-depth. In addition, note the area of reduced fiber coherence (fewer blue hues in FEFA), FA, and MD within the injury site, the size of which qualitatively related to the depth of the partial cut. Finally, note the reduced FA distal to the injury site, which is consistent with previous reports 4.Figure 3 summarizes the voxel-wise DTI parameters distal to injury site. Data are given as split violin plots separated at 4 and 12 weeks to indicate the evolution of each distribution during the recovery process. Relative to crush and sham, median FA values decreased with increasing cut depth at 4 weeks. By week 12, the three partial cuts showed elongated FA distributions. Based upon our previously developed probabilistic model of nerve recovery 6, these likely represent regions with regenerated (above the FA = 0.53 threshold in Fig. 3) and degenerated axons (below the same FA threshold). In contrast, crush and sham nerves showed narrower FA distributions with higher median FA values at both 4 and 12 weeks, which is likely indicative of a full recovery. Although similar overall patterns were observed for the other indices (AD, RD), neither scalar indices appear to be driving the observed patterns in FA. In other words, the FA finding are influenced by pathological features that affect diffusion both perpendicular and parallel to the axons.
Discussion and Conclusions
These results indicate that high-resolution DTI of ex vivo rat sciatic nerve yields viable biomarkers of peripheral nerve recovery following partial transection and surgical repair. Future work includes validating these findings via behavioral and pathological measurements from these same animals and samples. In addition, longitudinal in vivo measurements of nerves may be warranted to determine the ability of these measurements to detect failed repairs earlier than existing methods.Acknowledgements
R01 NS097821 and MR 150075 funding.References
1. Vastamaki, M., Kallio, P. & Solonen, K. The Results of secondary microsurgical repair of ulnar nerve injury. J. Hand Surg. Am. 18B, 323–326 (1993).
2. Boyer, R. B. et al. 4.7-T diffusion tensor imaging of acute traumatic peripheral nerve injury. Neurosurg Focus39, 1–9 (2015).
3. Stanisz, G. J., Midha, R., Munro, C. a & Henkelman, R. M. MR properties of rat sciatic nerve following trauma. Magn Reson Med 45, 415–20 (2001).
4. Takagi, T. et al. Visualization of peripheral nerve degeneration and regeneration: Monitoring with diffusion tensor tractography. Neuroimage 44, 884–892 (2009).
5. Morisaki, S. et al. In vivo assessment of peripheral nerve regeneration by diffusion tensor imaging. J. Magn. Reson. Imaging 33, 535–542 (2011).
6. Manzanera Esteve, I. V, Farinas, A. F., Pollins, A. C. & Nussenbaum, M. E. Probabilistic Assessment of Nerve Regeneration with Diffusion MRI : Validation in Rat Models of Peripheral Nerve Trauma. bioRxiv Prepr. Serv. Biol. 97821, 1–22 (2019).
7. Veraart, J., Sijbers, J., Sunaert, S., Leemans, A. & Jeurissen, B. Weighted linear least squares estimation of diffusion MRI parameters: Strengths, limitations, and pitfalls. Neuroimage 81, 335–346 (2013).
8. Leemans, A., Jeurissen, B., Sijbers, J. & Jones, D. ExploreDTI: a graphical toolbox for processing, analyzing, and visualizing diffusion MR data. Proc. 17th Sci. Meet. Int. Soc. Magn. Reson. Med. 17, 3537 (2009).
Figures