4563
Two-step approach in IVIM parameter quantification1Advanced Imaging Research Center, Oregon Health & Science University, Portland, OR, United States, 2Portland VA Medical Center, Portland, OR, United States, 3Urology, Oregon Health & Science University, Portland, OR, United States, 4Diagnostic Radiology, Oregon Health & Science University, Portland, OR, United States
Synopsis
The goal of this study is to investigate a new two-step approach in intra-voxel incoherent motion (IVIM) imaging data quantification. This methods first determines the slow diffusion constant (D) then the pseudo-perfusion parameters (D*, f) using the IVIM model fitting but holding D at pre-determined value. Results show that the new approach returns more consistency parametric maps and the new modeling is favored by Akaike information criterion (AIC).
Introduction
Diffusion-weighted MRI (DWI) plays an important role in multi-parametric MRI (mpMRI) of the prostate. The IVIM (intra-voxel incoherent motion) approach for DWI acquisition and analysis, which quantifies pseudo-random perfusion from capillary bed and “true” random diffusion in the DWI signal, is an emerging technique for prostate lesion characterization.1 However, parameters derived from the standard bi-exponential fitting of the IVIM equation2 often results in unsatisfactory technical quality to provide diagnostic value. The well-known “ill-conditioned” problem3 in bi-exponential IVIM fitting approach (especially at low signal-to-noise ratio, SNR) can be part of the reason for poor parameter accuracy and precision. In this work, a new two-step approach that first determines the slow diffusion constant (D) then the pseudo-perfusion parameters is investigated. Results show that the new approach returns more consistent parameter values.Methods
MRI: After informed consent, seven subjects underwent 3T (Siemens) prostate mpMRI with endorectal RF coil. The DWI protocol employed fifteen b-values with ten of which in the range of 0 - 1000 s/mm2. Other details are: 128 x 128 in-plane matrix (40% phase oversampling), 24 cm FOV, 3.0 mm slice thickness and ~5.7 min acquisition time.Data analysis: Six lesions visible on mp-MRI from five subjects matched biopsy findings. Lesion and contralateral normal appearing prostate tissue (NAPT) ROIs were drawn on DW images. The voxel DWI data within the ROIs were treated using three approaches to quantify DWI parameters: 1) with the biexponential IVIM model1.2 fitting to extract D (the slow diffusion component), D*(pseudo-diffusivity), and f (perfusion fraction); 2) with a two-step approach that first determines D using b values from an automatic determined range with a maximum b value of 1000 s/mm2 (details below) and then the IVIM modeling as approach 1) but only fitting D* and f while holding D fixed at the previous step determined value; and, 3) with monoexponential model using two b values (0 and 1000 s/mm2) to derive ADC.
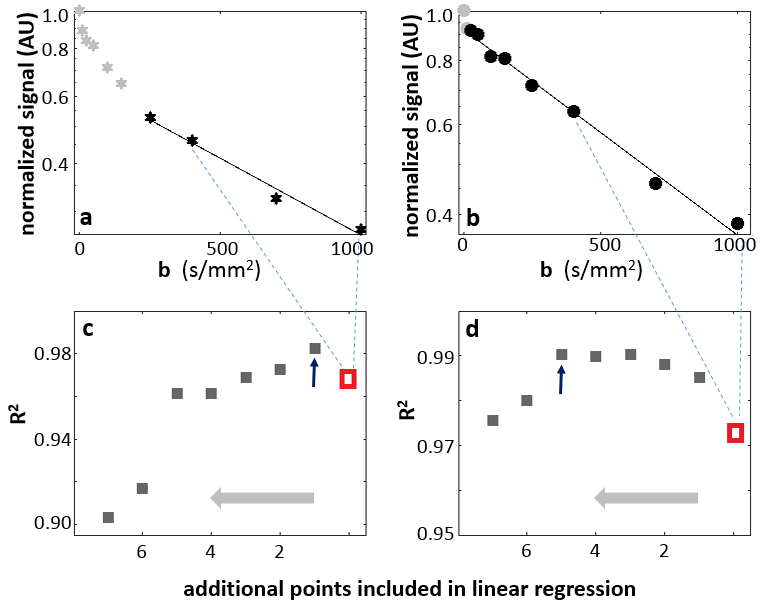
In approach 2), the linear range of log(S/S0) vs. b data was determined using R2 (coefficient of determination) from a series of linear regressions. Fig. 1 illustrates the approach using two single-voxel DWI data from a lesion ROI that resulted in a narrower b-range (Fig. 1a,c) and a wider b-range (Fig. 1b,d). Starting with all b-value points between 400-1000 s/mm2 (the three dark symbols between the light-blue dash lines in Fig 1. a,b), a linear regression of log(S/S0) vs. b was performed and initial D and R2 (red symbols in 1c, 1d) were calculated. Each subsequent linear-regression fitting involved an additional data point from the previous DWI frame (smaller b value). This was carried out until reaching b = 0 s/mm2. The inclusive points for D calculation then involve b-values from the linear regression that returned the highest R2 values. Fig 1. c,d show R2 plot against addition b points (abscissa direction: right to left). The maximum R2 values are indicated with an arrow in 1c and 1d, respectively. For panel 1a data, only one additional DWI point is added this way and the optimal b-value range for D calculation is 250-1000 s/mm2. For the 1b data, b-range includes almost all points but two (0 and 10 s/mm2).
Results
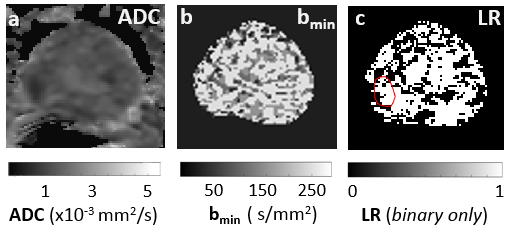
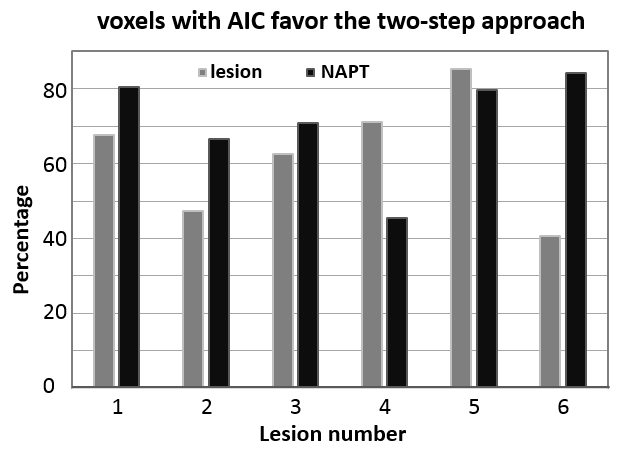
Fig. 2a shows an ADC map. Pixel-wise map of the minimal b-value (bmin) for the optimal b-range determined in approach 2) is shown in Fig. 2b. The Akaike information criterion (AIC) is used to compare the full bi-exponential fitting (approach 1) and the two-step approach (approach 2). Pixels with AIC model selection favoring the two-step modeling is shown in Fig. 2c binary map, which also shows the lesion ROI in red.Fig. 3 Summarizes the AIC model selection results from all six lesion ROIs and the six contralateral normal-appearing ROIs. In more than 68% of all voxels from the ROIs, AIC favors the two-step approach.
Fig. 4 shows the diffusivity maps determined from approach 1 (DM1), approach 2 (DM2), and approach 3 (ADC). The f maps from approaches 1 and 2 are shown as fM1 and fM2, respectively. Appreciable improvement in DM2 and fM2 maps is evident.
Discussion
Our results show that the two-step approach is generally favored by AIC model selection and can deliver more consistent IVIM parametric mapping, especially in D. The severely “ill-conditioned” issues related to bi-exponential fitting at low SNR could be a source for its weaker performance. One practical approach to mitigate this could be to hold the “slow diffusion” parameter at the commonly determined ADC (with 2 or 3 b-values) and perform 2-parameter IVIM fitting. A bmin value around zero also indicates that the measured voxel DWI diffusion pattern can still be primarily characterized as “Gaussian” and the pseudo-perfusion component in the IVIM data is effectively undetectable. This is expected to be more noticeable with decreasing SNR. Given the extremely small cohort size, more study is needed to validate this effort. One limitation of current work is that the upper b-value is held fixed at 1000 s/mm2 for the linear-regressions. More research is needed to determine tissue-specific upper b-values, which must be well below any appreciable “kurtosis” effect4 becomes evident in the DWI data.Acknowledgements
NIH: R44 CA180425.
Thorsten Feiweier (Siemens) for providing the work-in-progress sequence for IVIM-MRI data acquisition.
References
1. Pang Y, Turkbey B, Bernardo M, Kruecker J, Kadoury S, Merino MJ, Wood BJ, Pinto PA, Choyke PL. Intravoxel incoherent motion MR imaging for prostate cancer: an evaluation of perfusion fraction and diffusion coefficient derived from different b-value combinations. Magn Reson Med. 2013; 69:553-62.
2. Le Bihan D, Breton E, Lallemand D, Aubin ML, Vignaud J, Laval-Jeantet M. Separation of diffusion and perfusion in intravoxel incoherent motion MR imaging. Radiology 1988; 168:497-505.
3. Kroeker, RM and Henkelman RM. Analysis of Biological NMR Relaxation Data with Continuous Distributions of Relaxation Times. J. Magn. Reson. 1986; 69: 218-235.
4. Jensen JH, Helpern JA, Ramani A, Lu H, Kaczynski K. Diffusional kurtosis imaging: the quantification of non-gaussian water diffusion by means of magnetic resonance imaging. Magn Reson Med. 2005; 53:1432-1440.
Figures