4562
Radiomics Analysis of Apparent Diffusion Coefficient Maps with Various b-value Combinations for Differentiation of Prostate Cancer1Seoul St. Mary's Hospital, College of Medicine, The Catholic University of Korea, Seoul, Republic of Korea, 2Eunpyeong St.Mary's Hospital, College of Medicine, The Catholic University of Korea, Seoul, Republic of Korea
Synopsis
Prostate Imaging-Reporting and Data System (PI-RADS) suggests acquiring multiple apparent diffusion coefficient (ADC) maps including the lowest b-values between 50-100s/mm2 and highest b-values greater than 1400s/mm2. Radiomics is a novel field in medical imaging to advance decision support by utilizing large amount of quantitative features. In this study, we employed radiomics from ADC maps and a linear regression model to differentiate prostate cancer from benign tissues and evaluated the effect of various b-value combinations on ADC maps. We discovered that ADC with the b-values of 100 and 1000s/mm2 was most effective in discriminating prostate cancer with high accuracy.
Introduction
Diagnosis of prostate cancer often suffers from excessive false positives, which requires further improvements in cancer characterization1. Prostate Imaging-Reporting and Data System (PI-RADS) suggests that multiple ADC maps are acquired with various b-value combinations including the lowest b-values between 50-100s/mm2 and highest b-values greater than 1400s/mm2 2. Radiomics aims to characterize diseases by extracting large amount of features from radiographic medical images using data characterization algorithms3. We hypothesized that radiomics features combined with an appropriate machine learning algorithm would effectively uncover the effects of multiple ADC maps with various b-value combinations in differentiating prostate cancer from benign tissues. The purpose of this study was to use radiomics features in ADC maps to differentiate prostate cancer from the benign tissues, and to compare diagnostic performances of each ADC map produced by various b-value combinations.Methods
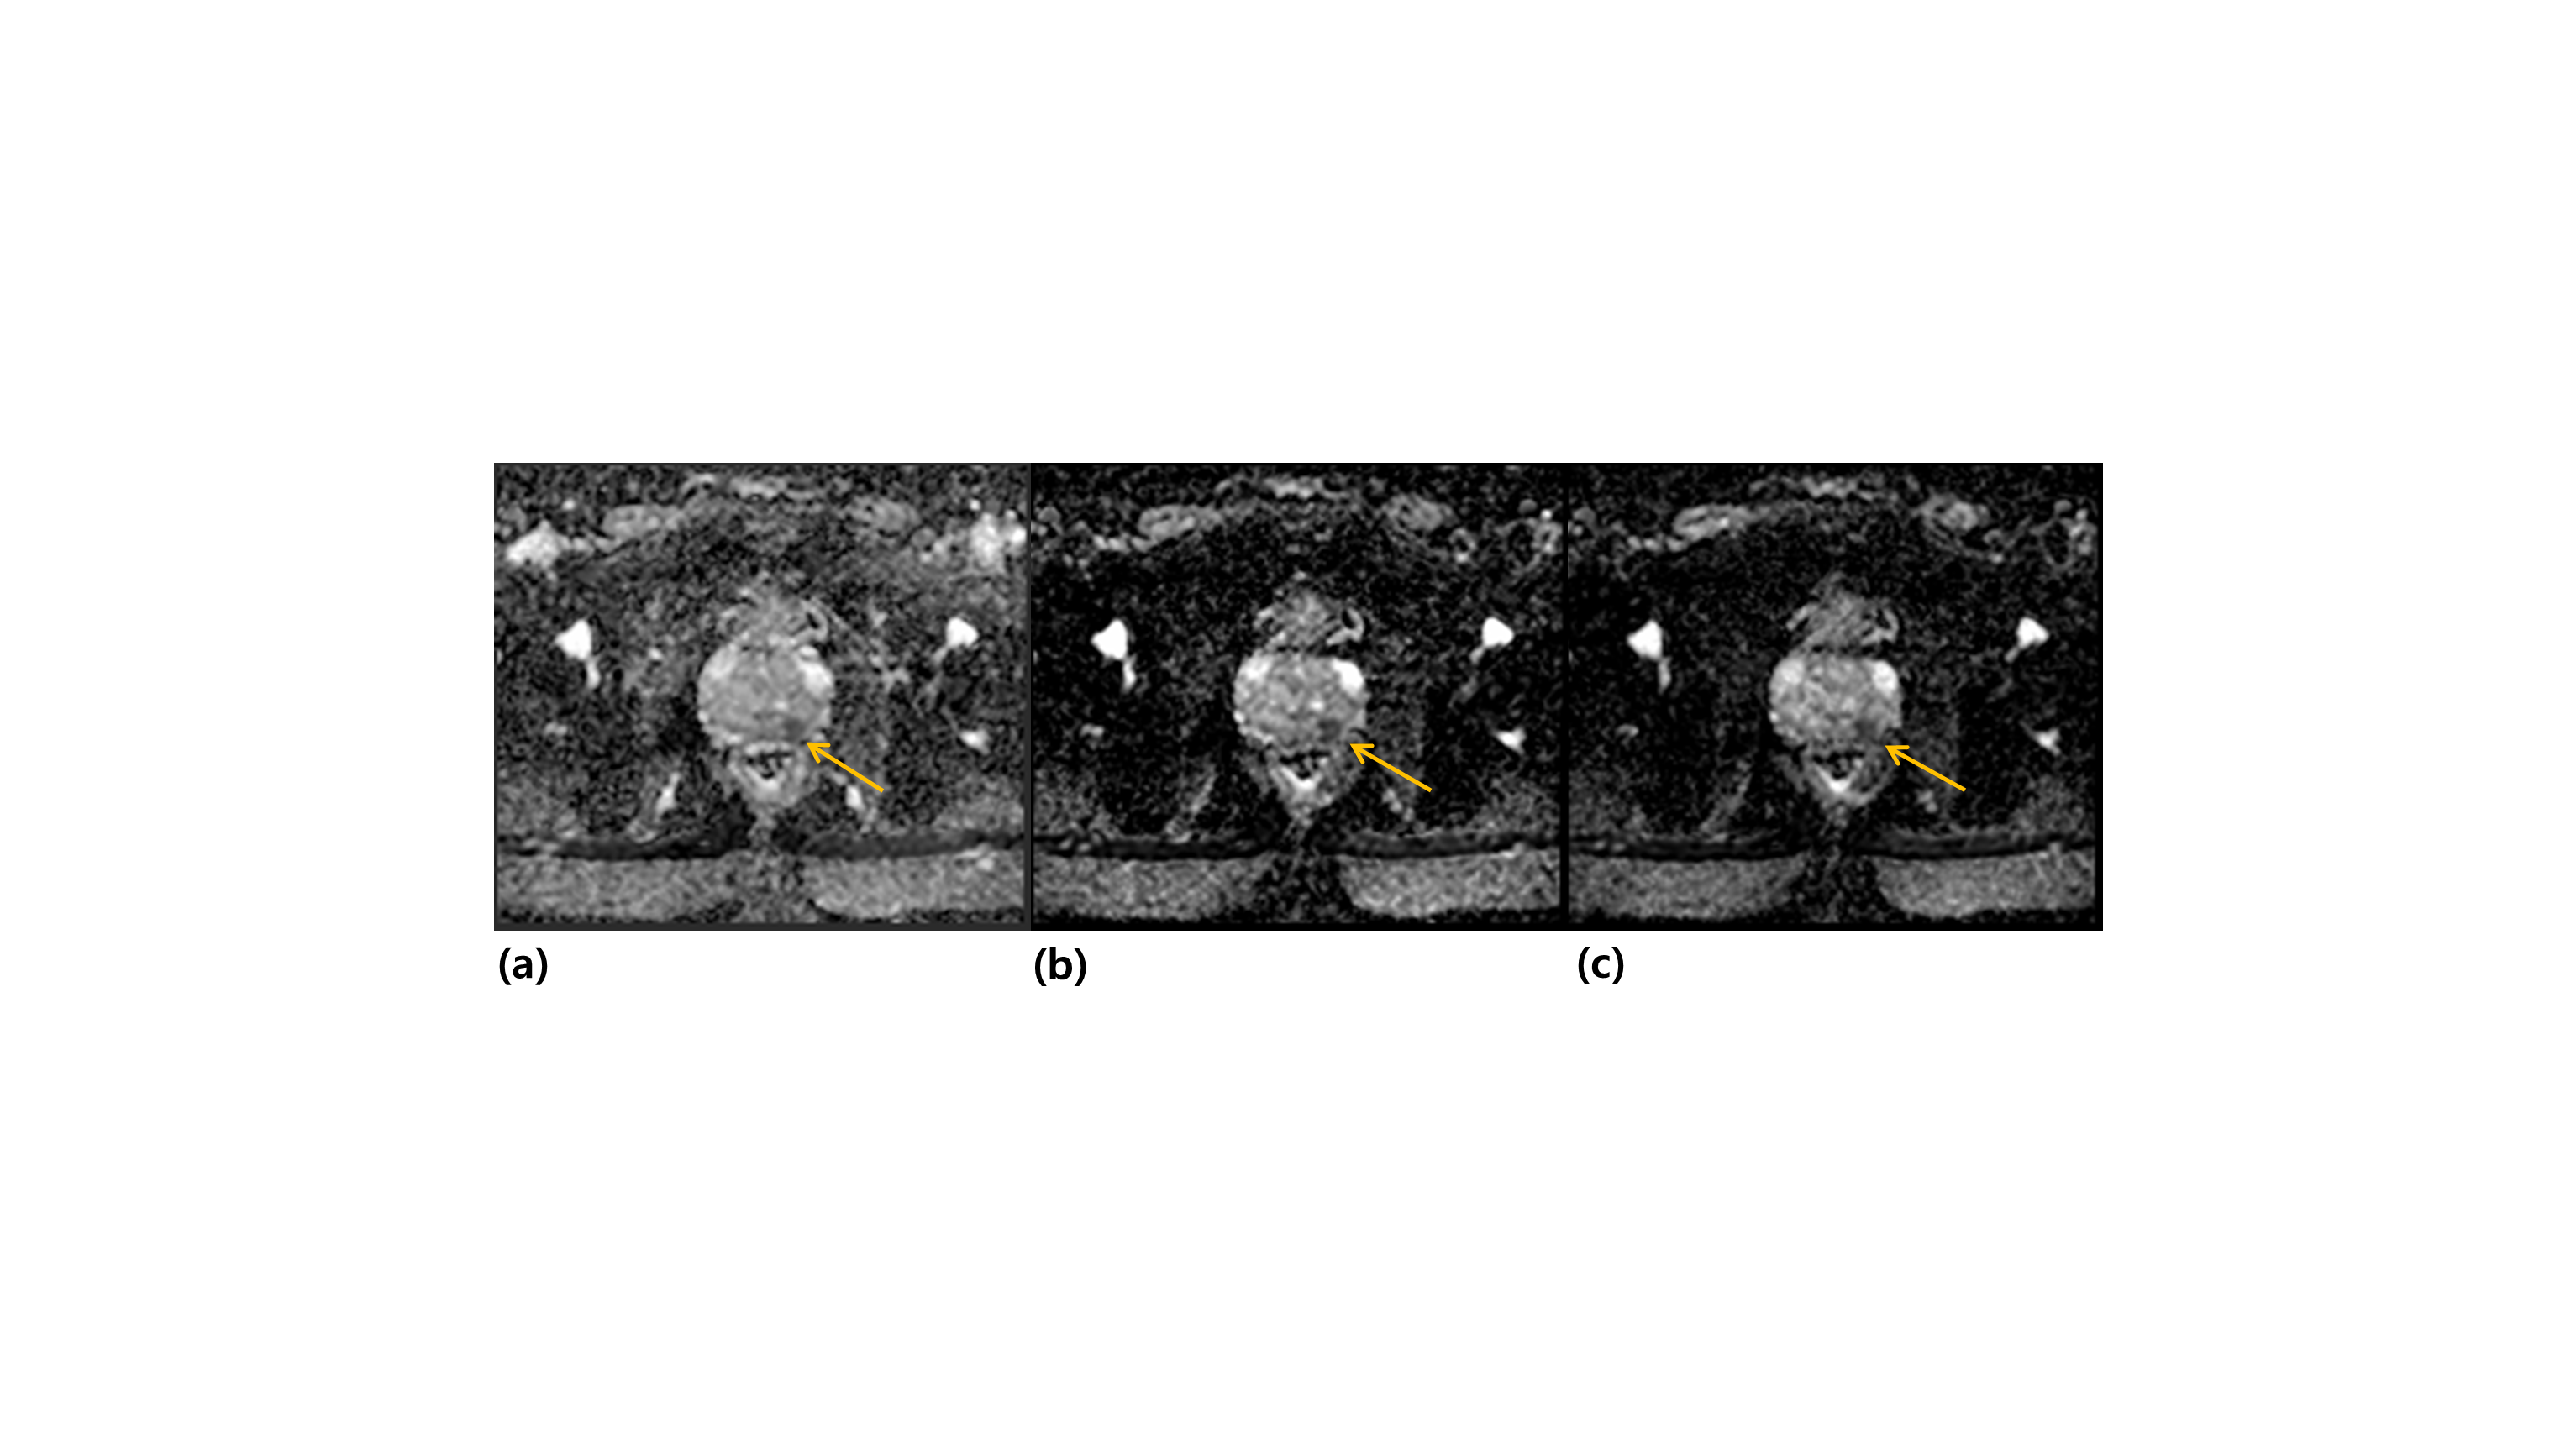
Subjects and image acquisitionThe participants included 106 male patients with prostate cancer (mean age = 72.0, SD = 8.46). For each subject, the high resolution diffusion weighted images (DWI) with b-values of 0, 100, 1000 and 1500s/mm2 were acquired using readout-segmented echo planner imaging with the following parameters: TR = 3700ms, TE = 80ms, FOV = 200 x 180 x 72mm3, acquisition voxel size = 0.833 x 0.833 x 3mm3. The three types of ADC maps were generated from each subject by calculating mean diffusivity from the two different DWI acquired at b-values of 0 and 1000s/mm2 (ADC1), 100 and 1000s/mm2 (ADC2), and 100 and 1500s/mm2 (ADC3), respectively.
Image post-processing and LASSO regression
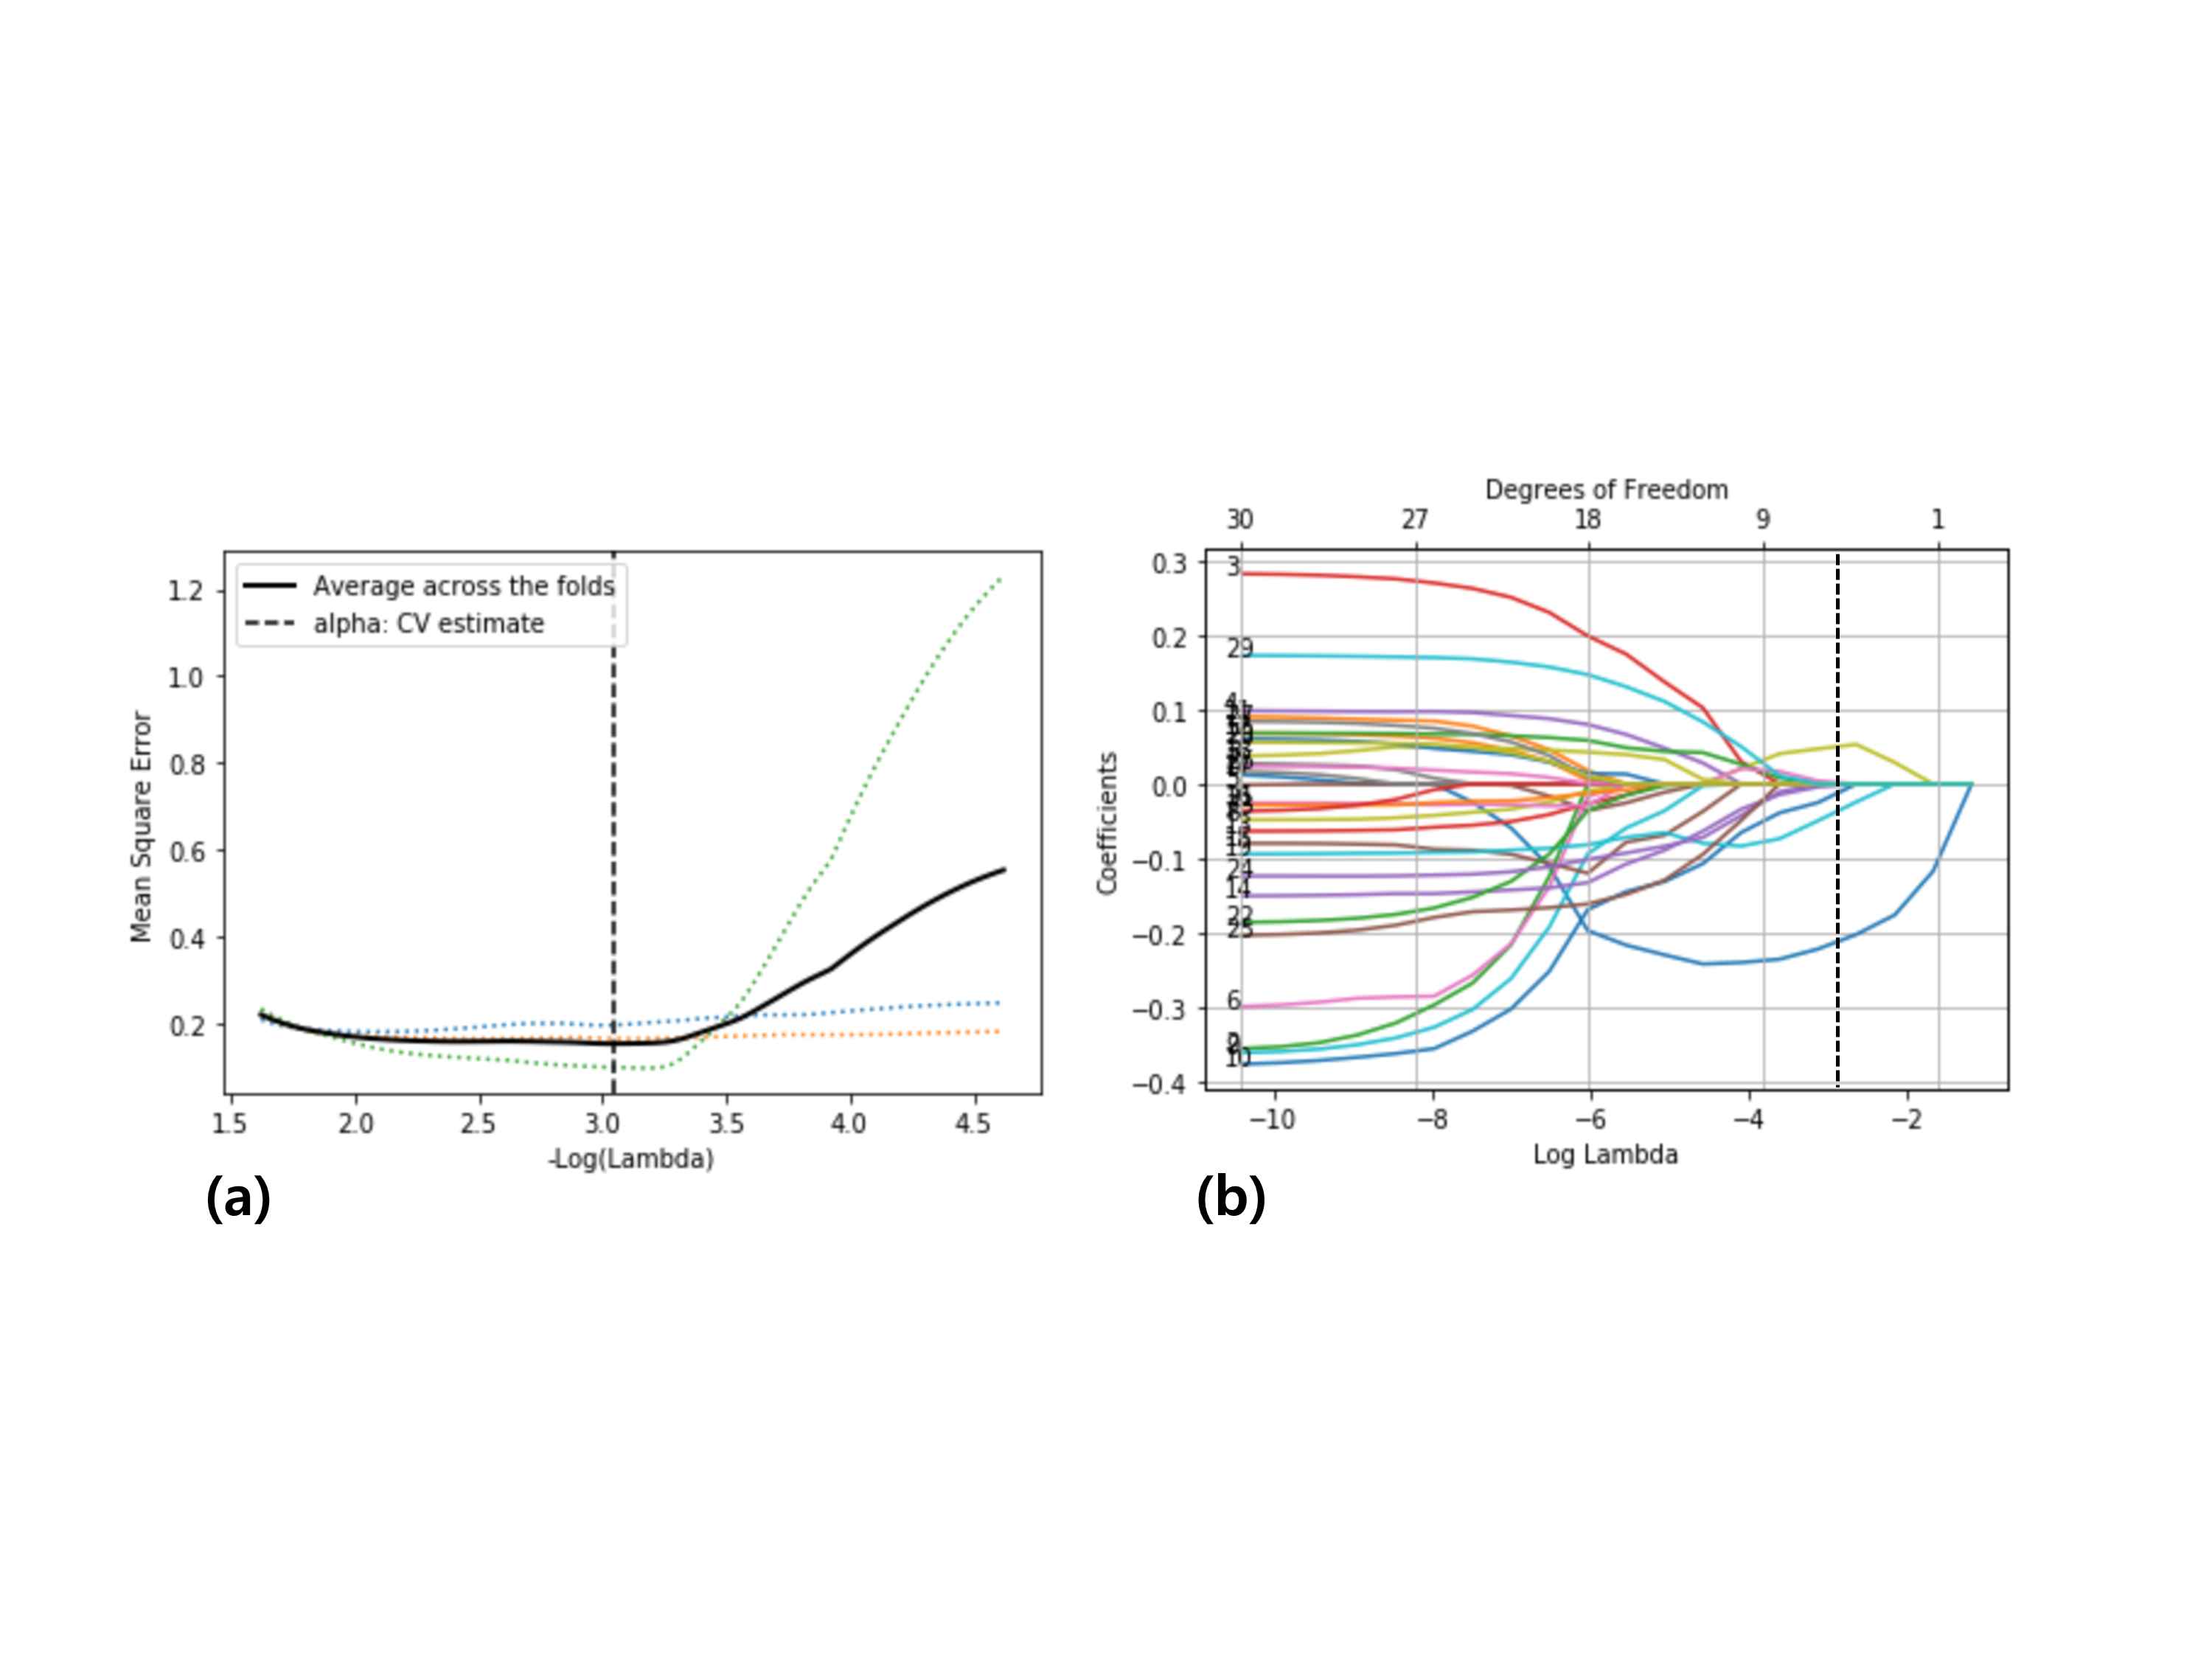
Three-dimensional volumes of interest (VOIs) of prostate cancer and benign tissues were segmented on the ADC images by a board-certified radiologist with 7 years of experience in prostate MRI, using a medical imaging toolkit (MITK, www.mitk.org). A total of 120 radiomics features were extracted from the segmented cancer and benign tissues using pyradiomics, which is an open-source python package for extraction of radiomics features from medical images3. The features with high correlation coefficients (> 0.8) were eliminated, and a LASSO (Least Absolute Shrinkage and Selection Operator) regression method was utilized to perform both a feature selection and regression task to classify prostate cancer from the benign tissues4, which was implemented using Scikit-learn, an open source machine learning library in python5.
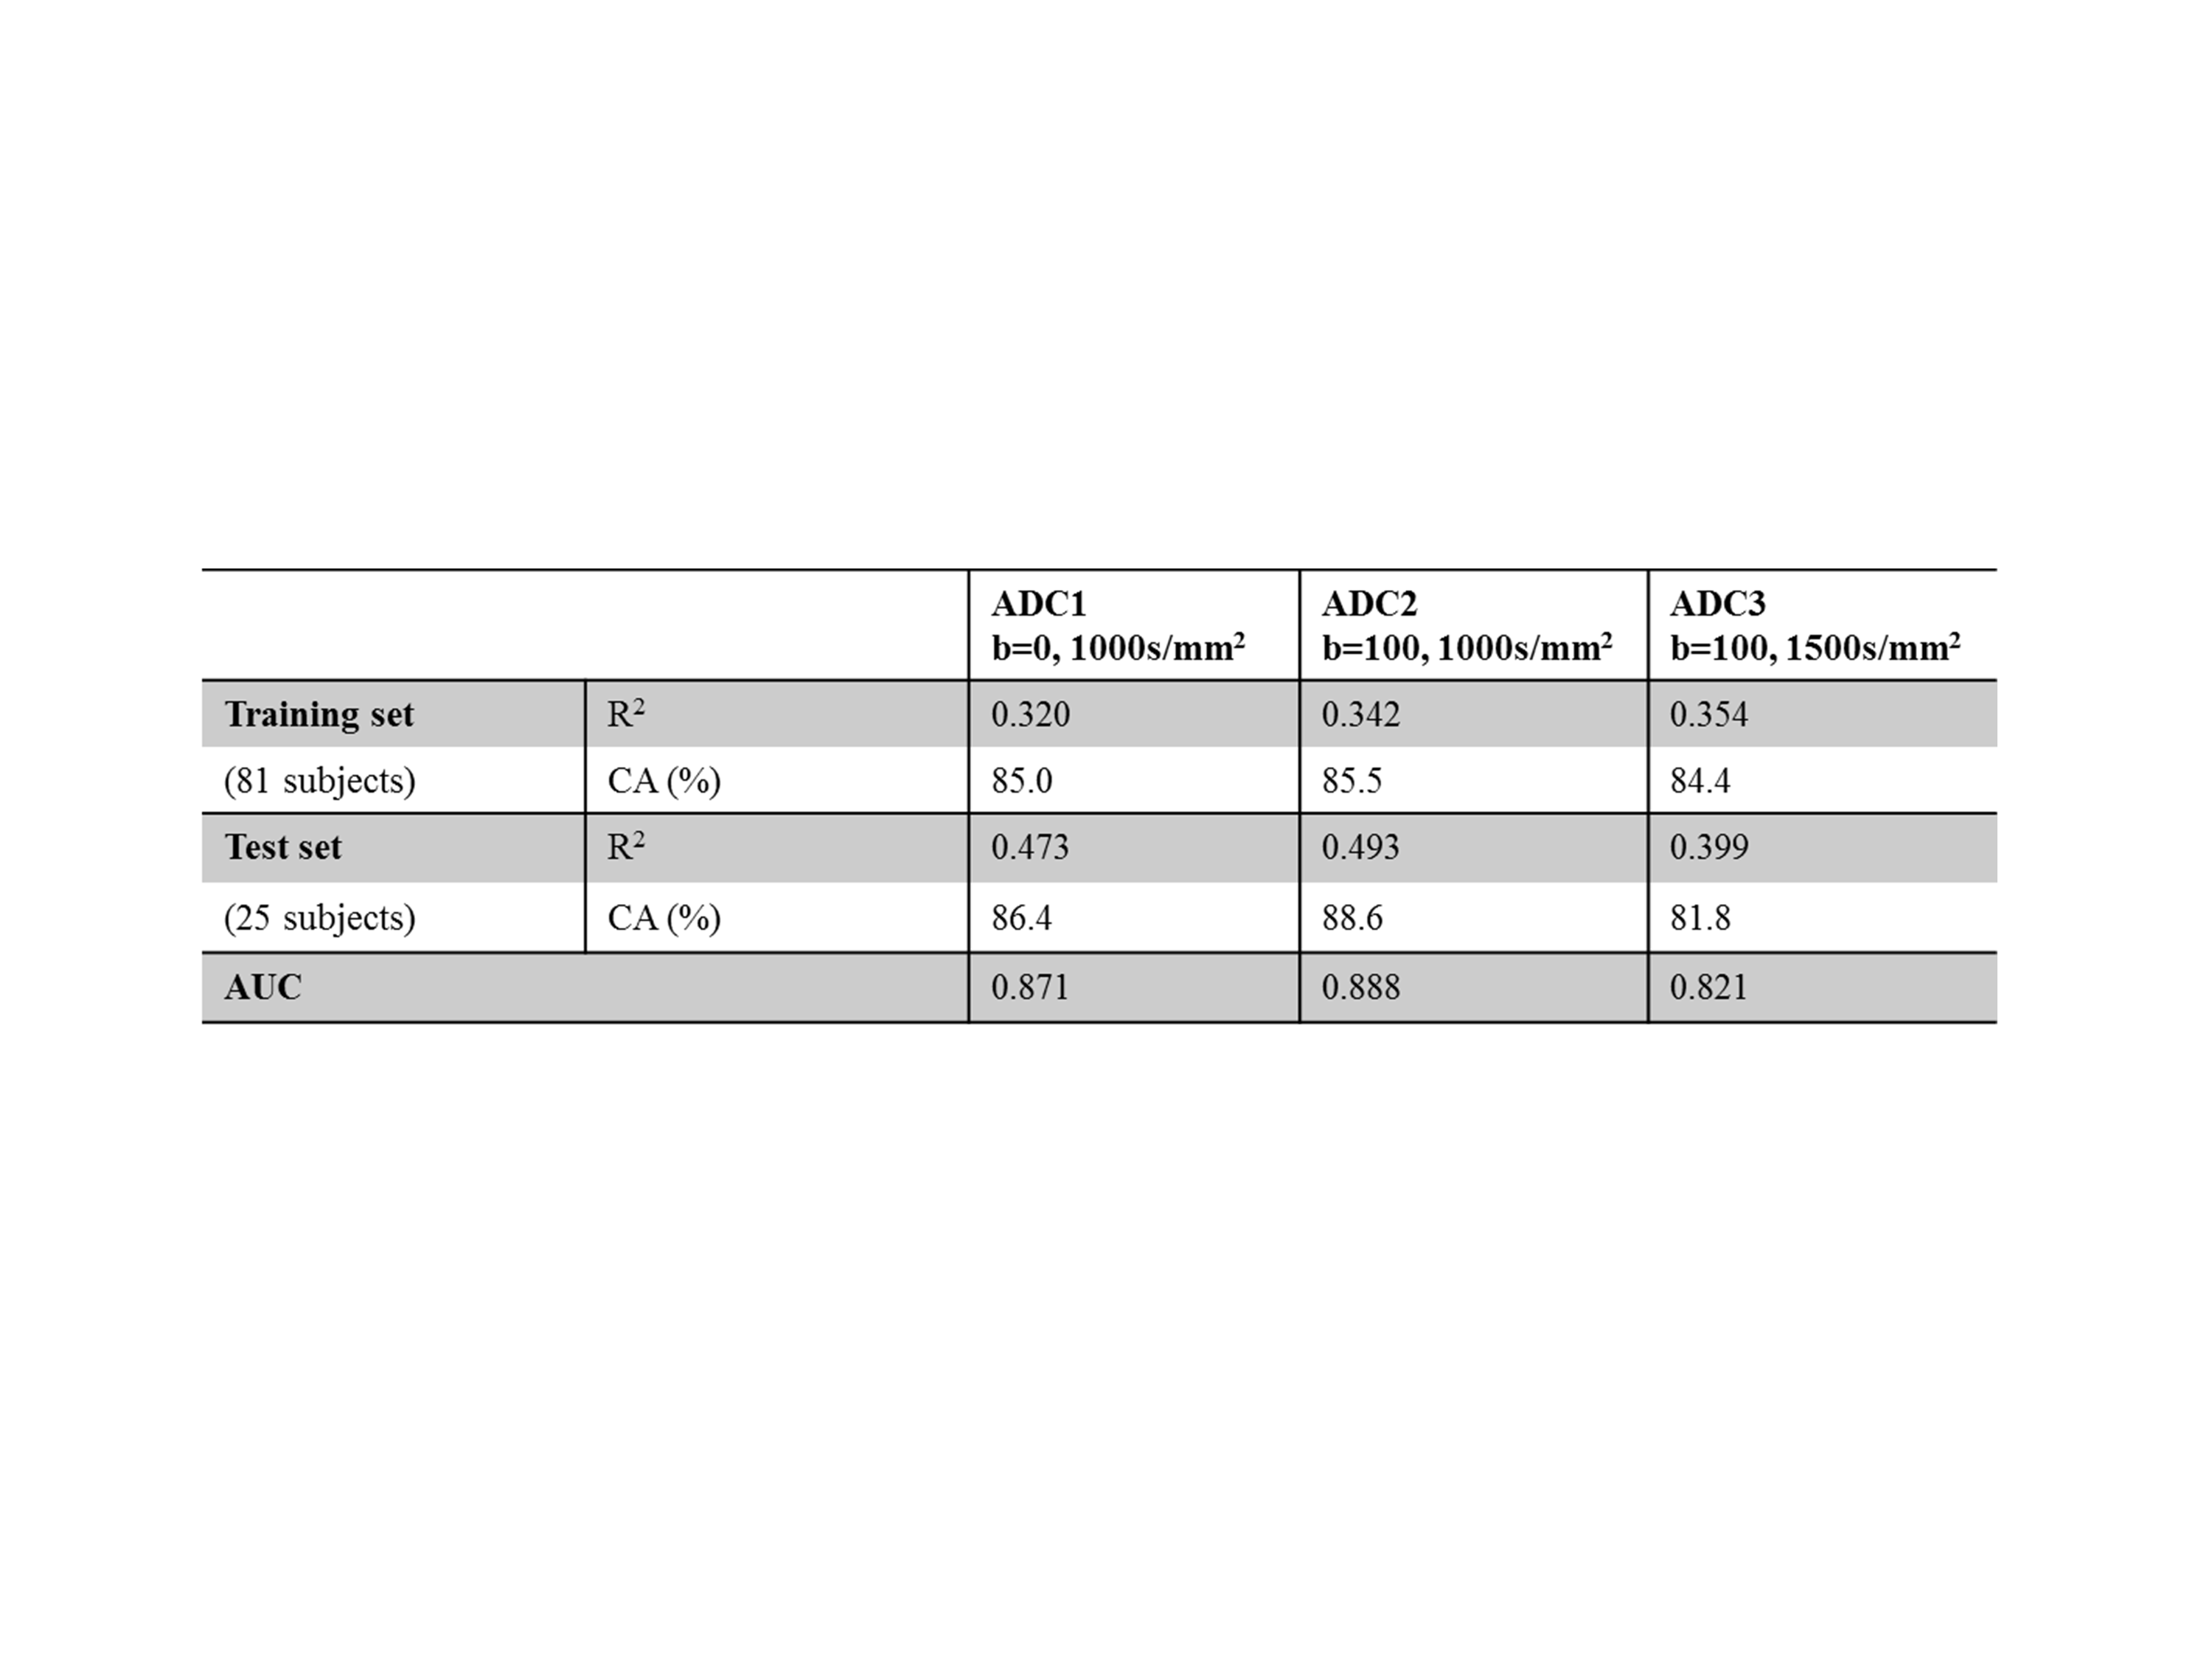
The ratio between the training and test sets was 3 to 1. A 3-fold cross validation was performed on a training set to estimate overall performance of the model. The linear correlation coefficients and classification accuracy were estimated using the training and test set, respectively. Finally, an area under the receiver operating characteristic (ROC) curve (AUC) was calculated to estimate overall diagnostic performance of the model.
Results
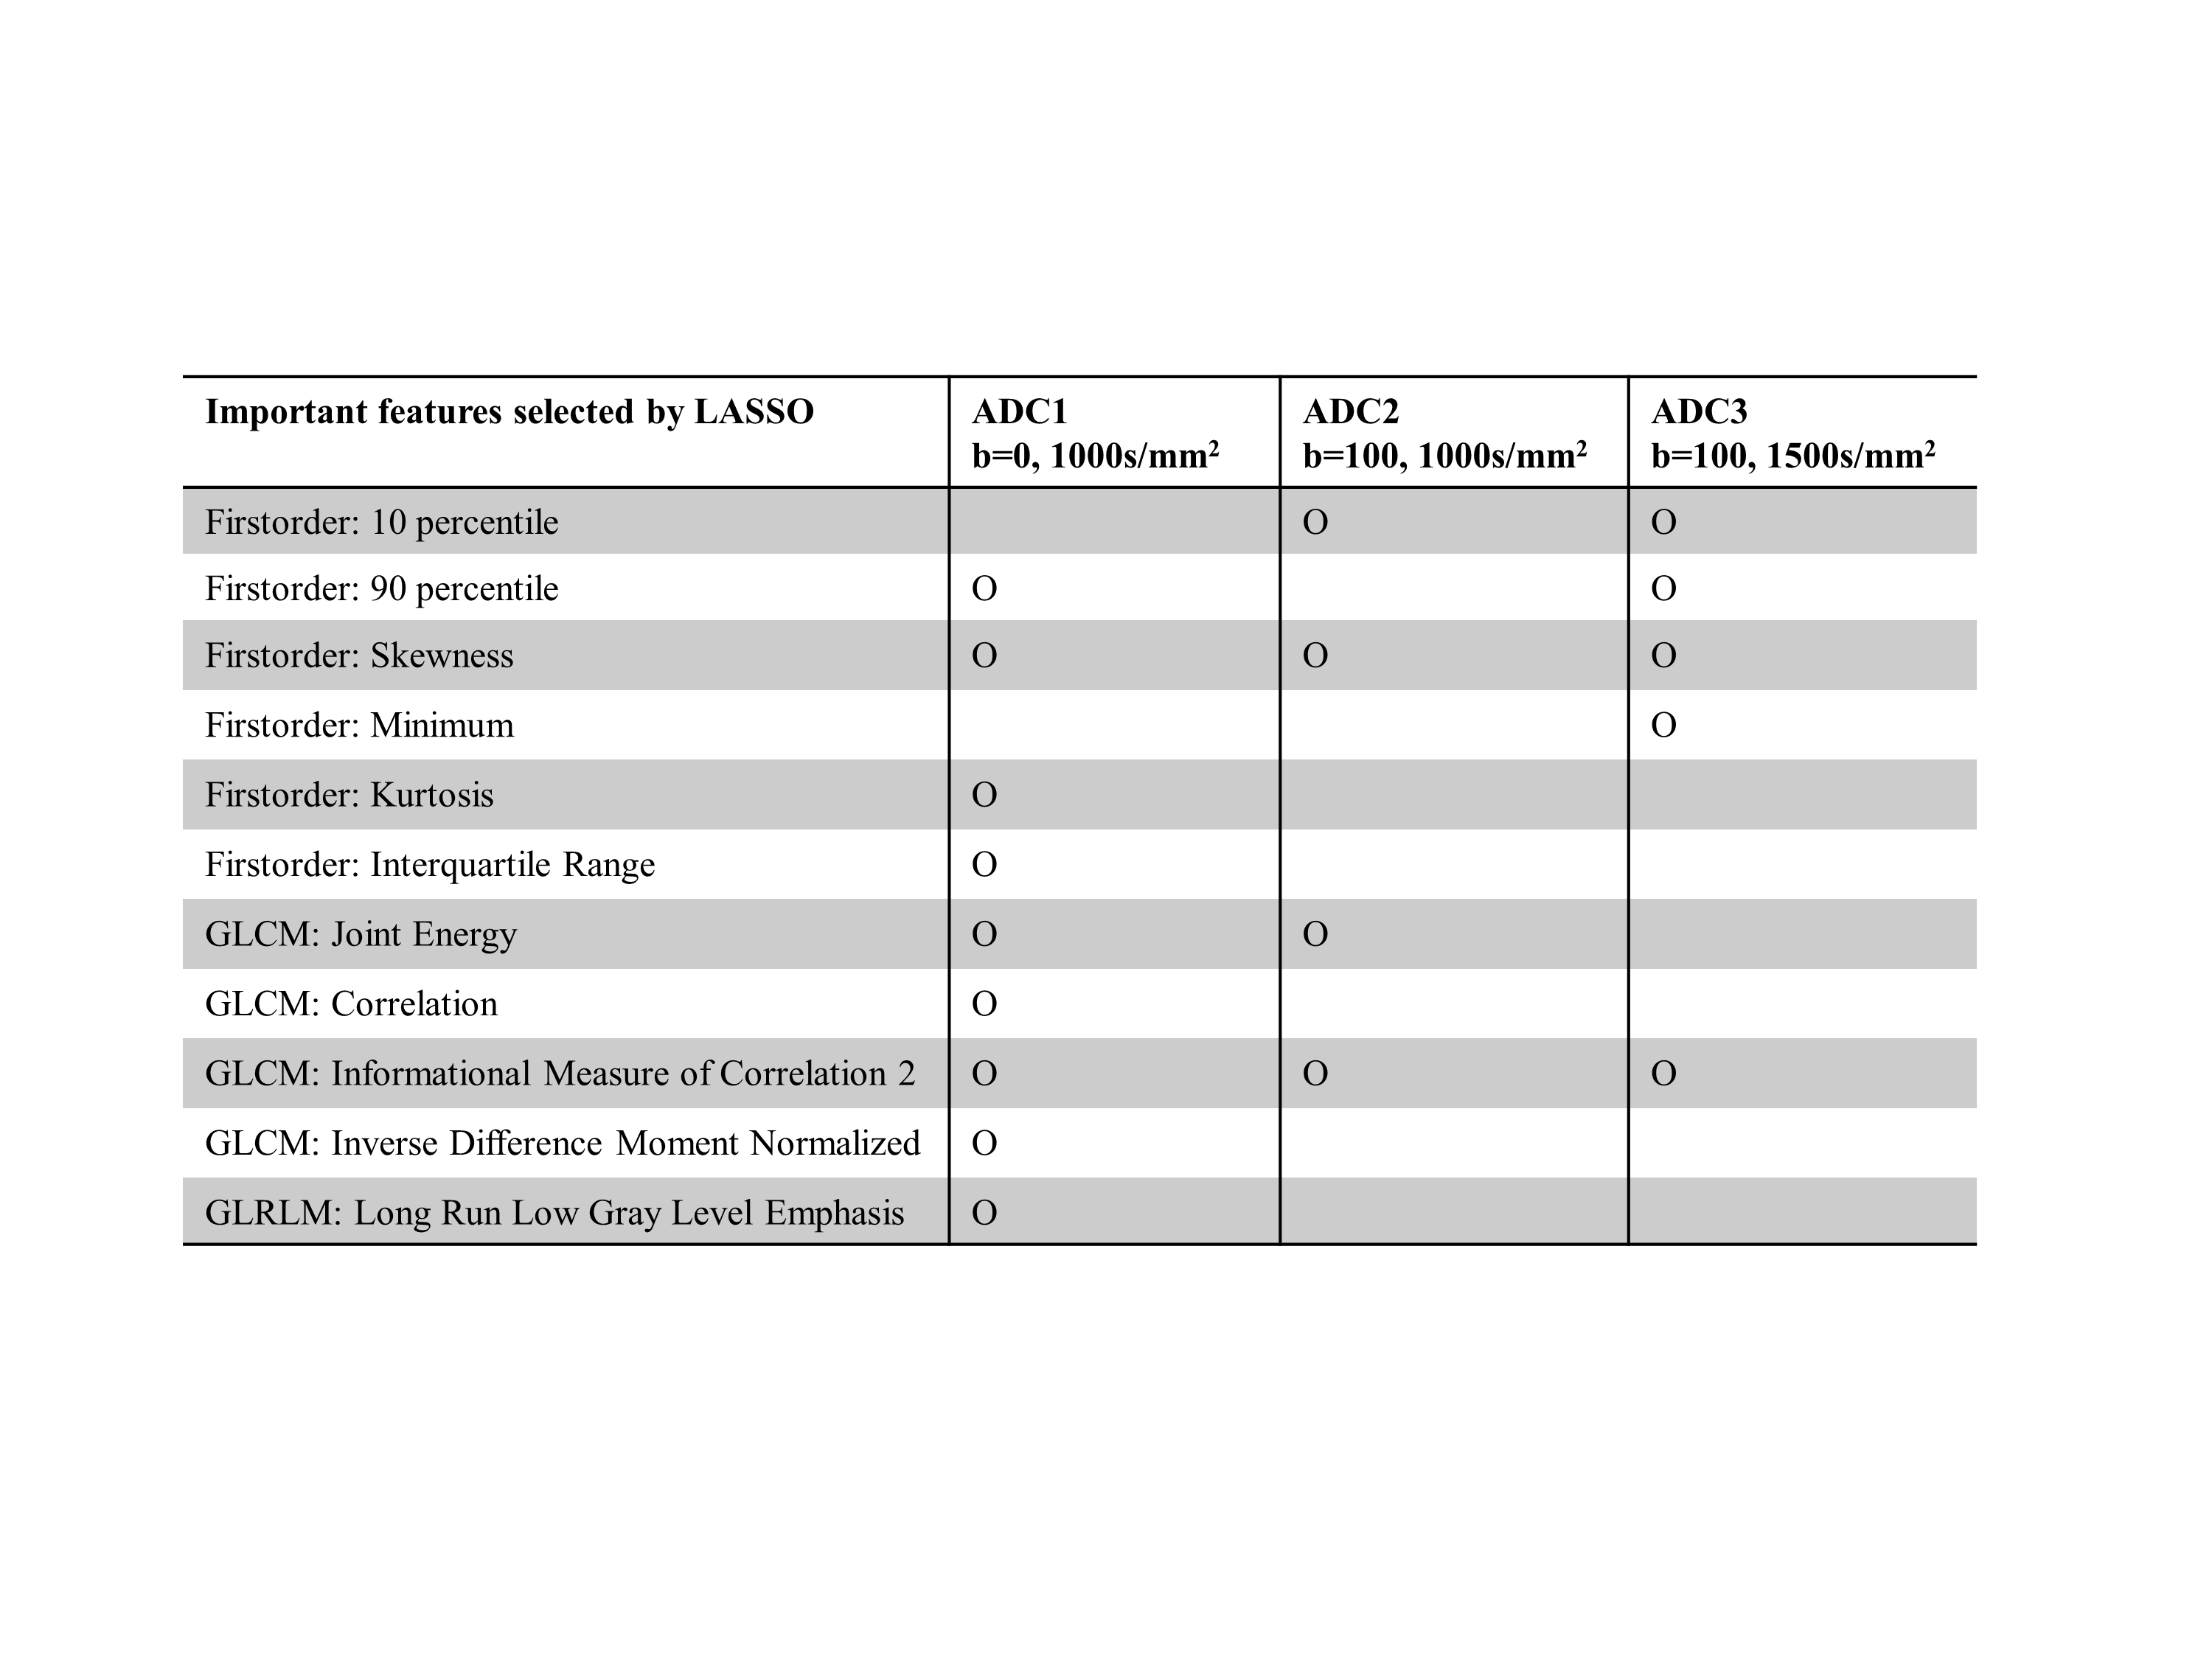
Figure 1 illustrates the axial slices of the ADC maps produced by b values of 0 and 1000s/mm2, 100 and 1000s/mm2 and 100 and 1500s/mm2, respectively. It should be noted that the cancer region has relatively lower ADC values than the benign region. Figure 2 displays a LASSO coefficient plot as a function of regularization. Among the 120 features, only 9 radiomics features were selected for ADC1, 4 for ADC2, and 5 for ADC3, respectively. Table 1 lists the radiomics features selected from LASSO. Some features were consistently chosen for all ADC maps, while some features were characteristic only to a specific ADC map. Table 2 displays R-squared, a goodness-of-fit measure for a LASSO regression model, classification accuracy (CA) and AUC of the three ADC maps. While ADC2 yielded the highest classification accuracy and AUC, ADC3 yielded the lowest accuracy and AUC.Discussion
The aim of this study was to differentiate prostate cancer from benign tissues using radiomics in ADC maps that were produced by various combinations of b-values. The three different ADC maps were evaluated independently to compare the diagnostic performance of ADC maps using radiomics features. Overall, the ADC radiomics features with LASSO regularization effectively discriminated prostate cancer from the benign tissues. We also discovered that each ADC map revealed different radiomics features that were characteristic to prostate cancer and that ADC with b = 100 and 1000s/mm2 was most effective in discriminating prostate cancer from the benign tissues, which yielded the classification accuracy and AUC of 88.6% and 0.888, respectively. The limitations of the study include small sample size and the use of single modality. Future studies should involve more number of samples to improve reliability of classification accuracy and individual diagnostic power of the disease. Furthermore, the effect of multi-modal radiomics should be considered, as T2-weighted images and high b-value DWI are also known to be useful for prostate cancer diagnosis.Conclusion
This study introduced the feasibility of radiomic features in discriminating prostate cancer from the benign regions using ADC maps. We also compared the effect of b-value combinations on ADC maps and discovered that ADC produced by the combination of b = 100 and 1000s/mm2 was most effective in differentiating prostate cancer from the benign tissues.Acknowledgements
This work was supported by the National Research Foundation of Korea (NRF) under Grant (2018R1D1A1B07050160).
References
[1] Weinreb JC, Barentsz JO, Choyke PL, Cornud F, Haider MA, Macura KJ, Margolis D, Schnall MD, Shtern F, Tempany CM, Thoeny HC, Verma S. PI-RADS Prostate Imaging – Reporting and Data System: 2015, Version 2. European Urology 69 (2016) 16-40
[2] Bonekamp D, Kohl S, Wiesenfarth M, Schelb P, Radtke JP, Gotz M, et al. Radiomic Machine Learning for Characterization of Prostate Lesions with MRI: Comparison to ADC Values. Radiology. 2018 Oct;289(1):128-37.
[3] Gillies RJ, Kinahan PE, Hricak H. Radiomics: Images Are More than Pictures, They Are Data. Radiology. [Research Support, N.I.H., Extramural Research Support, Non-U.S. Gov't]. 2016 Feb;278(2):563-77.
[4] Griethuysen, J. J. M., Fedorov, A., Parmar, C., Hosny, A., Aucoin, N., Narayan, V., Beets-Tan, R. G. H., Fillon-Robin, J. C., Pieper, S., Aerts, H. J. W. L. (2017). Computational Radiomics System to Decode the Radiographic Phenotype. Cancer Research, 77(21), e104–e107. `https://doi.org/10.1158
[5] Robert Tibshirani. Regression Shrinkage and Selection via the Lasso, Journal of the Royal Statistical Society. Series B (Methodological) Vol. 58, No. 1 (1996), pp. 267-288
[6] Scikit-learn: Machine Learning in Python, Pedregosa et al., JMLR 12, pp. 2825-2830, 2011.
Figures