4561
Investigating multi-compartment diffusion MRI models in the cervical spinal cord of multiple sclerosis patients1Vanderbilt University Institute of Imaging Science, Nashville, TN, United States, 2Radiology and Radiological Sciences, Vanderbilt University Medial Center, Nashvillet, TN, United States, 3Hyperfine Research Inc, Guilford, CT, United States, 4Neurology, Vanderbilt University Medical Center, Nashville, TN, United States, 5Biomedical Engineering, Vanderbilt University, Nashville, TN, United States, 6Radiology and Radiological Sciences, Vanderbilt University Medical Center, Nashville, TN, United States, 7Electrical Engineering, Vanderbilt University, Nashville, TN, United States, 8Radiology and Radiological Sciences, Vanderbilt University, Nashville, TN, United States
Synopsis
We investigate multi-compartment diffusion MRI models in the in vivo spinal cord of multiple sclerosis (MS) patients. We find significant differences in diffusion measures of tissue microstructure and diffusivity indices between healthy controls (N=21) and MS patients (N=12). We also explore their relationships to clinical data, including disability scores, 25-foot walk tests, and disease duration, and note unique trends in these measures with increasing disability. These models may enable improved in vivo characterization of the spinal cord in MS patients and enable quantification of changes in meaningful tissue microstructure indices.
Introduction
Conventional MRI techniques of the spinal cord (SC) are sensitive to lesions and atrophy caused by multiple sclerosis (MS), but lack specificity to underlying axonal pathology. In contrast, multi-compartment diffusion MRI (dMRI) models offer novel indices sensitive to the tissue microstructure. Specifically, two clinically feasible advanced diffusion MRI techniques – neurite orientation dispersion and density imaging (NODDI)1 and multi-compartment microscopic dMRI spherical means technique (SMT)2–have shown promise in providing meaningful indices of tissue microstructure3 and enabling new contrasts with potentially improved characterization of the SC in MS4. While few studies have investigated the feasibility of these approaches in MS patients in vivo5,6, a thorough analysis of microstructural differences between MS and healthy controls (HCs), or differences in MS populations, has not been performed in the SC7. Here, we assess differences in diffusion tensor imaging (DTI), NODDI, and SMT SC-derived metrics between patients and HCs and relationships between imaging and clinical data.Methods
AcquisitionSC scans on 21 healthy controls and 12 relapsing-remitting MS patients were performed on a 3.0T MR scanner (Philips Achieva). dMRI was performed centered at the C3 level, acquiring a single slice using a SS-DWI-EPI sequence with the following parameters: TR/TE=3 beats (~3000 ms)/65 ms, resolution=1.25x1.25 mm2, slice thickness=10mm, FOV=68x52mm, SENSE=1.5, NEX=3. Two b‐shells were acquired, including b=711s/mm2 with 32 directions and a b=2855s/mm2 with 64 directions. Total acquisition time was 18min 11s.
Image processing
A template-based analysis pipeline8 was implemented using the SC toolbox9 including motion and eddy current correction, and registration of each b0 image to the PAM50 template space10. Multi-compartment modeling for NODDI, SMT, and DTI were performed in subject-space, and parameters transformed to template-space, resulting in all measures aligned with the PAM50 gray matter (GM) and white matter (WM) labels.
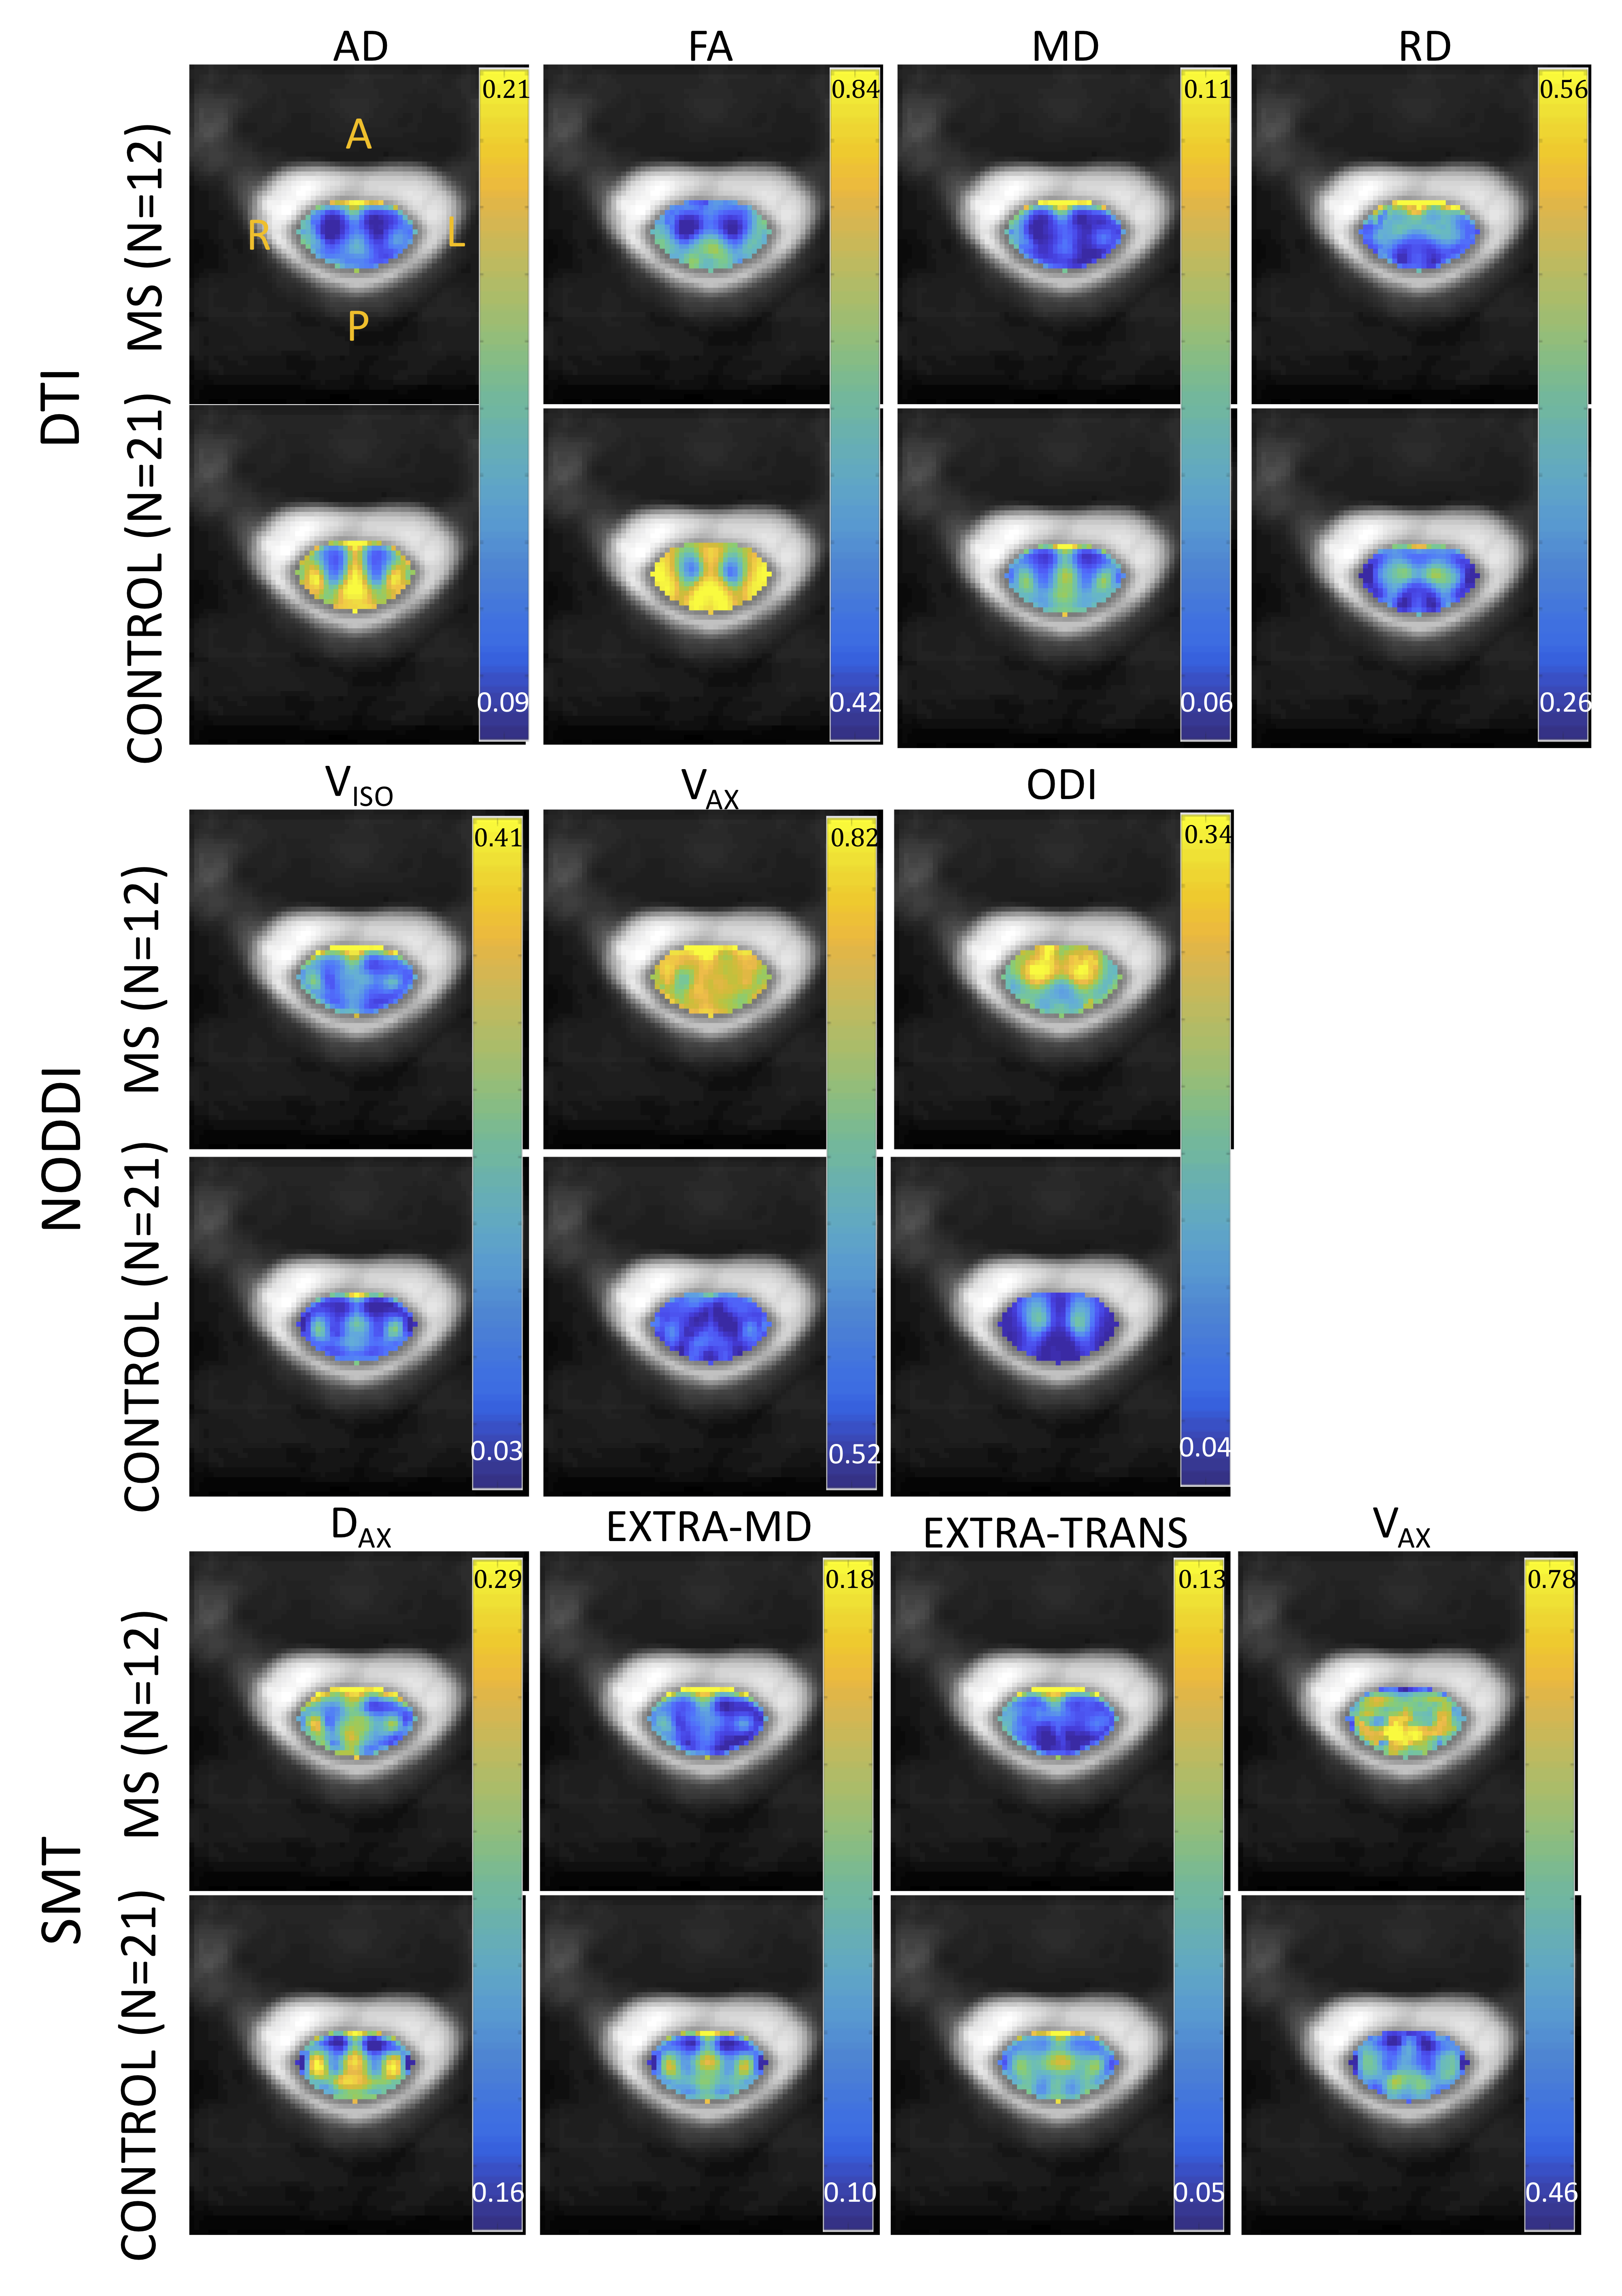
NODDI indices include isotropic volume fraction (Viso) representing the volume fraction of free water, apparent intra-cellular volume fraction (Vax) of dendrites and axons, and an orientation dispersion index (ODI) describing the spread of axons around a central orientation.
SMT results in maps of the apparent intra-axonal volume fraction (Vax), the intrinsic diffusivity (Dax), and diffusivities associated with the extra-axonal compartment including the transverse (EXTRA-TRANS) and mean diffusivity (EXTRA-MD). DTI results in radial, axial, and mean diffusivities (RD, AD, MD, respectively), and fractional anisotropy (FA).
Quantitative analysis
Quantitative analysis includes characterizing each diffusion index for MS patients and controls over the full cord (i.e., 10mm slice centered on C3), all WM, and all GM. Clinical indices include: the expanded disability status scale (EDSS), the 25- foot timed walking test, and the duration of disease. Pearson’s linear correlation coefficients between clinical measures and all diffusion indices were calculated for the full cord, all WM, and all GM across all subjects.
Results
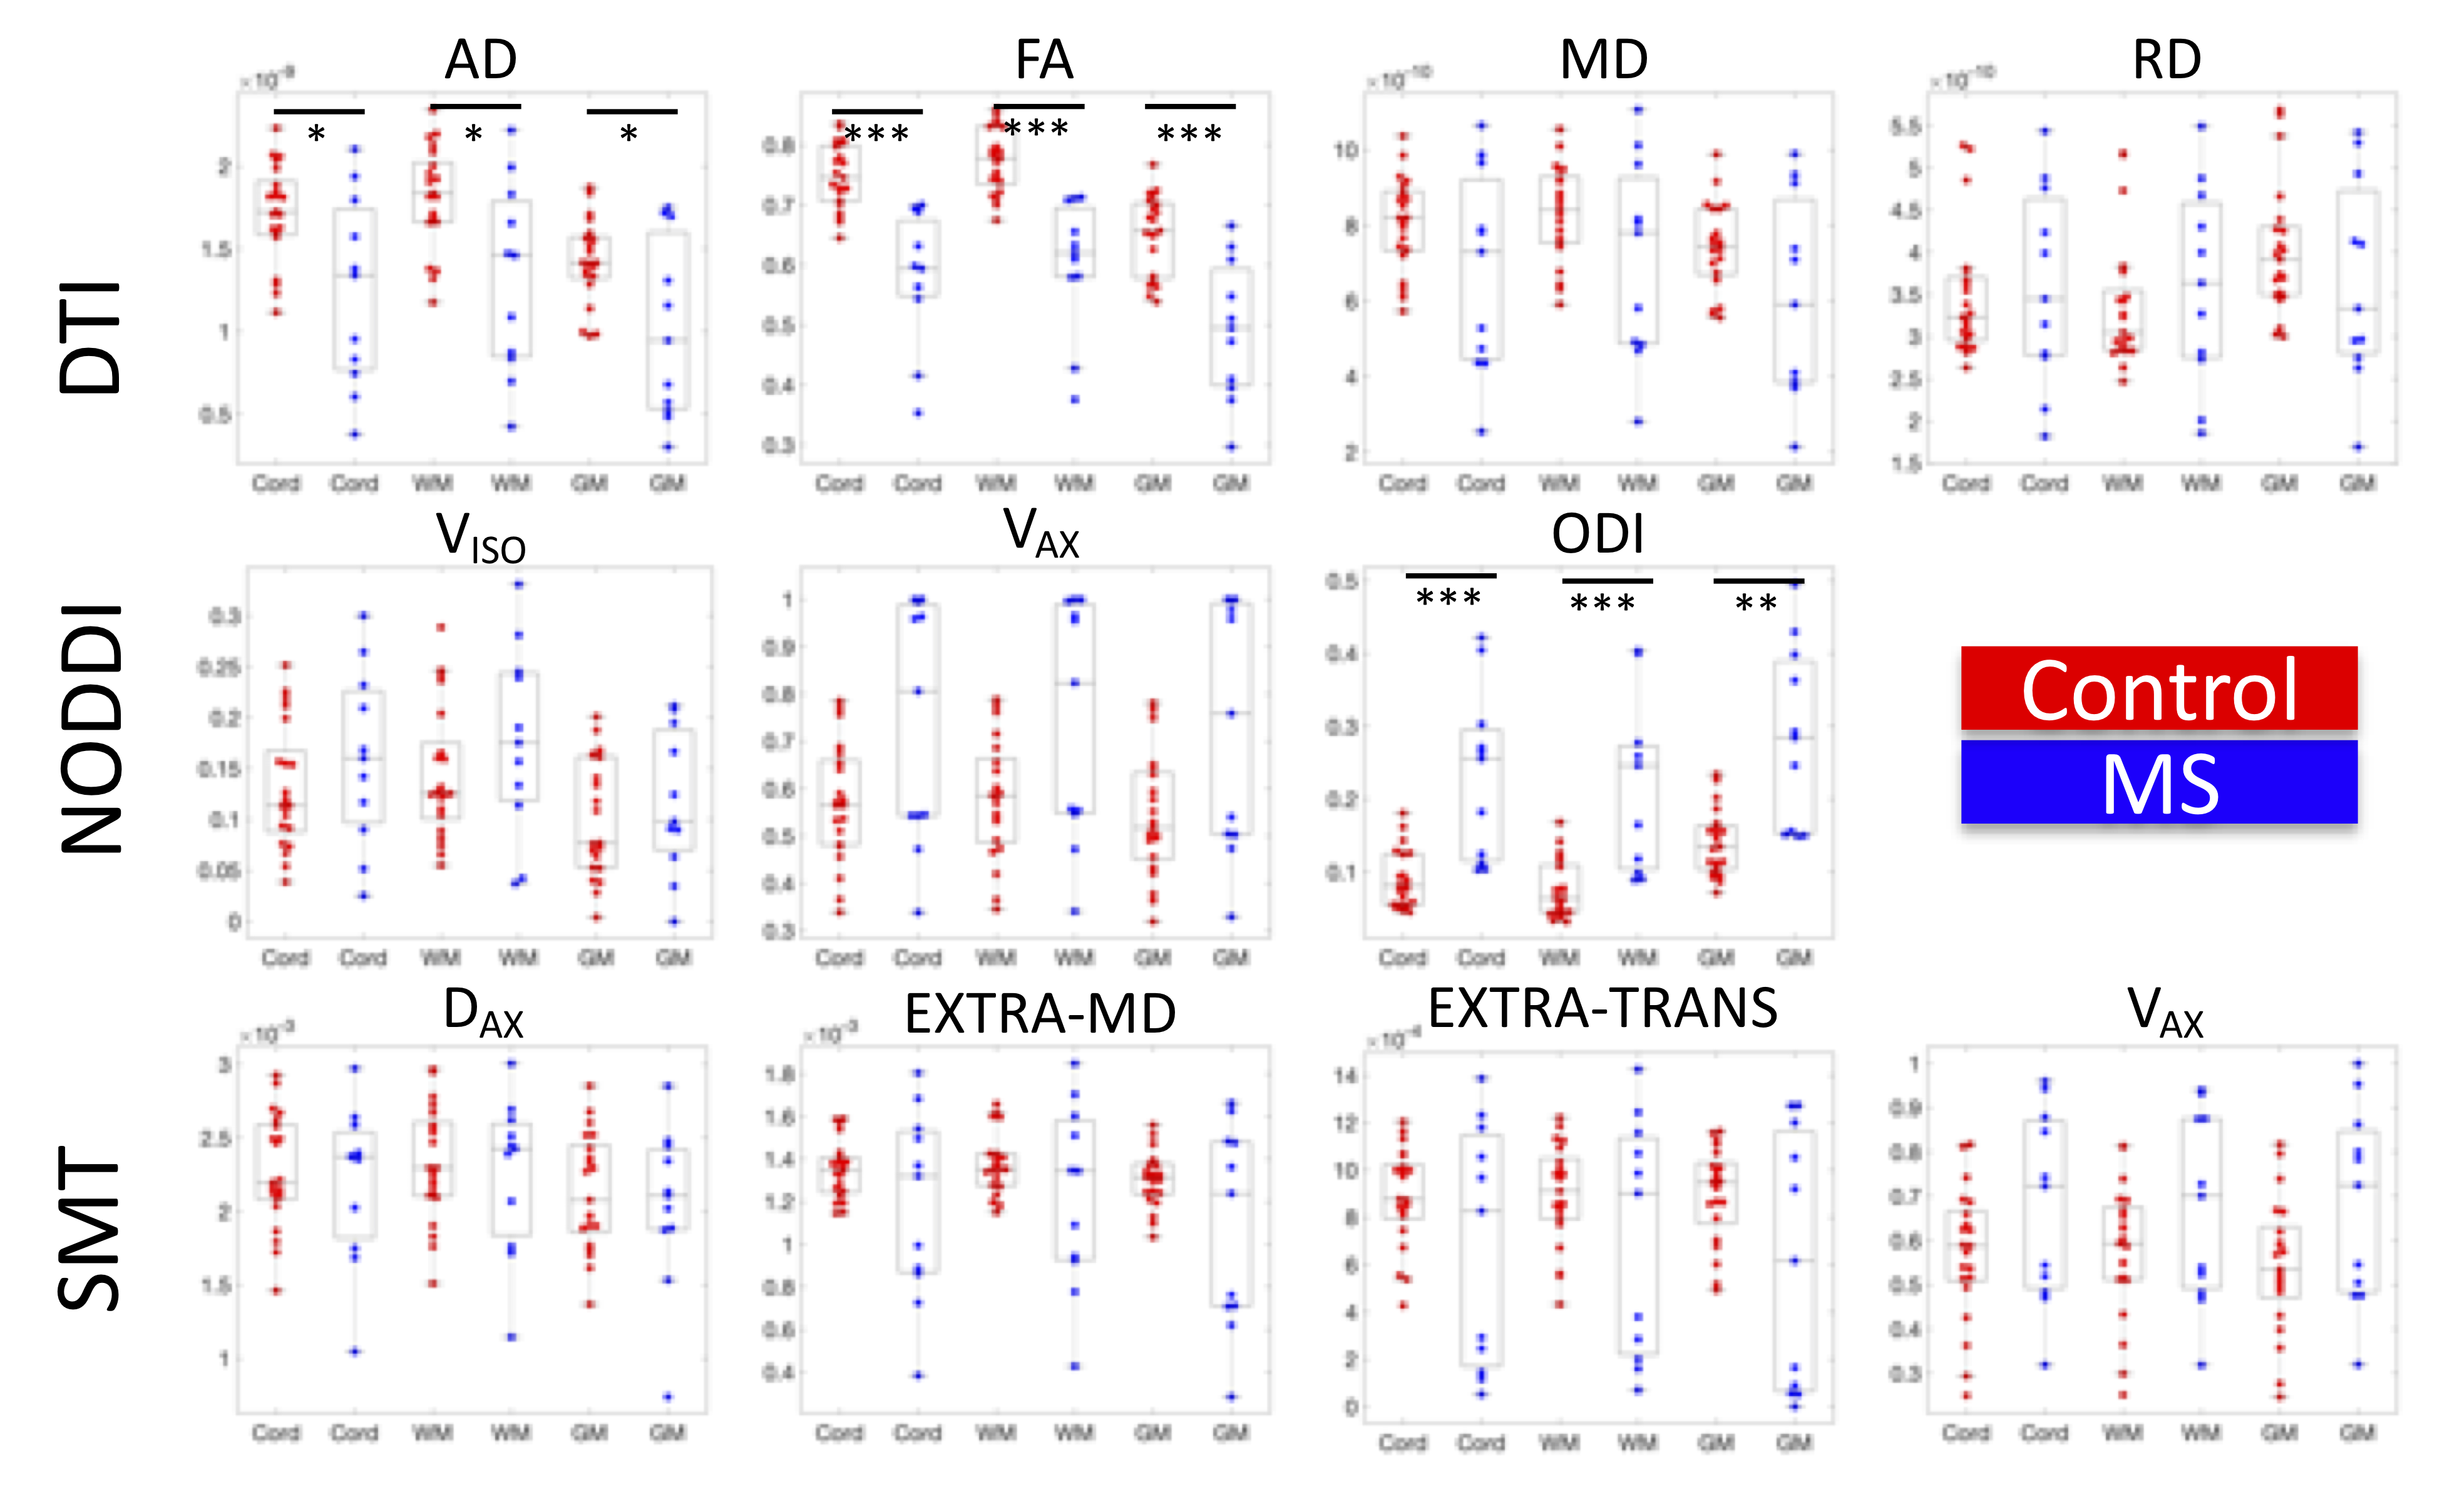
Figure 1 shows the population-average of all measures in template space for DTI, NODDI, and SMT, for both MS patients (N=12) and controls (N=21). Each index is shown at the same scale for both populations. Qualitatively, GM/WM contrast is visible in all indices, and clear differences between healthy and MS are apparent for all contrasts and tissue types.Indices are shown for each subject in Figure 2. While most measures show trends in MS, significant differences are found with decreased AD, decreased FA, and increased ODI in MS patients relative to controls. Notably, it is clear that a number of outliers exist in the multi-compartment models (for example Vax=1, or large variations in diffusivities) likely due to assumptions made in modeling that are violated in diseased states (fixed diffusivities), or low SNR in SC images.
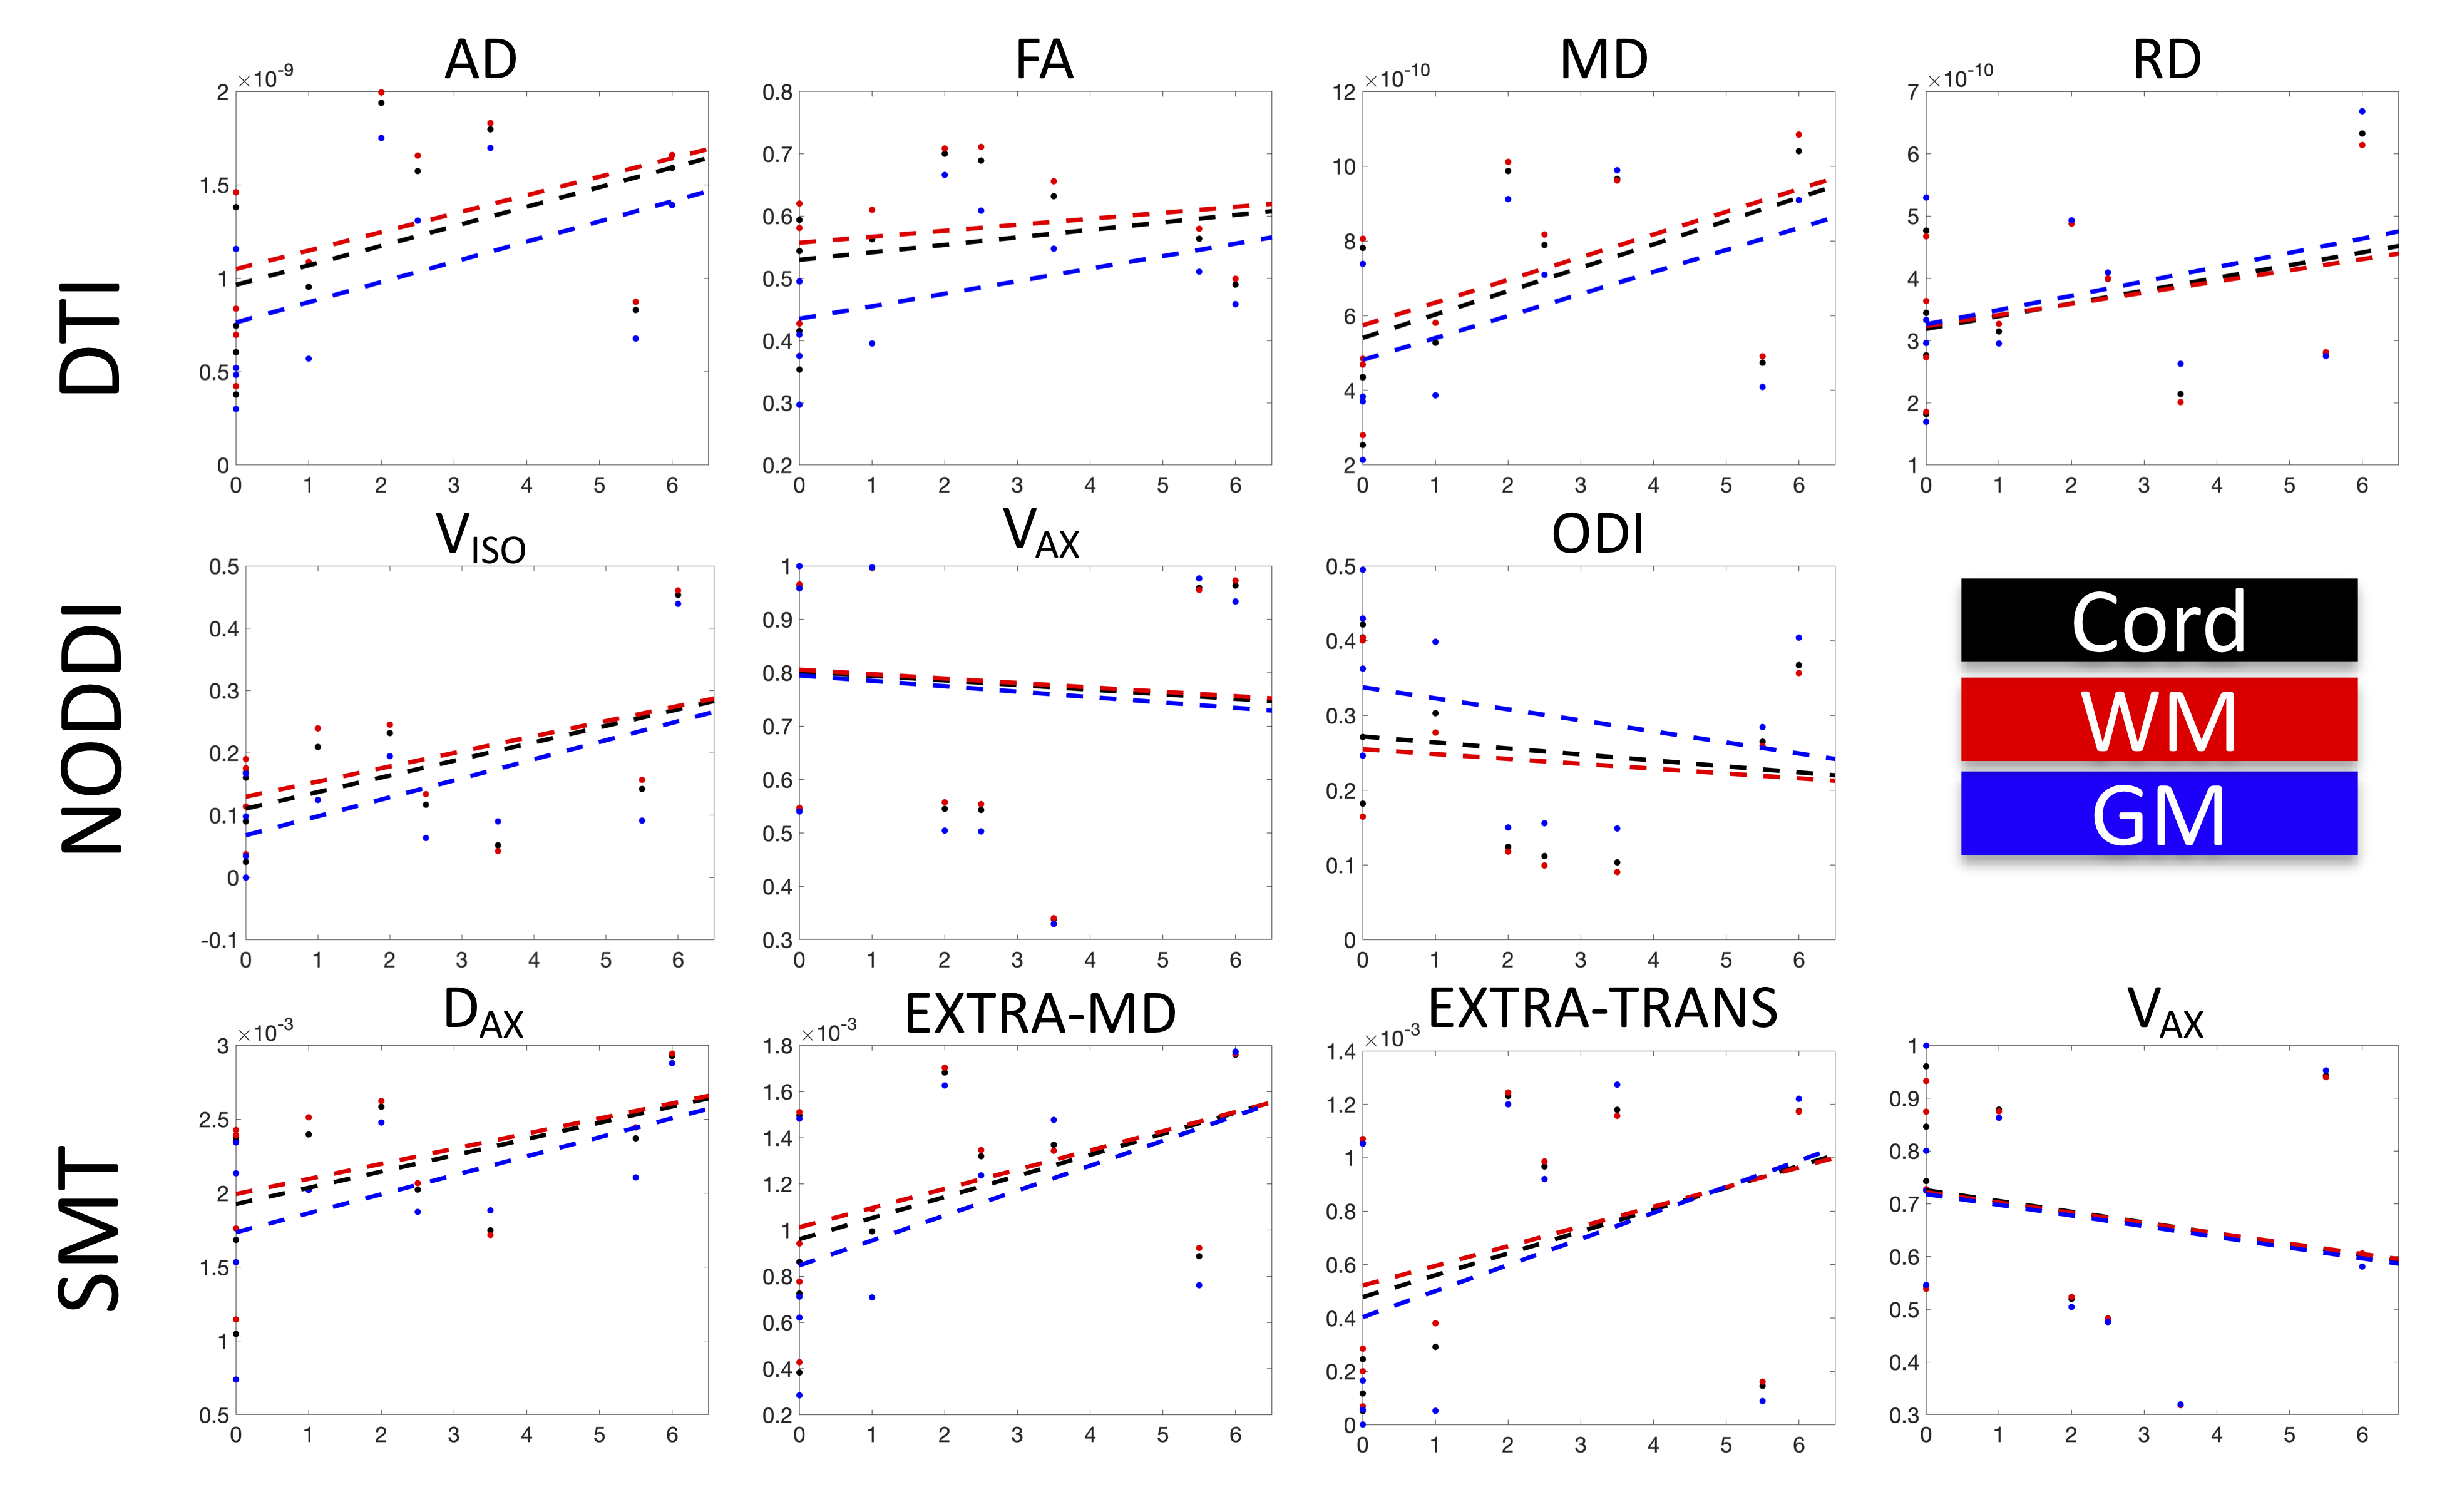
No significant linearcorrelations were found with EDSS score (Figure 3). However, it is clear that many indices show quadratic relationships with disability (notably Aikike’s information criteria for AD, FA, ODI, and Vax suggest a quadratic rather than linear fit, with FA and ODI statistically improved quadratic fits over intercept-only models, f=5.70,p=0.03 and f=5.81,p=0.03 respectively). For the timed 25-ft walk test, the only significantly correlated variable was a decrease in WM FA with increasing time, with no significant correlations with disease duration (not shown).
Discussion and Conclusion
We assess multi-compartment dMRI models in the SC of MS patients, finding significant differences between metrics averaged over MS and HCs. However, some differences may be driven by inadequate assumptions, fits, or appropriateness of the model with regards to anatomy and imaging – for example, several models reach their extreme values in MS subjects over much of the cord.Notably, AD, FA, and ODI show significant differences in the MS cord, in both WM and GM. While no significant linear correlations with clinical disability were found, these relationships deserve further attention. For example, many indices show biphasic trends, with microstructure (or fitted indices) reversing trends from EDSS=0-3.5, and EDSS>4. Data are better fit by quadratic functions, which may suggest bi-phasic microstructural changes (possibly transitions from axon swelling to collapse and atrophy) associated with disability. Future studies should investigate these trends, include a greater number of subjects, assess both normal and non-normal appearing tissue, and fit other applicable signal models of diffusion.
Overall, this study shows the potential of advanced multi-compartment models to provide new insight into tissue microstructural changes and improve characterization of MS and its progression.
Acknowledgements
This work was supported by the National Institutes of Health under award numbers R21 NS087465-01, R01 EY023240, R01EB017230 and T32EB001628, by the National Multiple Sclerosis Society award number RG-1501-02840, the Department of Defense award number W81XWH-13-0073, and in part by the National Center for Research Resources grant UL1 RR024975-0.References
1. Zhang, H., et al., NODDI: practical in vivo neurite orientation dispersion and density imaging of the human brain.Neuroimage, 2012. 61(4): p. 1000-16.
2. Kaden, E., et al., Multi-compartment microscopic diffusion imaging.Neuroimage, 2016. 139: p. 346-359.
3. Grussu, F., et al., Neurite dispersion: a new marker of multiple sclerosis spinal cord pathology?Ann Clin Transl Neurol, 2017. 4(9): p. 663-679.
4. Grussu, F., et al., Neurite orientation dispersion and density imaging of the healthy cervical spinal cord in vivo.Neuroimage, 2015. 111: p. 590-601.
5. By, S., et al., Multi-compartmental diffusion characterization of the human cervical spinal cord in vivo using the spherical mean technique.NMR Biomed, 2018. 31(4): p. e3894.
6. By, S., et al., Application and evaluation of NODDI in the cervical spinal cord of multiple sclerosis patients.Neuroimage Clin, 2017. 15: p. 333-342.
7. Bagnato, F., et al., Probing axons using multi-compartmental diffusion in multiple sclerosis.Ann Clin Transl Neurol, 2019. 6(9): p. 1595-1605.
8. Schilling, K.G., et al., Diffusion MRI microstructural models in the cervical spinal cord - Application, normative values, and correlations with histological analysis.Neuroimage, 2019. 201: p. 116026.
9. De Leener, B., et al., SCT: Spinal Cord Toolbox, an open-source software for processing spinal cord MRI data.Neuroimage, 2017. 145(Pt A): p. 24-43.
10. De Leener, B., et al., PAM50: Unbiased multimodal template of the brainstem and spinal cord aligned with the ICBM152 space.Neuroimage, 2018. 165: p. 170-179.
Figures