4560
Intravoxel incoherent motion and diffusion kurtosis imaging in the assessment of pathological grades of clear cell renal cell carcinoma1Department of Radiology, Clinical Medical School of Yangzhou University, Northern Jiangsu People’s Hospital, Yangzhou, 457, China, 2GE Healthcare, MR Research China, Beijing, China
Synopsis
In this study, we aimed to investigate whether intravoxel incoherent motion (IVIM) and diffusion kurtosis imaging (DKI) techniques can be used to evaluate the pathological grade of clear cell renal cell carcinoma (ccRCC) patients preoperatively. As a result, the IVIM-related parameters (ADC, apparent diffusion coefficient; D, true diffusivity) and DKI-related parameters (MD, mean diffusivity; MK, mean kurtosis) have shown significant differences between low- and high-grade ccRCC(0.58±0.11 vs 0.48±0.08, 1.39±1.18 vs 0.98±0.21, 2.12±0.35 vs 1.59±0.32, 0.53±0.13 vs 1.59±0.32; p<0.05). Therefore, IVIM and DKI techniques can be used effective tools to differentiate low- and high-grade ccRCC.
INTRODUCTION
Different clear cell renal cell carcinoma (ccRCC) grades show diverse biological behaviors and variable clinical outcomes 1. Pre-surgical evaluation of ccRCC malignancy plays an important role in treatment decision-making.IVIM and DKI can clarify the tumour microstructural condition and provide useful information to determine the treatment effect. Several previous studies have used intravoxel incoherent motion (IVIM) or diffusion kurtosis imaging (DKI) to evaluate the diagnostic values for ccRCC grading 2,3. However, no systematic comparison of these different diffusion parameters has been implemented in the differentiation of ccRCC grades.
Hence, the present study aimed to quantitatively compare the parameters obtained from IVIM and DKI for ccRCC grading.
METHODS
SubjectsIn total, 148 patients (median age, 55 years old; range, 31-83 years old) known or suspected to have renal tumors were recruited in this study. Certain exclusion criteria were defined as follows: (1) Patients didn’t receive operation or their histological finding were inadequate. (2) interval between MR examination and operation > one month.
MR experiments
All MR experiments were performed at a 3.0T MR system (Discovery 750, GE Healthcare, USA). IVIM and DKI imaging were performed on both kidneys after the corresponding T2 weighted anatomical images were acquired.
For IVIM, a single shot echo-planar imaging sequence was applied in the axial plane using respiratory triggering via a respiratory belt with 9 b-values (0, 30, 50, 80, 150, 300, 500, 800, and 1500 s/mm2). TR/TE,1000/57.9; field of view, 40×32 cm; matrix, 160×128; slice thickness, 6 mm; scan time, 3 min 26 s.
For DKI, a separate single-shot echo-planar imaging pulse sequence with respiratory triggering via a respiratory belt, in which 3 b-values (0, 1000 and 2000 s/mm2) with 30 diffusion directions for each b value were applied. TR/TE,4800/73.9; field of view, 40×32 cm; matrix, 128×128; slice thickness, 4 mm; scan time, 9 min 43 s.
Data analysis
All acquired IVIM and DKI data were separately analyzed using IVIM and DKI post-processing software developed under the Functool platform on GE ADW4.6 workstation.
Using the Bi-exponential decay model, the IVIM related parameters including apparent diffusion coefficient (ADC), true diffusivity (D), pseudo-diffusion coefficient (D*) and perfusion fraction (f) were calculated. Additionally, the DKI related parameters of mean diffusivity (MD) and mean kurtosis (MK) were also obtained.
Each region of interest (ROI) was placed at a solid area of the tumor on a representative slice with reference to T2-weighted images to exclude necrosis, cysts, hemorrhage, large vessels, edema, and calcifications. ROI values for all parameters were measured three times and the corresponding mean values were obtained for data analysis.
Statistical analyses were performed using SPSS (version22.0) and MedCalc software (version 15.8.0). Each parameter (ADC, D, D*, f, MK, MD) was compared between high-grade and low-grade ccRCC using Mann-Whitney U test. Receiver-operating characteristic analysis was also performed for all parameters to evaluate the diagnostic performance. Significance threshold was set as P<0.05 .
RESULTS
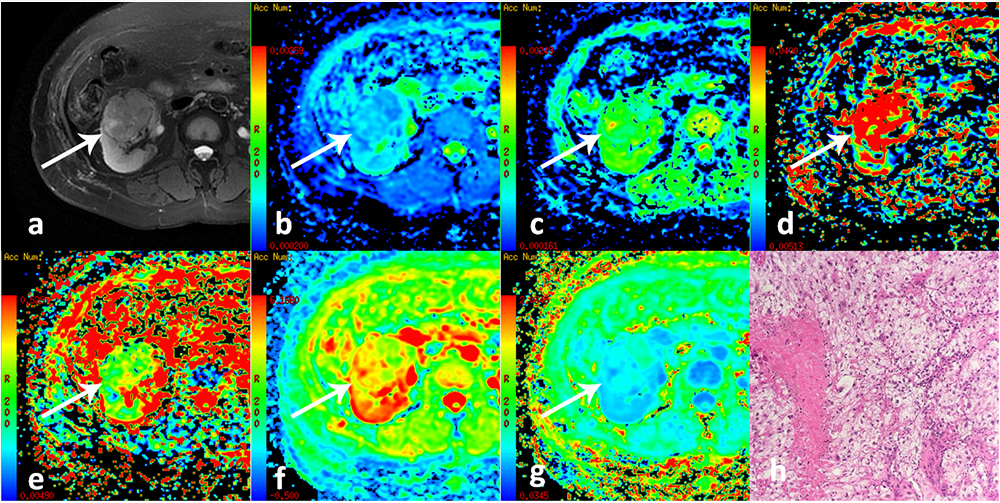
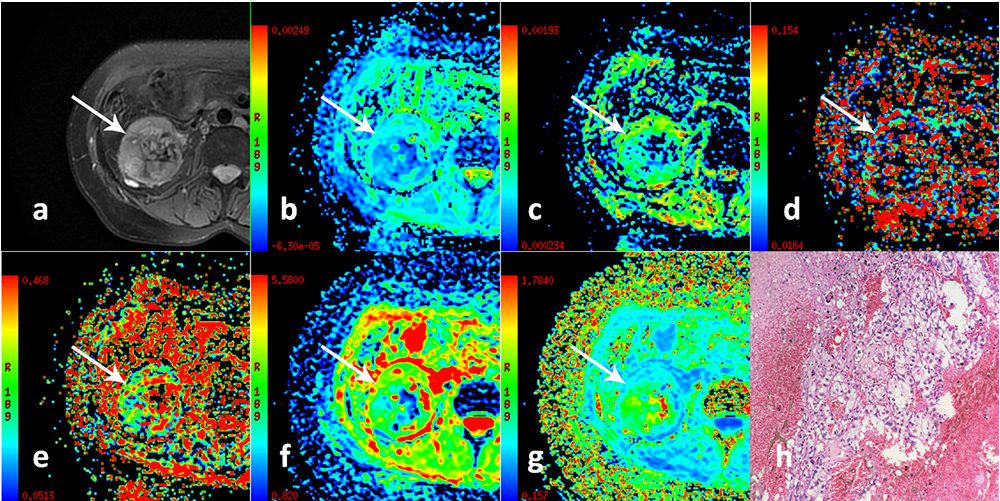
In total 37 low-grade patients(median age, 52 years old; range, 31-63 years old) and 23 high-grade patients(median age, 61.5 years old; range, 38-81 years old) were included for data analysis.Multiple diffusion parametric MR images of two representative patients with high- and low-grade ccRCC are shown in Figs 1 and 2, respectively. ADC, D and MD values were significantly lower for high-grade ccRCC compared to low-grade ccRCC (0.58±0.11vs0.48±0.08, 1.39±1.18vs0.98±0.21, 2.12±0.35vs1.59±0.32; P <0.05). For MK, an opposite pattern was found in high-grade ccRCC than low-grade ccRCC (0.53±0.13vs1.59±0.32, P <0.05). In contrast, comparable D* and f values were observed between these two groups (P >0.05).
Using ROC analysis, MD showed the largest area under the curve (AUC = 0.888), followed by ADC (AUC = 0.796), D(AUC = 0.780), MK(AUC = 0.736), f (AUC = 0.582) and D*(AUC = 0.533).
DISCUSSION
In this study, the diffusion parameters (ADC, D, MD, MK) showed significant differences between low- and high-grade ccRCCs. This may partly be explained by their histopathological characteristics. As the pathological grade increases, abnormal proliferation of cancer cells is greater and extracellular space is decreased. This leads to the molecular motion of water more restricted in tumor tissue. Furthermore, high tumor grades tend to be more proliferative, aggressive and heterogeneous. The nuclei have a larger size and show a more irregular appearance in high tumor grades, resulting in increased microstructural complexity.CONCLUSION
In conclusion, our study demonstrated that diffusion-related parameters (ADC, D, MD and MK) can be used to accurately differentiate low- and high-grade ccRCC. MD with the largest AUC might be the optimal indicator for ccRCC grading.Acknowledgements
None.References
1. Cheville J C , Lohse C M , Zincke H , et al. Comparisons of Outcome and Prognostic Features Among Histologic Subtypes of Renal Cell Carcinoma. The American Journal of Surgical Pathology, 2003; 27(5):612-624.
2. Zhang J, Suo S, Liu G, et al. Comparison of Monoexponential, Biexponential, Stretched-Exponential, and Kurtosis Models of Diffusion-Weighted Imaging in Differentiation of Renal Solid Masses. Korean Journal of Radiology, 2019; 20(5):791-800.
3. Lijuan S , Liangping Z , Xiaohang L , et al. Comparison of biexponential and monoexponential DWI in evaluation of Fuhrman grading of clear cell renal cell carcinoma. Diagnostic and Interventional Radiology, 2017; 23(2):100-105.
Figures