4559
Is ADC Measurement of Parotid Gland Tumor Sufficient using the Largest Slice rather than Whole Tumor1Master 's Program of Biomedical Informatics and Biomedical Engineering, Feng Chia University, Taichung, Taiwan, 2Department of Medical Imaging, China Medical University Hsinchu Hospital, Hsinchu, Taiwan, 3Department of Radiology, School of Medicine, College of Medicine, China Medical University, Taichung, Taiwan, 4Department of Computer Science and Information Engineering, National Taiwan University, Taipei, Taiwan, 5Department of Medical Imaging, Chinese Medical University Hsinchu Hospital, Hsinchu, Taiwan, 6Department of Electrical Engineering, National Taiwan University of Science and Technology, Taipei, Taiwan, 7Department of Automatic Control Engineering, Feng Chia University, Taichung, Taiwan
Synopsis
The study is to quantitatively compare the diagnostic ability of ADC in distinguishing three types of parotid tumor between the ADC measurement on slice with the largest tumor and whole tumor. This retrospective study enrolled 13 patient for each PMAs, WTs and MTs. All participants underwent 1.5-T fat-saturated EP-DWI. Our results show that ADC and AUC on largest slice and whole tumor were similar in three tumors. ADC of the slice with the largest tumor, which tumor size over 1/3 whole tumor volume, could instead the ADC of whole tumor to diagnosis the PMA, WT and MT in parotid gland.
Introduction
Magnetic susceptibility artifacts and motion artifacts are prominent in head and neck due to abundant air-soft tissue interface4, metallic implant 4,5, and involuntary bulk motion 6. Although single shot EP-DWI is susceptible to artifacts, it has been used to evaluate the diffusivity of parotid tumors in salivary glands since 2001.1-3. To avoid the influence of image distortion, the slice covering the largest area of the tumor is often the chose for ADC evaluation in daily practice. However, whether the largest slice is sufficient for distinguishing parotid tumors has never been investigated before. In this study, we observed whether image distortion of EPDWI has an impact on the ADC measurement for diagnosis of parotid tumors. We measured the ADC between the largest slice and all slices of the tumor. The ADC relationship between the two groups was investigated, and then we compared the diagnosis ability using ADC in the two groups.
Materials and Methods:
MR scan: A total of 39 patients including 13 patients who had the pleomorphic adenomas (PMA), 13 patients with Warthin's tumor (WT), and 13 patients with malignant tumor (MT) were enrolled. All MR scans were performed at a 1.5 T whole-body scanner (GE Healthcare, Signa HDx, US) using an 8NV head and neck array coil. A T2WI images for co-registration of all participants were scanned by FSE (TR/TE/NEX 3150/78/2, FOV: 250 mm, 512x512, 5 mm thickness). DWI images were obtained with motion-probing diffusion gradients (b factors, 0 and 1000 sec/mm2) applied in each of three orthogonal directions.
Data analysis: All MR data were digitally transferred from the MR unit console to a personal computer and processed with software developed in house by using Matlab (MathWorks, Natick, MA). One slice containing the largest area of the parotid tumor and total slices containing the whole parotid tumor were used for quantitative data analysis in each tumor, respectively. T2WI was used to be the reference image for quantitatively evaluating image distortion of EP-DWI. ADC maps were generated by using a pixel-wise calculation based on the following logarithmic equation: ADC = ln(SI0/SI1000)/(b1000 - b0), where SI0 and SI1000 were signal intensities of the DWI obtained with b values of 0 sec/mm2 (b0) and 1000 sec/mm2 (b1000), respectively. Region-of-interest of parotid tumors are manually drawn on b0 image. Mean ADCs of all pixels within ROI were used for comparison between the tumor in the largest slice and whole tumor. Statistical analysis: Statistical analysis was performed by using SPSS 12.0 (SPSS, Chicago, III) software. Wilcoxon signed-rank test and Mann-Whitney U test were used for comparison. Receiver operating characteristics (ROC) curve analysis with area under the curve (AUC) was used to assess the diagnostic performance in distinguishing PMAs WTs and MT based on ADC of EP-DWI. A P value less than 0.05 was considered as statistically significant.
Result
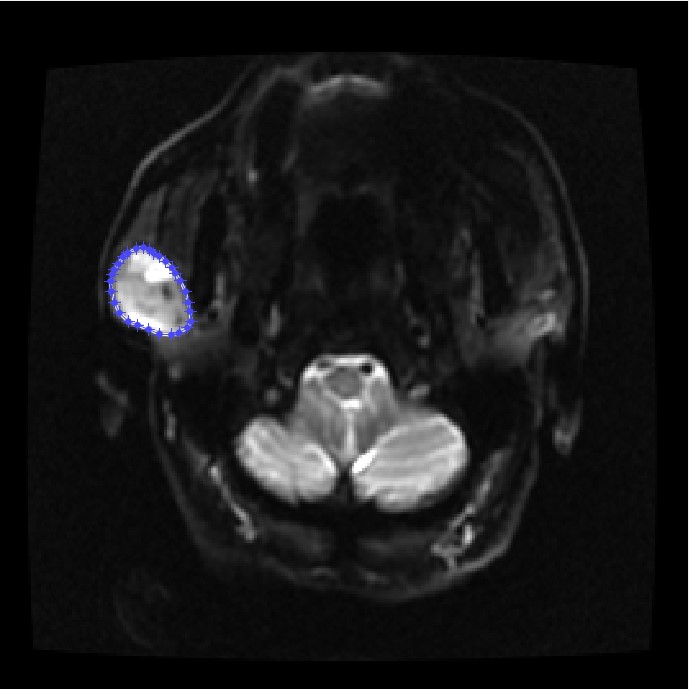
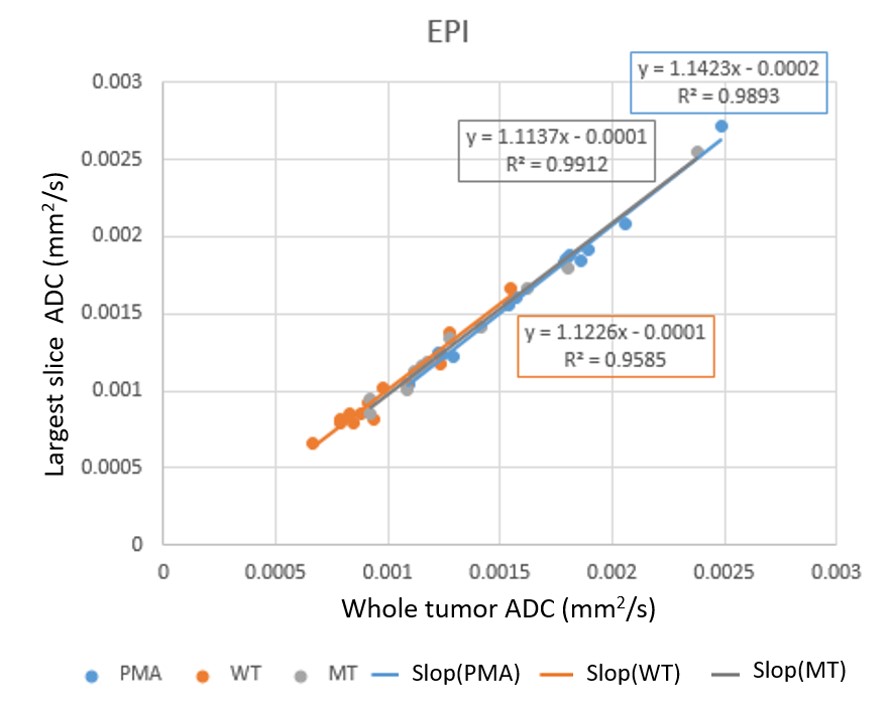
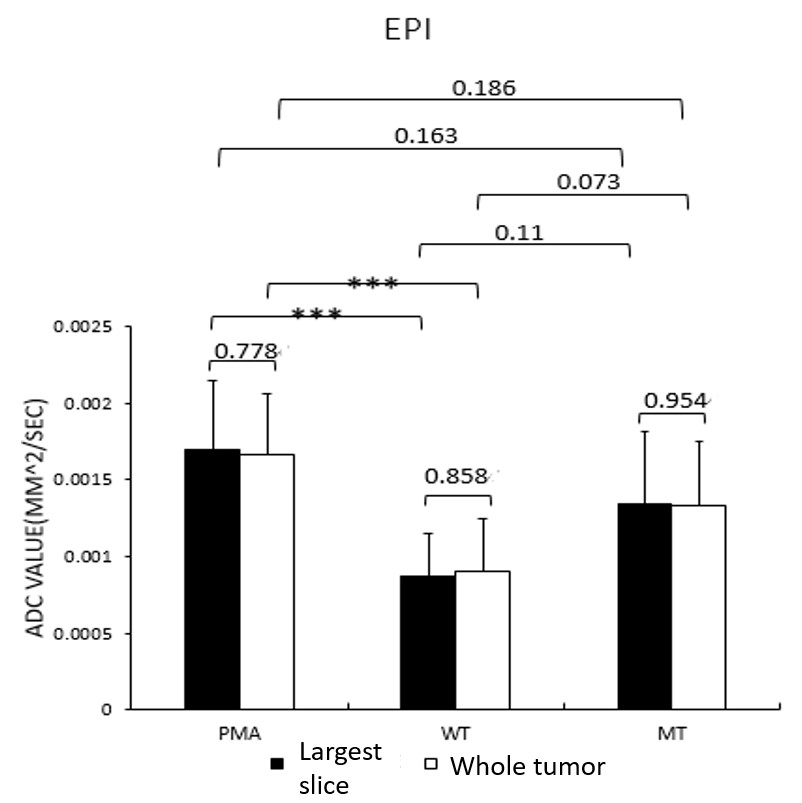
Fig. 1 displayed the ROI contouring of one case on b0 image for ADC measurement. The ratios (mean and standard deviation) between tumor area in the largest slice and whole tumor area were in PMA, WT, and MT were 0.40±0.07, 0.35±0.0, and 0.36±0.13, respectively. Fig. 2 showed the linear regression between the largest slice and whole tumor in PMA, WT, and MT. Fig. 3 illustrated ADC of PMAs, WTs, and MTs measured by EP-DWI. Fig. 4. plotted ROC curves of PMA (orange), WT (res) and MT (blue) in distinguishing one from others. Both the largest slice and whole tumor allowed distinguishing PMAs, WTs and MTs from the others using ADC with an AUC of 0.871, 0.911 and 0.542 in the largest slice and 0.883, 0.855 and 0.529 in the whole tumor, respectively (P<0.0001)
Acknowledgements
The study was supported partly from the Ministry of Science and Technology, R. O. C. under the Grant No. MOST 107-2314-B-039 -071 - & 108-2314-B-039 -014 -
References
1. Wang J, Takashima S, Takayama F, et al. Head and neck lesions: characterization with diffusion-weighted echo-planar MR imaging. Radiology. 2001;220(3):621-30.
2. Eida S, Sumi M, Sakihama N, Takahashi H, Nakamura T. Apparent diffusion coefficient mapping of salivary gland tumors: prediction of the benignancy and malignancy. AJNR Am J Neuroradiol. 2007;28(1):116-21.
3. Habermann CR, Arndt C, Graessner J, et al. Diffusion-weighted echo-planar MR imaging of primary parotid gland tumors: is a prediction of different histologic subtypes possible? AJNR Am J Neuroradiol. 2009;30(3):591-6.
4. Juan CJ, Chang HC, Hsueh CJ, et al. Salivary glands: echo-planar versus PROPELLER Diffusion-weighted MR imaging for assessment of ADCs. Radiology. 2009;253(1):144-52.
5. Chang HC, Juan CJ, Chiu HC, et al. Parotid fat contents in healthy subjects evaluated with iterative decomposition with echo asymmetry and least squares fat-water separation. Radiology. 2013;267(3):918-23.
6. Liu YJ, Lee YH, Chang HC, et al. A potential risk of overestimating apparent diffusion coefficient in parotid glands. PLoS One. 2015;10(4):e0124118.
Figures