4557
Quantitative assessment of thyroid and parathyroid lesions by using ZOOMit-based IVIM, DKI and DWI1Department of Radiology, Shandong Provincial Hospital Affiliated to Shandong University, Jinan, China, 2Shandong University, Jinan, China, 3MR Scientific Marketing, Diagnostic Imaging, Siemens Healthcare Ltd, Shanghai, China, 4MR Scientific Marketing, Diagnostic Imaging, Siemens Healthcare Ltd, Beijing, China, 5MR Application, Siemens Healthcare Ltd, Jinan, China
Synopsis
The aim of this study was to evaluate the diagnostic performance of three advanced diffusion techniques (IVIM, DKI and DWI) which based on ZOOMit in demonstrating lesions in thyroid and parathyroid area. Results showed that D* in IVIM, MK in DKI and ADC in DWI were superior than other diffusion parameters (D, F in IVIM, MD in DKI) in accurately locating lesions as well as differentiating between lesions and normal thyroid parenchyma.
Purpose
ZOOMit DWI is a special sequence that uses two-channel parallel transmission (pTx) with focused excitation [1]. The current study aimed to investigate whether ZOOMit-based IVIM, DKI and DWI are feasible in predicting abnormal lesions in thyroid and parathyroid regions, as well as to compare their diffusion parameters, namely tissuse diffusivity (D), perfusion fraction (F) and pseudo-diffusion coefficient (D*) in IVIM, mean kurtosis (MK) and mean diffusivity (MD) in DKI, and apparent diffusion coefficient (ADC) in DWI, between lesions and normal parenchyma.Methods
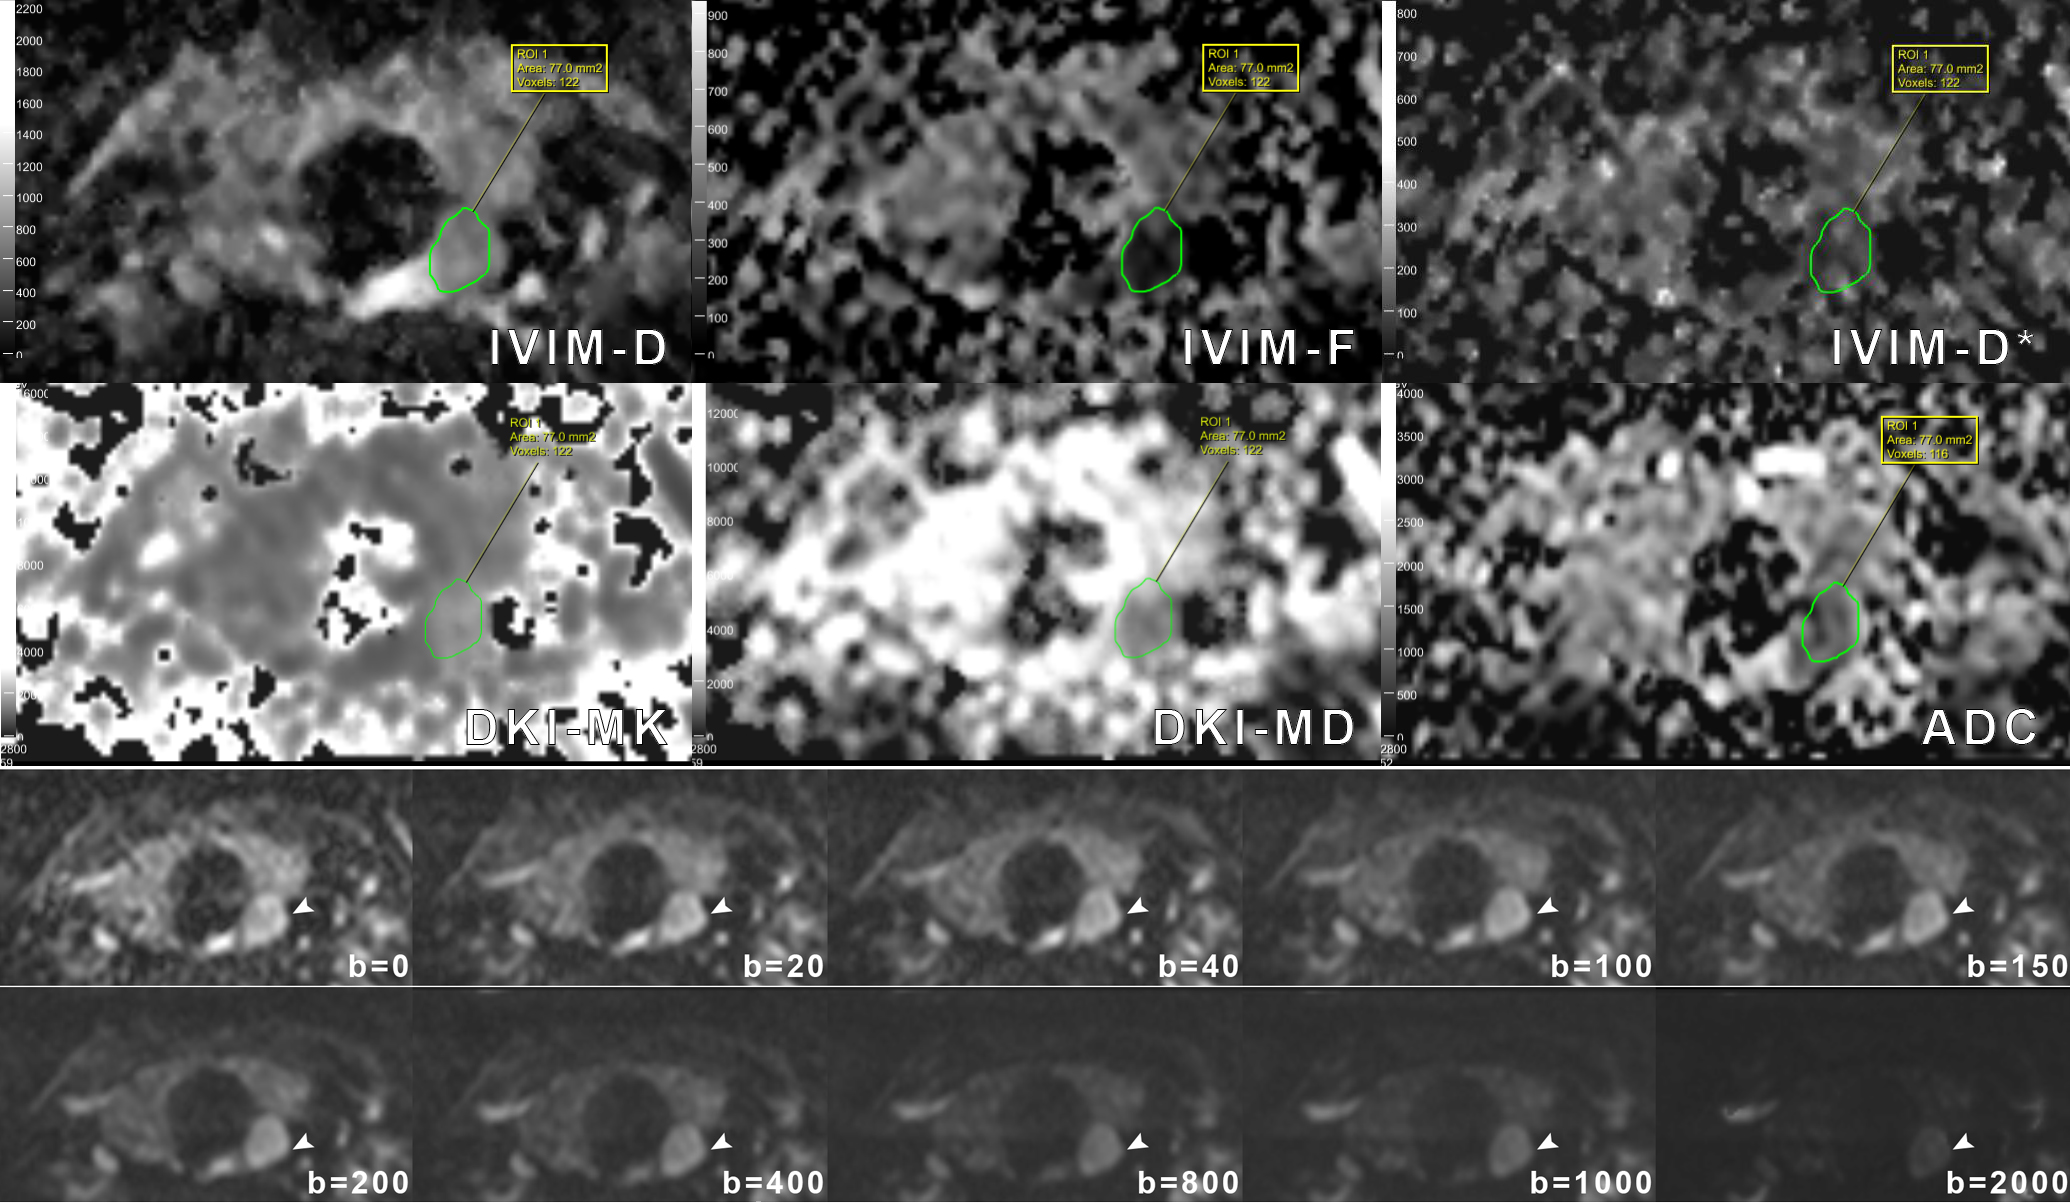
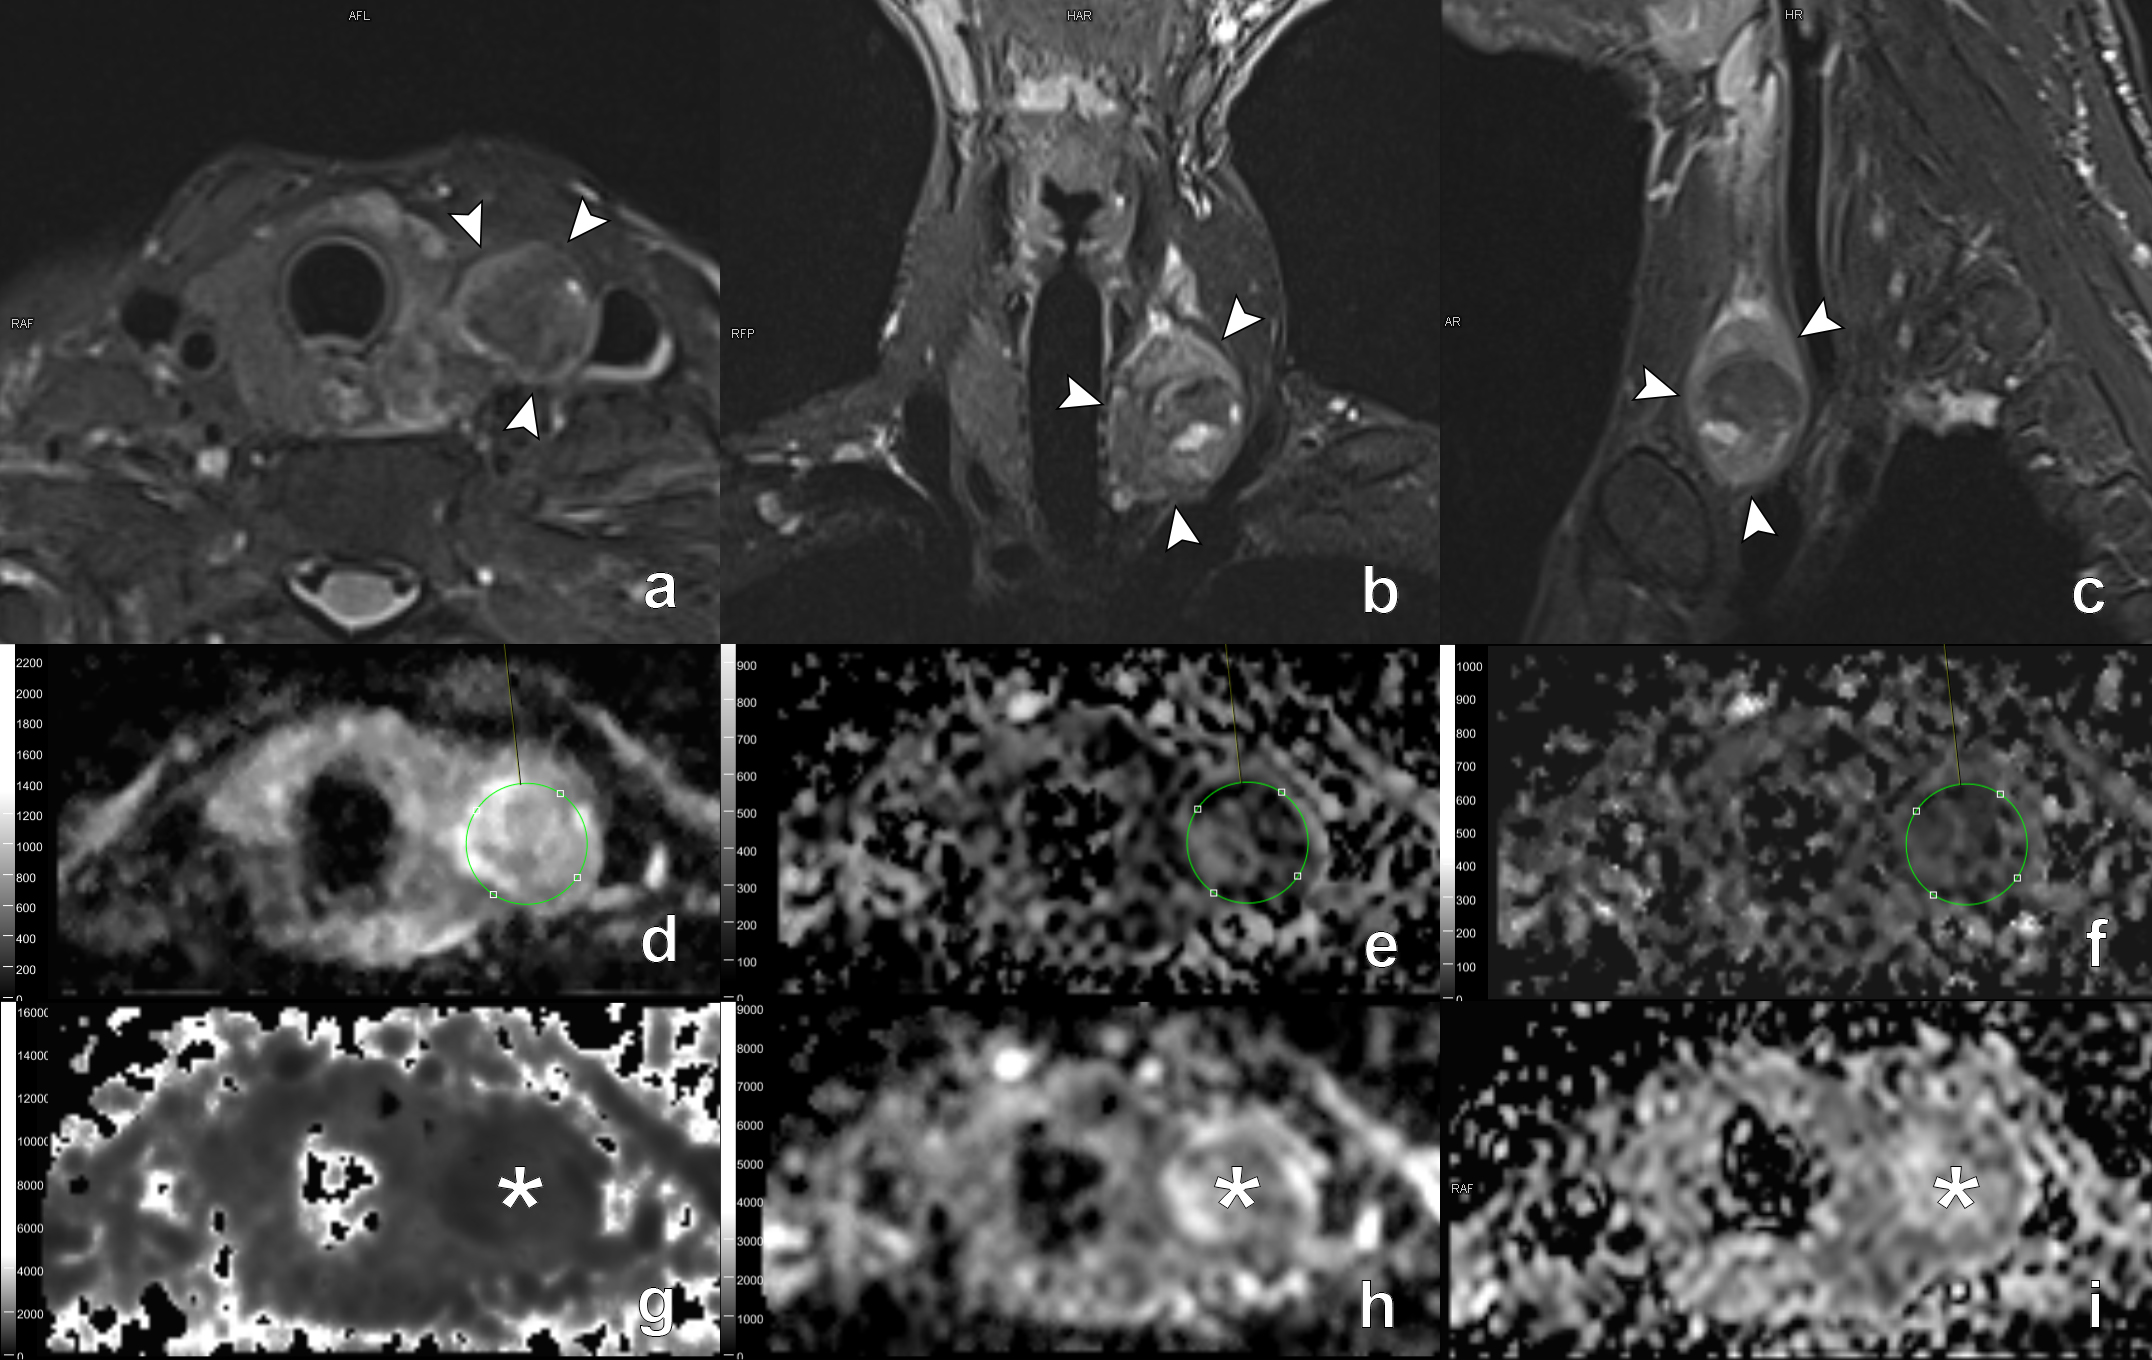
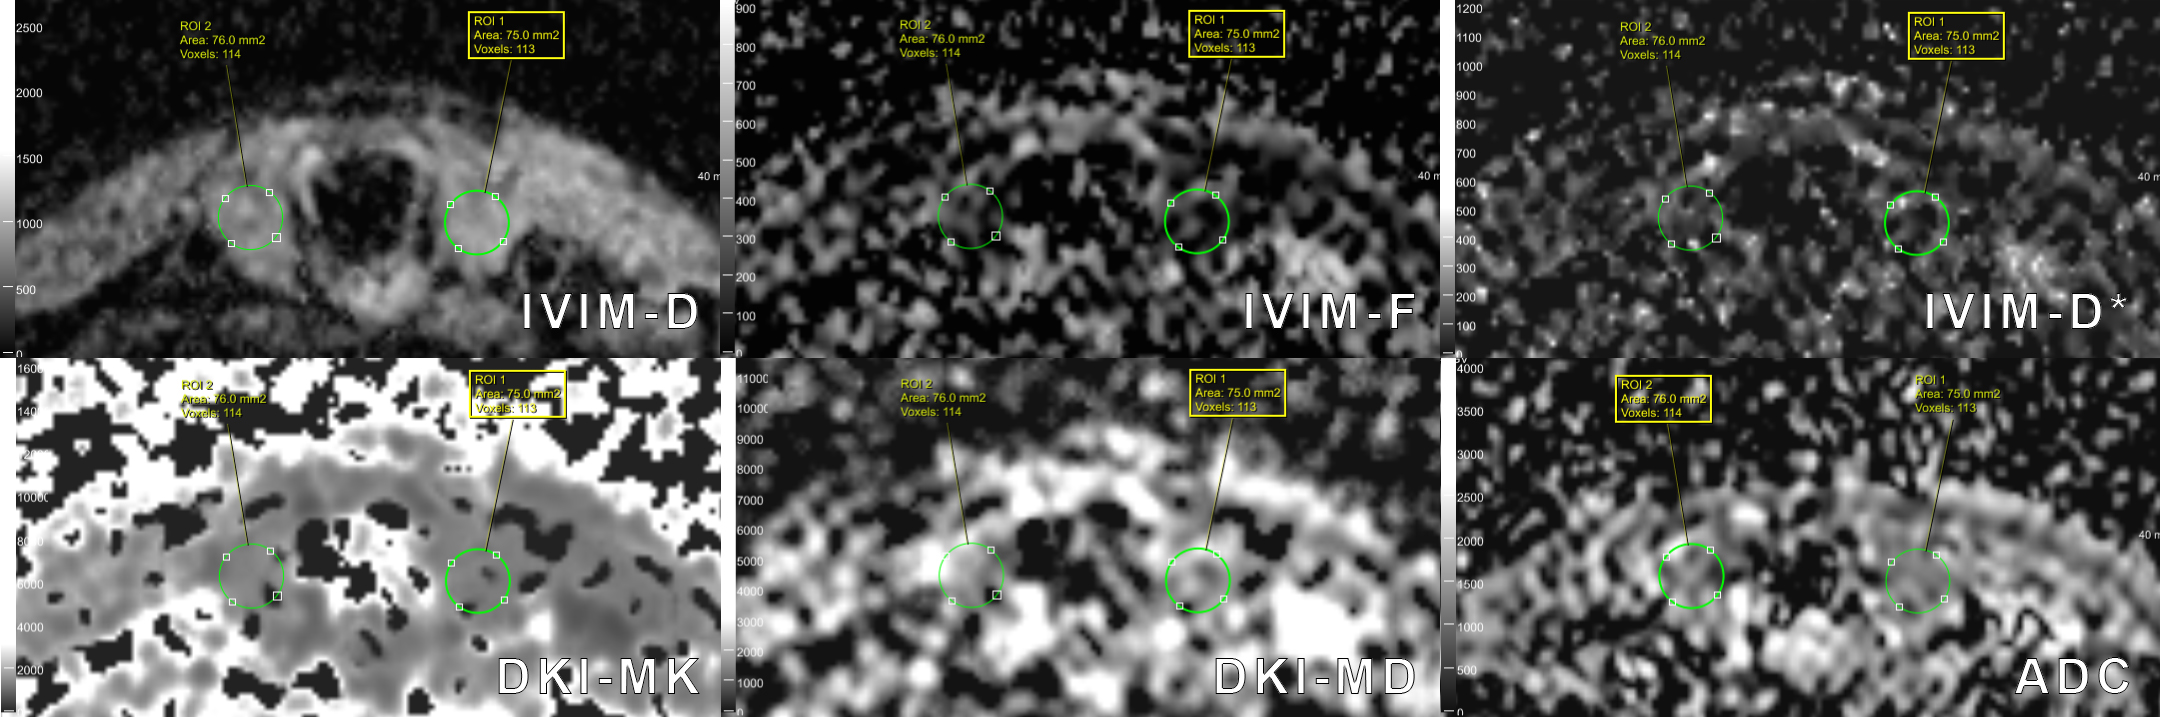
A total of 6 patients (2 males and 4 females; mean age, 49.7 ± 18.8 years; range, 24-72 years) with thyroid and/or parathyroid lesions diagnosed by color Doppler ultrasound and 6 healthy volunteers (3 males and 3 females; mean age, 27.2 ± 6.8 years; range, 24-41 years) were prospectively enrolled in the study. The ZOOMit-based IVIM, DKI and DWI were performed for all subjects at a 3T MRI scanner (MAGNETOM Prisma, Siemens Healthcare, Erlangen, Germany) with a 64-channel head-neck coil. An axial multi-b-value DWI sequence was performed for zoomed IVIM and DKI with the following parameters: TR/TE = 3200/64 ms; FOV=120×61.6 mm2; voxel size = 0.8×0.8×4.0 mm3, slice thickness = 4 mm, ten b-values were used at 0, 20, 40, 100, 150, 200, 400, 800, 1000, and 2000 s/mm2, with different averages of 2, 2, 2, 4, 4, 6, 6, 10, 10 and 10, respectively, total acquisition time was 9 min 47 sec. Imaging parameters of an axial ZOOMit DWI sequence were used as follows: TR = 2800 ms, TE = 52 ms, FOV= 120×61.6mm2, voxel size = 0.8×0.8×4.0 mm3, slice thickness = 4 mm, two b-values (b1=0 s/mm2, 1 average; b2 = 500 s/mm2, 20 averages), total acquisition time was 3 : 47. All diffusion parametric maps were calculated using a prototype post-processing software called Body Diffusion Toolbox (Version 1.3.0, Siemens Healthcare, Erlangen, Germany). ROIs were manually placed on healthy thyroid parenchyma (both in volunteers and patients) as well as each lesion at several different levels. Then, the diffusion parameters (mean ADC, D, F and D* in IVIM model, MK and MD values in DKI model) of lesions (including benign and malignant thyroid nodules, parathyroid adenomas, Hashimoto's thyroiditis, nodular goiters) were compared with those of normal thyroid parenchyma in all 12 subjects. For the quantitative evaluation, D, D*, F, ADC, MD, and MK values were compared between the lesions and normal parenchyma. The normal distribution of these parameters was determined by the Kolmogorov-Smirnov test. The differences of mean ADC values between the lesion and the normal parenchyma were compared using Student’s t-test (two independent samples t-test). The differences of other 5 diffusion parameters were analyzed by Wilcoxon rank-sum test between the two groups. Statistical significance was defined by P < 0.05. Statistical analyses were performed using IBM SPSS Software (Version 26; Armonk, NY, USA).Results
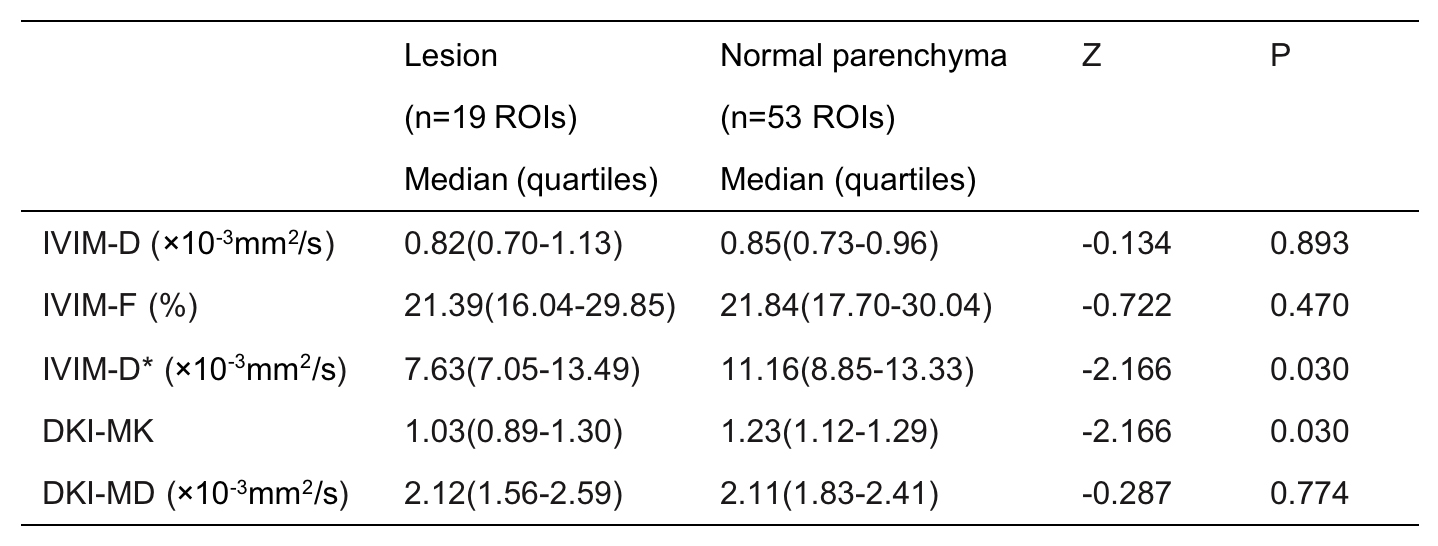
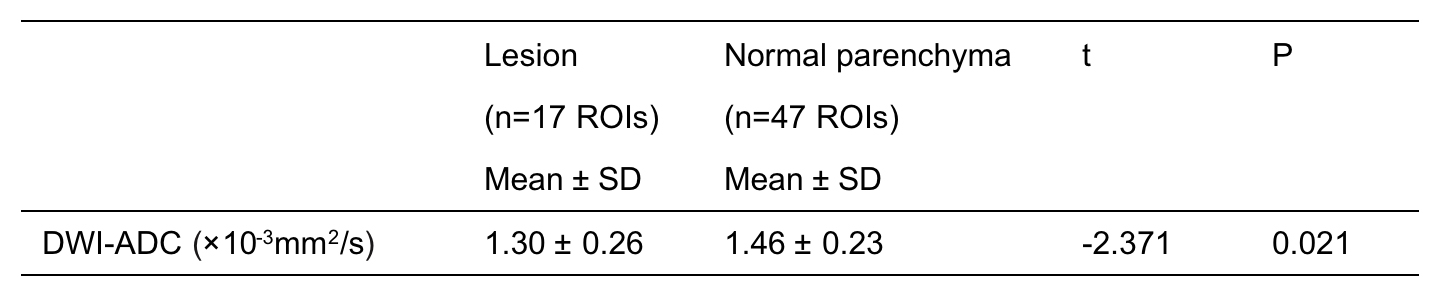
The signal intensity of the normal and pathologic thyroid (or parathyroid) tissue decreased with large-range b-values from 0 to 2000 s/mm2 (Figure 1). D, F and D* values from IVIM and MK,MD values from DKI of the thyroid and/or parathyroid lesions and normal thyroid tissues are shown in Table 1. The Wilcoxon rank-sum test demonstrated significant differences in D* and MK values between lesions and normal parenchyma (Z= -2.166, P=0.030 for D*, Z=-2.166, P=0.030 for MK). D* and MK values of lesions (Figure 1, Figure 2) were significantly lower than those of normal parenchyma (Figure 3), while there were no statistical differences of D, F, and MD values between lesions and normal tissues (Z=−0.134, P=0.893; Z=−0.722, P=0.470; Z=−0.287, P=0.774, respectively). The ADC values from ZOOMit DWI are displayed in Table 2. The Student’s t-test indicated statistical difference of ADC values between pathologic and normal tissues in thyroid and parathyroid region (t=-2.371, P=0.021). ADC values of lesions (Figure 1, Figure 2) calculated from ZOOMit were significantly smaller than those of normal tissues (Figure 3).Discussion and conclusion
The ZOOMit sequence can improve image quality. All of those three diffusion methods based on ZOOMit provided high-quality images with little deformation and artifacts, and thus enhanced the accuracy of the quantitative measurement. In particular, the quantitative D*, MK and ADC values had better diagnostic performance than D, F and MD values for differentiating abnormal thyroid tissues as well as parathyroid lesions from normal thyroid parenchyma, which is partially consistent with other's study [2]. The results suggest that zoomed IVIM and DKI imaging and DWI may be promising techniques in clinical practice in terms of both thyroid and parathyroid diseases.Acknowledgements
No acknowledgement found.References
[1] Riffel, P., Michaely, H. J., et al. Zoomed EPI-DWI of the head and neck with two-dimensional, spatially-selective radiofrequency excitation pulses. European Radiology, 2014, 24(10): 2507–2512.
[2] Shi, R., Yao, Q., et al. Preliminary study of diffusion kurtosis imaging in thyroid nodules and its histopathologic correlation. European Radiology, 2017, 27(11), 4710–4720.
Figures