4556
A Longitudinal Study on Assessing the Recovery of Spinal Cord on Incomplete Traumatic Spinal Cord Injury using Diffusion Tensor Imaging1Rocco Ortenzio Neuroimaging Center, Kessler Foundation, West Orange, NJ, United States, 2Department of Physical Medicine and Rehabilitation, Rutgers University, Newark, NJ, United States, 3Center for Mobility and Rehabilitation Engineering Research, Kessler Foundation, West Orange, NJ, United States, 4Kessler Institute for Rehabilitation, West Orange, NJ, United States
Synopsis
Physicians rely on self-reports to monitor and evaluate the functional outcome in patients with spinal cord injury during their rehabilitation. These clinical and outcome measurements can be subjective and sometimes impractical if patients have cognitive difficulty. Traditional clinical MRI scans can provide doctors more objective information but they are not sensitive to detect the progression or repair during patient’s recovery. In this study, we investigated the sensitivity of DTI technique in detecting SCI injury and its progression or recovery over the course of rehabilitation in the individuals with SCI.
Introduction
Today, the International Standards for the Neurological Classification of Spinal Cord Injury (ISNSCI), and Spinal Cord Independence Measure (SCIM) are the gold standards for neurological classification of spinal cord injury (SCI)1,2. However, ISNSCI, intended to be a clinical classification system, is subjective and relatively insensitive to incremental neurophysiological and functional changes during both acute and chronic stages of recovery. Moreover, the ISNSCI cannot evaluate the spinal cord (SC) function below the neurological level3. Magnetic resonance imaging (MRI) has been proposed as a more objective tool to help clinicians make prognosis. However, study showed that conventional clinical MRI does not correlate well with scores measured with ISNSCI4. Diffusion Tensor Imaging (DTI) is an advanced MRI tool capable of probing white matter integrity through measuring directional diffusion of water molecules, thus may providing more microscopic details. In this study, we investigated the sensitivity of DTI in detecting SCI injury and its progression or recovery over the course of rehabilitation.Methods and Materials
Participants: Eight acute SCI patients (age=38.8±18.5 y/o, Female/Male=2/6, AIS grade=B to D) and Eight gender and age matched healthy controls (HCs) have participated the study. All the participants went through five visits including imaging and outcome measurement sessions over the course of the first-year post injury (baseline, 2 weeks, 1 month, 3 months, and 6 months after the commencement of rehabilitative treatment). The outcome measurements including American Spinal Injury Association Impairment Scale (ASIA), Modified Ashworth Scale (MAS) and Spinal Cord Independence Measure III (SCIM III) were performed at each visit for the patient group.Image Acquisition: All MRIs were acquired at a 3T Siemens scanner with a 20-channel head/neck coil and a 32-channel spine coil. A high resolution T2-weighted spin echo sequence was used to collect anatomical spine images on sagittal plane. The axial DTI covering the entire cervical and thoracic sections of the cord was acquired with the following parameters: TE=97ms, TR=3600ms, Flip angle=90º; in-plane resolution=132x132mm, thickness = 3mm, 30 directions with b=1000s/mm. Another anatomical scan using T2*-weighted Multi-Echo Data Image Combination (MEDIC) sequence matching the DTI slice location was acquired.
Data Analysis: The raw DTI data were corrected for eddy current distortion and motion using FSL then further processed using Diffusion Toolkit. DTI indices including FA, MD, AD, and RD were computed for each voxel. ROIs at each disk and midlevel locations were carefully drawn from C2 to T12 level on the FA map, with the guide of T2* images. Virtual nerve fibers were reconstructed using the fiber assignment through line propagation approach based on 2nd order Runge Kutta algorithm. Above- and below-injury values were computed by averaging values above/below each patient’s location of injury (for HC’s, the location of the matched patient’s injury level was used). A mixed model implemented in R was adapted for the statistical analysis.
Results
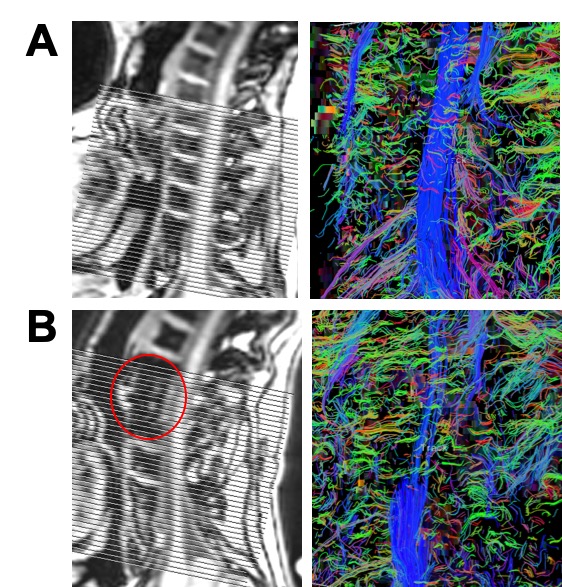
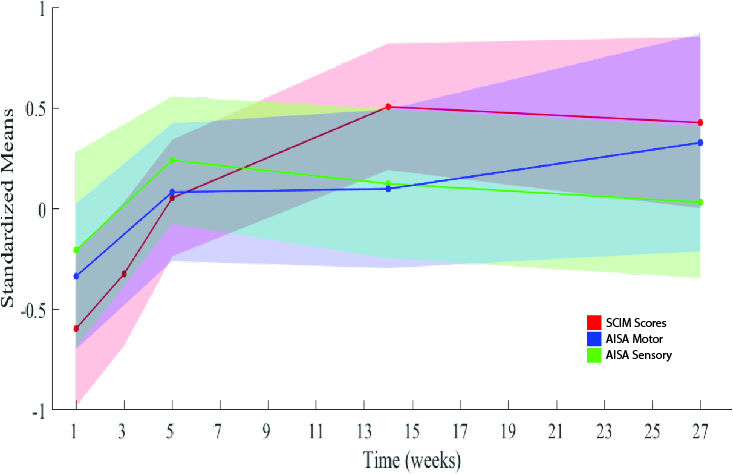
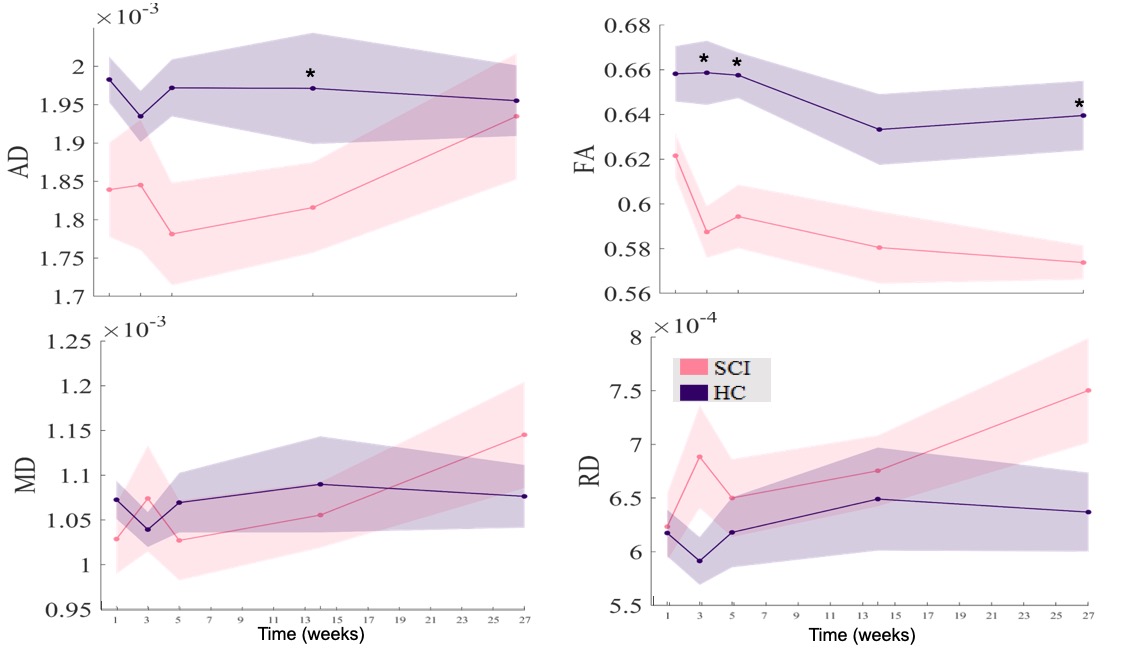
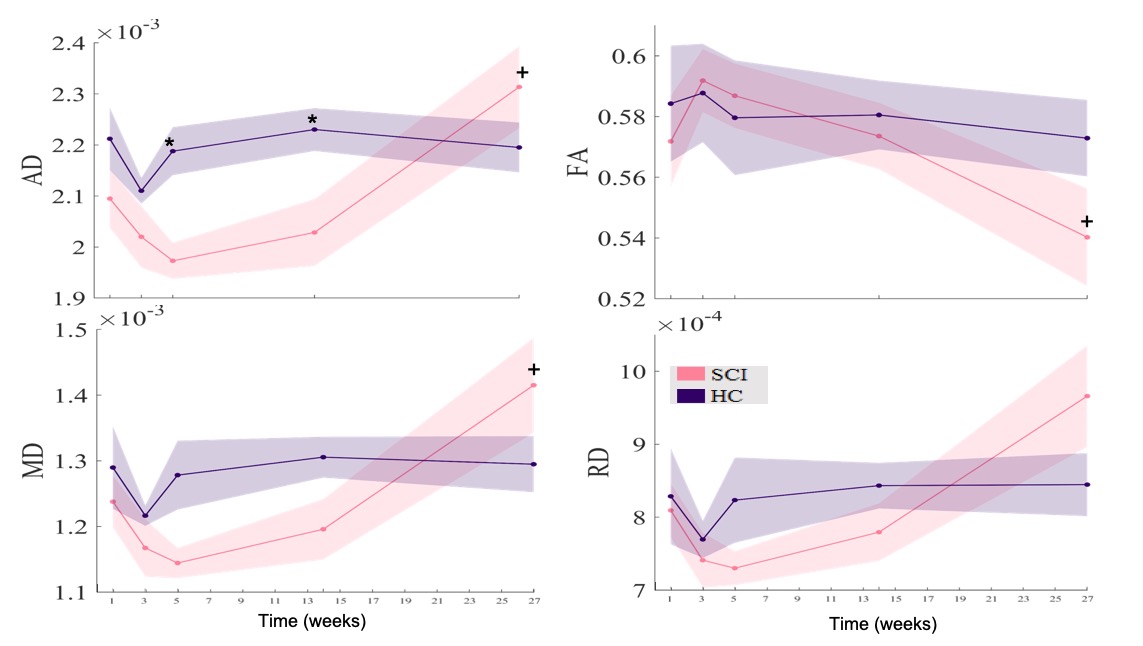
Fig. 1 shows a comparison of the MRI images and tractography for a SCI patient and a matched healthy control. Continuous and longer fibers (blue tracks) can be observed on the healthy subject, indicating the intact integrity of the white matter fibers. On the other hand, shorter and thinner fibers are seen on the SCI patient, suggesting the damaged white matter fibers. The outcome measures by SCIM shows a significant change over the 5 visits(f(4,28) = 13.7, p<.001), suggesting a recovery over the six months post injury. The ASIA result shows the same recovery curve over time but not significantly (Fig. 2). Figs. 3 and 4 show the mean values of the DTI indices (AD, FA, MD and RD) above and below the area of injury across five visits. The AD and FA in the SCI group are significantly lower than those in the HC group on the spine above the injury level except for visit 5 (Fig. 3). The same trend are also observed on AD in the below injury but FA did not show a significant difference between the two groups (Fig. 4). No significant differences were found in MD and RD between SCI and HC groups.Discussion and Conclusions
DTI has been widely used in studying the human brain. Our study on the spinal cord shows DTI is a sensitive tool to detect SC fiber abnormalities, which supports the hypothesis that DTI can detect the reduced nerve fiber structure quality in SCI. FA and AD showed significantly lower values in the SCI group, suggesting that these measures could be more sensitive to detecting damage than MD and RD. These data also show more differences above the level of injury compared to below-injury regions, suggesting a greater impact to above nerves due to injury. A higher FA value was observed in the upper spine than lower spine, which is consistent with the fact that higher white to gray matter ratio exists in the upper spine4. A lower FA and higher AD were found at the six months of recovery in the below injury region, indicating the occurrence of structural changes during the recovery phase in that region. Our study demonstrates that DTI may serve as a tool to assess the changes at different regions of the spine, of which information is usually hard to be obtained by traditional evaluation methods.Acknowledgements
This study is supported by grants NIH/NINDS R21 NS085456 and State of New Jersey Commission on Spinal Cord Research CSCR15ERG013.References
1) Kirshblum, S.C., et al., International standards for neurological classification of spinal cord injury (revised 2011). J Spinal Cord Med, 2011. 34(6): p. 535-46.
2) Marino, R.J. and D.E. Graves, Metric properties of the ASIA motor score: subscales improve correlation with functional activities. Arch Phys Med Rehabil, 2004. 85(11): p. 1804-10.
3) Mulachey, M. J., et al., Neuromuscular scoliosis in children with spinal cord injury. Top Spinal Cord Inj Rehabil, 2013. 19(2): p. 96-103.
4) Wheeler-Kingshott, C. A. M., et al., Investigating cervical spinal cord structure using axial diffusion tensor imaging. NeuroImage, 2002. 16: p. 93-102.
Figures