4554
Observation of the intracellular oxygenation changes in MRI signal1Graduate School of Health Sciences, Hokkaido University, Sapporo, Japan, 2Faculty of Health Sciences, Hokkaido University, Sapporo, Japan, 3National Institute of Information and Communications Technology, Osaka, Japan
Synopsis
Oxygen molecule is paramagnetic and its relaxation-time-shortening effect is strongly enhanced in viscous intracellular environment following the BPP theory. Therefore, DWI signal, which enhances intercellular signal, could reflect oxygen concentration changes in the cell. To verify this property, we formulated an equation of MR signal that includes signal increase/decrease by T1/T2 shortening by oxygen; there exists a TE (TE0) at which the relaxation-time-shortening effect counterbalances showing no signal change. We obtained successive DWI signal of brain under resting-state, and observed the existence of TE0 supporting that intracellular oxygen concentration changes are visible in DWI signal.
Purpose
The cerebral neural activities are accompanied by blood flow changes. The blood oxygenation level-dependent (BOLD) effect1 is based on this blood flow changes, and functional MRI (fMRI) is widely used to map the neural activity using this BOLD effect that does not directly reflect the signal from the activated neurons. Because this indirect fMRI technique is sensitive to draining venous blood vessels from the activated neuron area (activation focus), the depicted activation areas broadly spread from the activation focus. Contrarily, the activation is hard to be depicted when the draining venous vessels align to the direction of the static magnetic field of the MR scanner2. To address these problems, direct detection of the MR signal from the activated neurons is needed. The Diffusion Weighted Imaging (DWI) could suppress the extracellular MR signals and enhance the intracellular MR signals. Therefore, the DWI techniques would improve fMRI to depict the activation foci directly. In this study, to verify whether the DWI signal reflects changes in intracellular oxygen concentration, we first built a theory of intracellular MR signal and oxygenation concentration and analyzed the time series DWI signal changes in resting-state of a volunteer with our theory of MR signal and oxygenation concentration.Materials and Methods
A single brain slice of a healthy male volunteer (aged 31 years) was imaged successively for 180 images as total at resting-state using spin-echo echo-planar imaging (SE-EPI) DWI under 3T MRI. The TR was set as 250, 500 1000, ms respectively, and for each TR, 5TEs (90, 95, 100, 105, 110 ms) were used. The b-value was 2000 s/mm2 at which the diffusion components of blood and interstitial fluid were sufficiently suppressed. These time series imaging was performed with three respective MPG directions in x-direction (horizontal direction), y-direction (vertical direction), and z-direction (head-tail direction). The rate of MR signal changes (ΔS/S) were mapped for each parameter setting; S is the average signal intensity and ΔS is the standard deviation of the obtained time series signal. The pixels where the influence of blood flow is large―ΔS deviates greatly through MPG direction―were removed from further analyses. The average value of ΔS/S versus TE was plotted to verify the relaxation-time-shortening effect.Results and Discussion
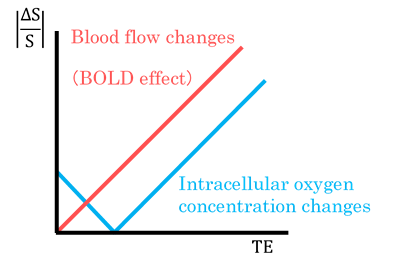
The average ΔS/S increased with the increase of TE (Fig. 1) and the regression line of each TR crossed with the TE axis at a positive TE (TE0). Theoretically, MR signal change rate (ΔS/S) due to intracellular oxygen concentration changes is expressed by the following equation modeled by the change of longitudinal relaxation and transverse relaxation depending on oxygen concentration:|ΔS/S|oxygen = |(TE·r2 - TR·r1/(exp(R1·TR) - 1))·Δ[O2]| [1]where r1 and r2 represent the oxygen concentration dependence of R1 (longitudinal relaxation rate) and R2 (transverse relaxation rate), respectively, and the Δ[O2] is the intracellular oxygen concentration changes. Based on this equation, the ΔS/S versus TE was draw in Fig. 2. While the BOLD effect property shows the origin crossing graph, the appearance of TE0 in our results supports the existence of the intracellular MR signal changes. This appearance of TE0 is caused by a counterbalance of the T1, T2 shortening effect due to oxygen molecules (Eq. [1]) and TE0 is written as:
TE0 = r1·TR/(r2·(exp(R1·TR) - 1)) [2]
From this equation, TE0 decreases with an increase in TR. This decrease of TE0 with an increase in TR was also observed in our results (Fig. 1). By using DWI, the intracellular oxygen changes appear in the MRI signal intensity.
Conclusions
Intracellular oxygen concentration changes are visible in DWI signal.Acknowledgements
No acknowledgement found.References
1. Ogawa S. Functional brain mapping by blood oxygenation level-dependent contrast magnetic resonance imaging. A comparison of signal characteristics with a biophysical model. Biophysical Journal. 1993; 64:802-812.
2. Yamamoto T. Paradoxical correlation between signal in functional magnetic resonance imaging and deoxygenated haemoglobin content in capillaries: a new theoretical explanation. Physics in Medicine and Biology. 2002; 47:1121-1141
Figures
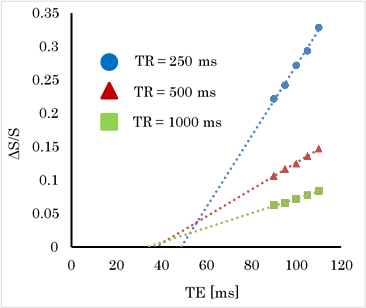
Fig. 1 Result of the average ΔS/S vs. TE.
Dotted line represents the regression line.