4553
In vivo Diffusion Tensor Magnetic Resonance Imaging of Chronic Cocaine Administered Mouse Brain1College of Medicine, University of Nebraska Medical Center, Omaha, NE, United States, 2Pharmacology and Experimental Neuroscience, University of Nebraska Medical Center, Omaha, NE, United States, 3Radiology, University of Nebraska Medical Center, Omaha, NE, United States
Synopsis
In vivo imaging-based biomarkers that can accurately detect the brain structural and functional changes due to chronic drug abuse play a significant role to understand and assess brain damage due to cocaine abuse and to determine the efficacy of the treatment. To this end, we have demonstrated that diffusion tensor MRI could detect brain structural changes, particularly demyelination in white matter structures, in chronic cocaine administered mice.
INTRODUCTION
Cocaine is a common stimulant drug of abuse that can cause brain functional, structural, biochemical, and behavioral changes. Comorbidity with other diseases such as HIV infection makes it more difficult to understand the long-term mechanism of underlying disease, its progression, and treatment efficacy. In vivo imaging-based biomarkers that are sensitive to detect the brain structural changes due to drug abuse play an important role in longitudinal studies that are aimed to understand the damage caused to brain and its therapeutic response. The purpose of this study was to determine if diffusion tensor imaging could detect longitudinal in vivo brain structural changes in cocaine administered mice.MATERIALS AND METHODS
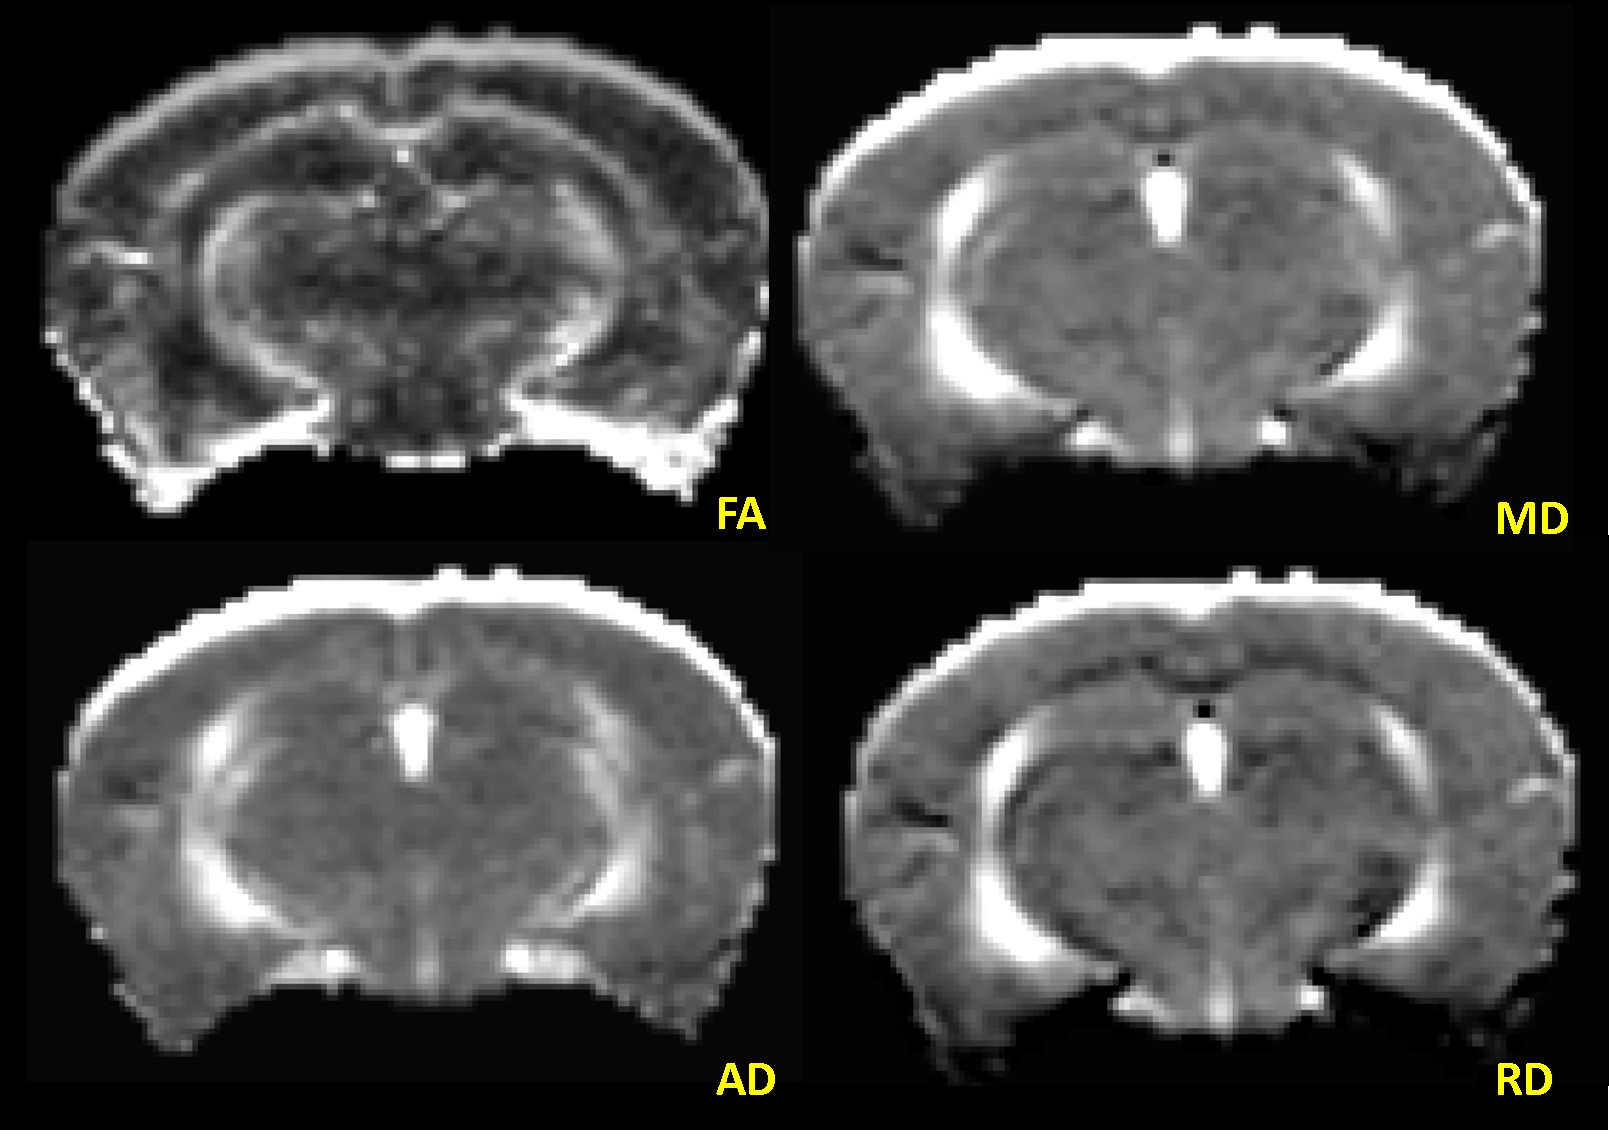
Animals: Four (2-months-old) wild type C57BL/6 mice with IACUC approval were included in this study. After acquiring the baseline MRI, cocaine was administered with a dose of 20 mg/kg (via intraperitoneal injection) daily for 4 weeks. Subsequent MRI scans were obtained at the end of week 1 (acute) and week 4 (chronic). During the scans, mice were anesthetized by inhalation of isoflurane in 100% oxygen, and the flow was adjusted to maintain steady respiration rate of 40-80 breaths/minute. MRI Data: MRI were acquired on a Bruker (Ettlingen, Germany) Avance 7T/21 cm horizontal bore small animal scanner operating at 300.41 MHz with ParaVision 6.01 scanner software. Diffusion Tensor–MRI (DT-MRI) with echo planar imaging (EPI) was acquired with following parameters: number of segments=4, slices=15, TR/TE=2000/24 ms, slice thickness=0.5 mm, image size=128x128, averages=1, number of gradient directions=12, b-value=800 s/mm2, and scan duration=12m08s. Data Processing and Analysis: DT-MRI were transferred from scanner to a PC for processing and analysis. First, DTI data were visually screened for any image distortions and corrected, whenever possible, using in-house developed software tools. An anisotropic diffusion filter was applied to reduce noise without blurring the structural boundaries. Diffusion Toolkit (trackvis.org/dtk/) was used to generate maps of Fractional Anisotropy (FA), Mean Diffusivity (MD), Axial Diffusivity (AD), and Radial Diffusivity (RD) (Figure 1). ROIs drawn on FA map using ImageJ (imagej.nih.gov/ij/) were copied onto other maps for analysis. To remove any outliers, only the pixels with FA values between 0.1 and 0.9 in ROI were considered for analysis in all maps.RESULTS
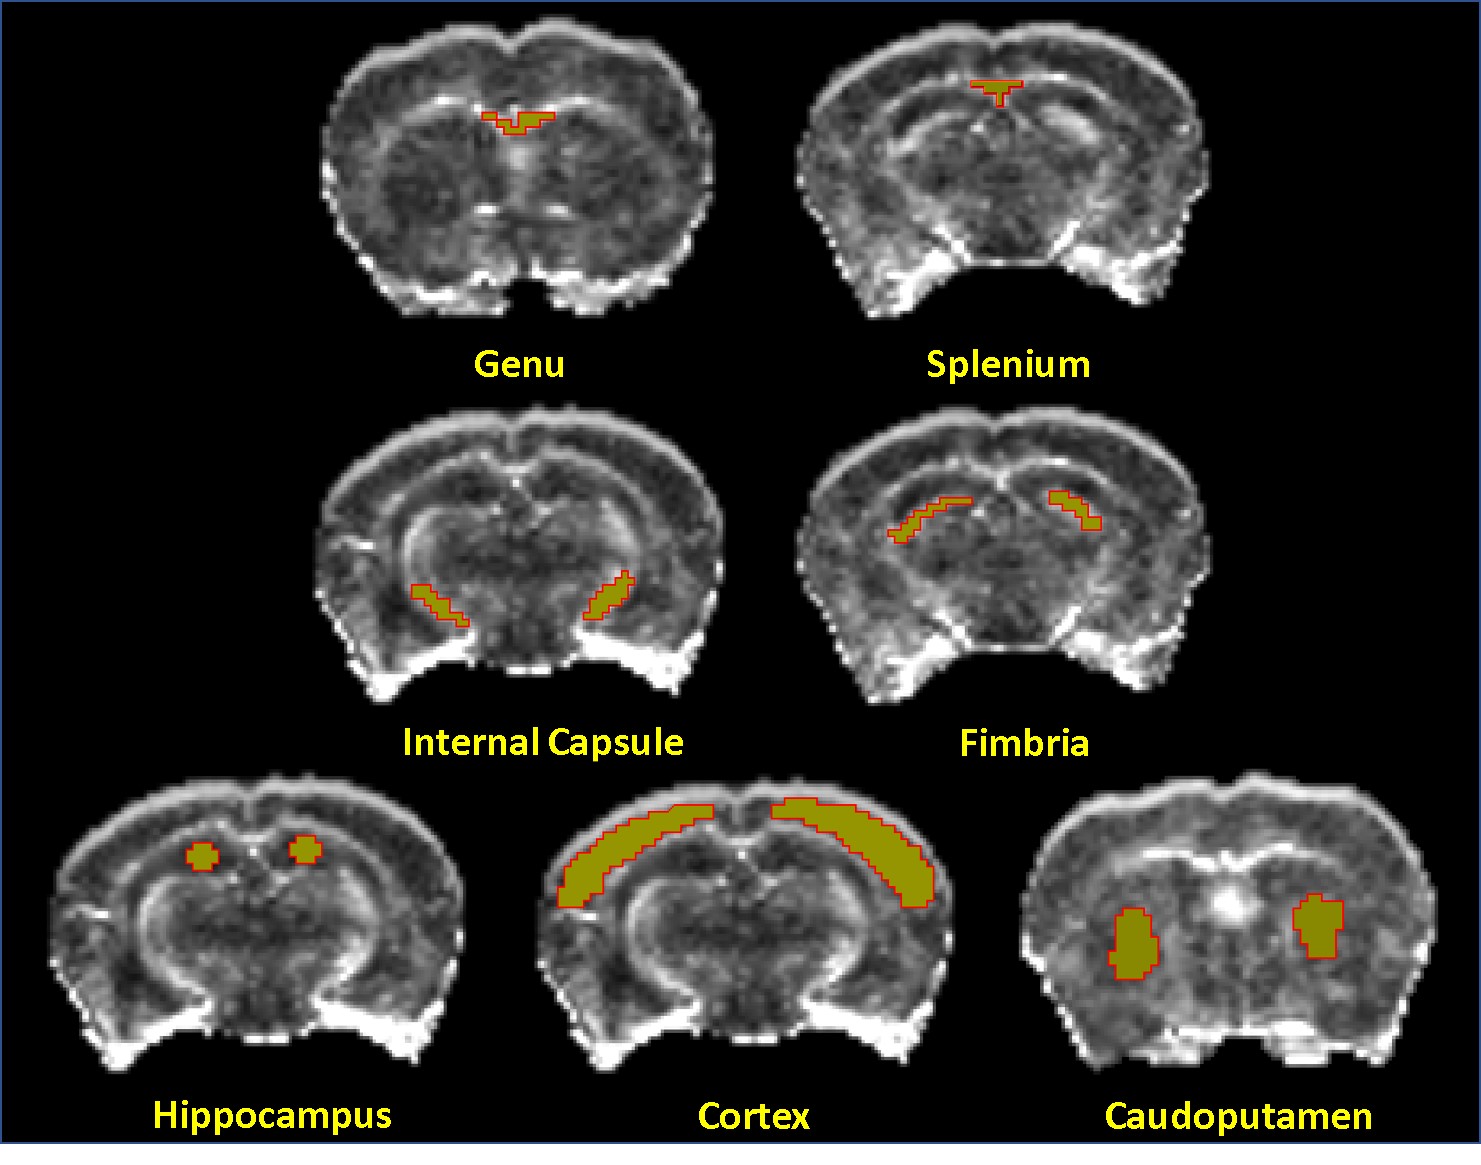
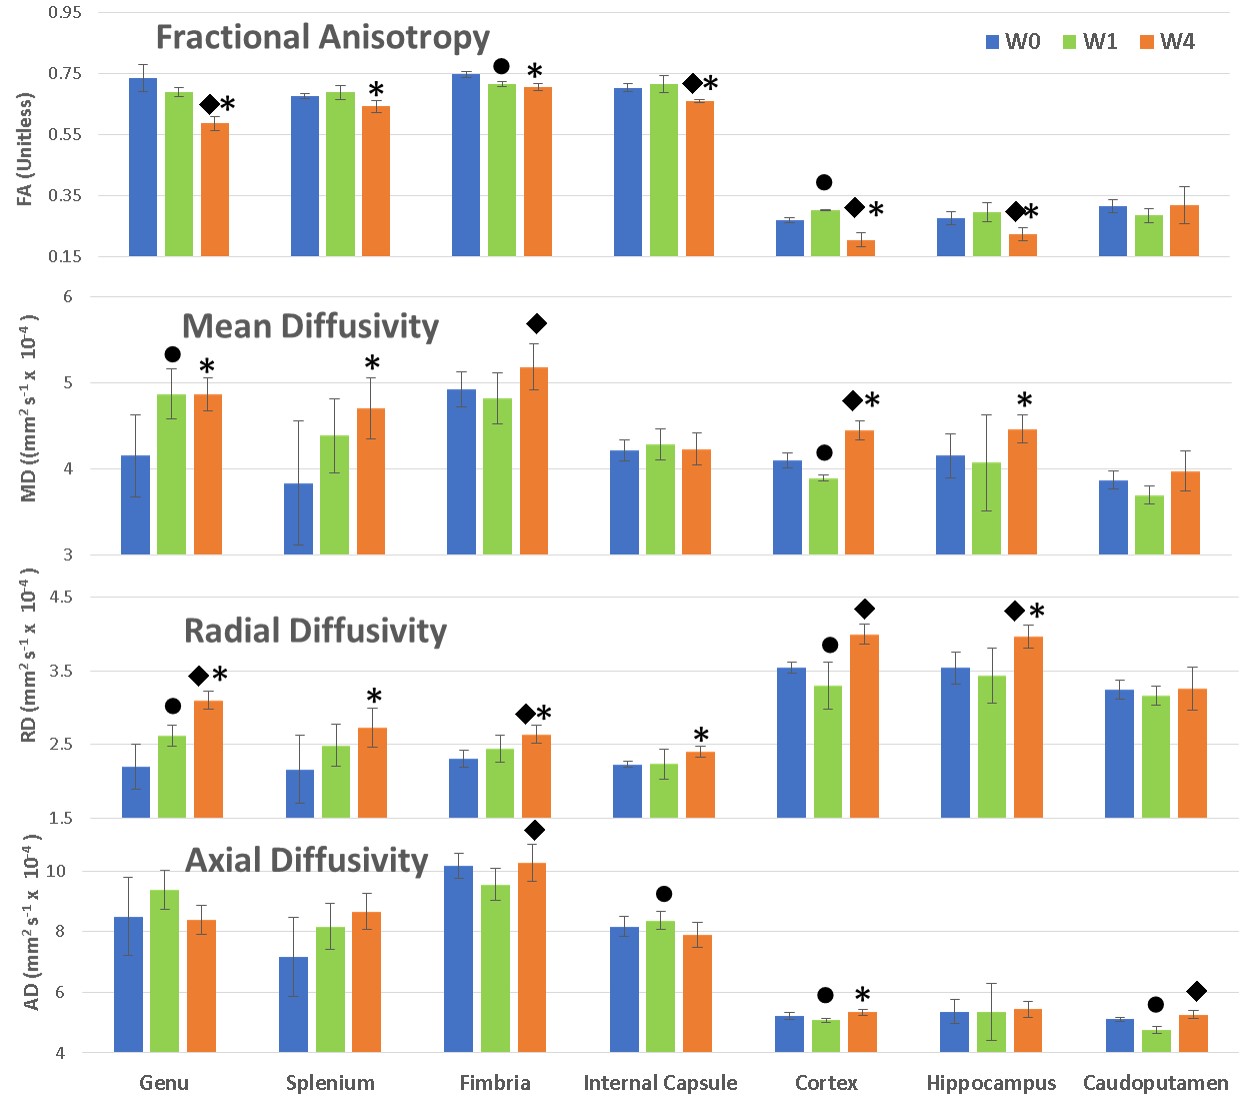
Allen Mouse Brain Atlas [1] and other DTI studies in rats [2] were used to identify brain regions for ROI analysis. Figure 2 shows the brain regions used for DTI analysis. The mean values of each ROI from FA, AD, MD, and RD maps were measured. The mean and standard deviation values from all animals (n=4) of each ROI at each time point were calculated. Figure 3 demonstrates these changes, with blue color representing the week 0 (baseline), green and orange colors representing values at week 1 and week 4 respectively. A one-tailed paired sample T-test was used to determine statistically significant change in measures between time points, with a star (*) representing significance (p< 0.05) between week 0 and week 4 (chronic), a circle (●) between week 0 and week 1 (acute), and a diamond (◆) between weeks 1 and 4. All white matter structures included in this study- the genu (gcc) and splenium (scc) of the corpus callosum, fimbria (fi), and internal capsule (ic) -showed significant decreases in FA and increases in RD at week 4 compared to week 0, as shown in Figure 3. However, except in fi no significant change in AD was detected among other WM structures in chronic use of cocaine. Gray matter(GM) structures- the cortex (ctx), hippocampal formation (hpf), and caudoputamen (cp) -did not respond uniformly to cocaine administration, with the ctx decreasing in FA, MD and AD at week 4, while the hpf decreased in FA but increased in RD and MD (Figure 3). Most measures showed the significant change between baseline and week 1 in the ctx, while the hpf showed significant change between weeks 1 and 4 as well. In cp, the AD has decreased at week 1 which returned to baseline by week 4.DISCUSSION AND CONCLUSION
In WM structures (gcc, scc, fi, ic), increased RD values with little change in LD may be linked to demyelination [3]. Narayana et al. have found similar results in rats and speculated oxidative stress as the likely cause of oligodendrocyte loss [2]. In the region ctx, diffusivity changes may be explained by microscopic regions of cocaine-induced arteriolar vasospasm and recovery [4]. The hpf also behaved very similarly to that of WM regions in both FA and MD, perhaps due to its highly structured organization [5]. The cp showed no change from baseline, which is also consistent with intermittent hypo-perfusion being the primary mechanism of GM damage, as it is resistant to vasospastic ischemia [6]. Efforts to increase the sample size and inclusion of histological results to confirm our MRI based observations are underway. Future directions include the studies of cocaine’s interaction with common comorbid substance abuse and neurological disorders such as HIV infection. In conclusion, we determined that damage to mouse neurological structures resulting from chronic cocaine exposure can be detected in vivo using DTI measures.Acknowledgements
The authors acknowledge the following Shared Resources facilities __Imaging Core, Animal Core__ at the Chronic HIV infection and Aging in NeuroAIDS (CHAIN) Center, Grant 2P30MH062261.References
1. Lein, E.S. et al. Genome-wide atlas of gene expression in the adult mouse brain, Nature 445: 168-176, 2007.
2. Narayana PA, Herrera JJ, Bockhorst KH. Chronic cocaine administration causes extensive white matter damage in brain: diffusion tensor imaging and immunohistochemistry studies. Psychiatry Res. 2014 Mar 30;221(3):220-30.
3. Moeller FG, Hasan KM, Steinberg JL, Kramer LA, Valdes I, Lai LY, Swann AC. Diffusion tensor imaging eigenvalues: preliminary evidence for altered myelin in cocaine dependence. Psych Res. 2007 Apr 15;154(3):253-8.
4. You J, Volkow ND, Park K, Zhang Q, Clare K, Du C, Pan Y. Cerebrovascular adaptations to cocaine-induced transient ischemic attacks in the rodent brain. JCI Insight. 2017 Mar 9;2(5)
5. Amaral, David. “Hippocampal Neuroanatomy” The Hippocampus Book, by Per Andersen, Oxford University Press, 2007, pp. 37–72.
6. Sim ME, Lyoo IK, Streeter CC, Covell J, Sarid-Segal O. Cerebellar gray matter volume correlates with duration of cocaine use in cocaine-dependent subjects. Neuropsychopharmacology. 2007 Oct;32(10):2229-37.
Figures