4550
Fewer number of gradient directions in diffusion MRI can be counterbalanced with higher sample size: a migraine clinical study1Imaging Processing Laboratory, Universidad de Valladolid, Valladolid, Spain, 2Headache Unit, Hospital Clínico Universitario de Valladolid, Valladolid, Spain
Synopsis
The effect of changes in the acquisition parameters on Diffusion Tensor Imaging (DTI) has been studied, but for very specific situations. A whole-brain comparison of 54 episodic migraine (EM) and 56 chronic migraine (CM) patients, using diffusion schemes of 61, 40 and 21 gradient orientations, was performed. Statistical comparisons were repeated reducing the sample size until no significant differences were found. Higher number of regions with significant lower axial diffusivity in CM compared to EM were found using 61 gradient directions. With a larger sample size, results with 40 and 21 directions were equivalent to results acquired with 61 directions.
Introduction
The effect of changes in the acquisition parameters on Diffusion Tensor Imaging (DTI) scalar measures has been previously studied.1–5 Particularly, it can be expected that a decrease in the number of gradient directions would affect not only the values, but also the variances of these scalar parameters. Our aim is to study whether this translates into a reduction in the discrimination power of a whole-brain diffusion MRI (dMRI) analysis, and to which extent this can be counterbalanced by means of an increase in the sample size.Methods
We acquired dMRI data from 54 Episodic Migraine (EM) and 56 Chronic Migraine (CM) patients. Acquisition parameters, including 61 gradient directions, are described elsewhere.6 The 61 gradient direction scheme was designed so that it can be subsampled to suitable schemes with 40 and 21 directions.The three groups of diffusion-weighted images (61, 40 and 21 gradient directions) were preprocessed using MRtrix tools.7–10 Diffusion tensor maps were estimated using the “dtifit” tool from FSL, and Fractional Anisotropy (FA), Mean (MD), Axial (AD) and Radial Diffusivities (RD) maps were obtained.
FA maps were warped to a common template with the standard tract-based spatial statistics (TBSS) pipeline.11 The same transformation was applied to MD, AD and RD maps. Voxel-wise pairwise differences were assessed by the nonparametric permutation-based inference “randomise” tool.12 One thousand permutations were set and results with p < 0.05 (family-wise error corrected) were considered as statistically significant. The minimum volume to consider significant results in a region was set to 30 mm3. Forty-eight regions from the JHU ICBM-DTI-81 White-Matter Labels Atlas were considered in order to find regions with significant differences.13
To observe the effect of changes in the number of gradient directions, the TBSS inference procedure was repeated in subsamples of the original sample. Starting with 50 subjects in each group, the number of subjects per group was progressively reduced in five subjects for each iteration, until no regions with significant differences were found. For each iteration, 25 repetitions were performed, each of them generating a random subsample of subjects for which the TBSS inference is carried out. This TBSS inference yields significant differences between the two groups (EM vs. CM) in a certain number of white matter regions. The median value of regions with significant differences across the 25 repetitions was considered as the figure of merit for each iteration.
Results
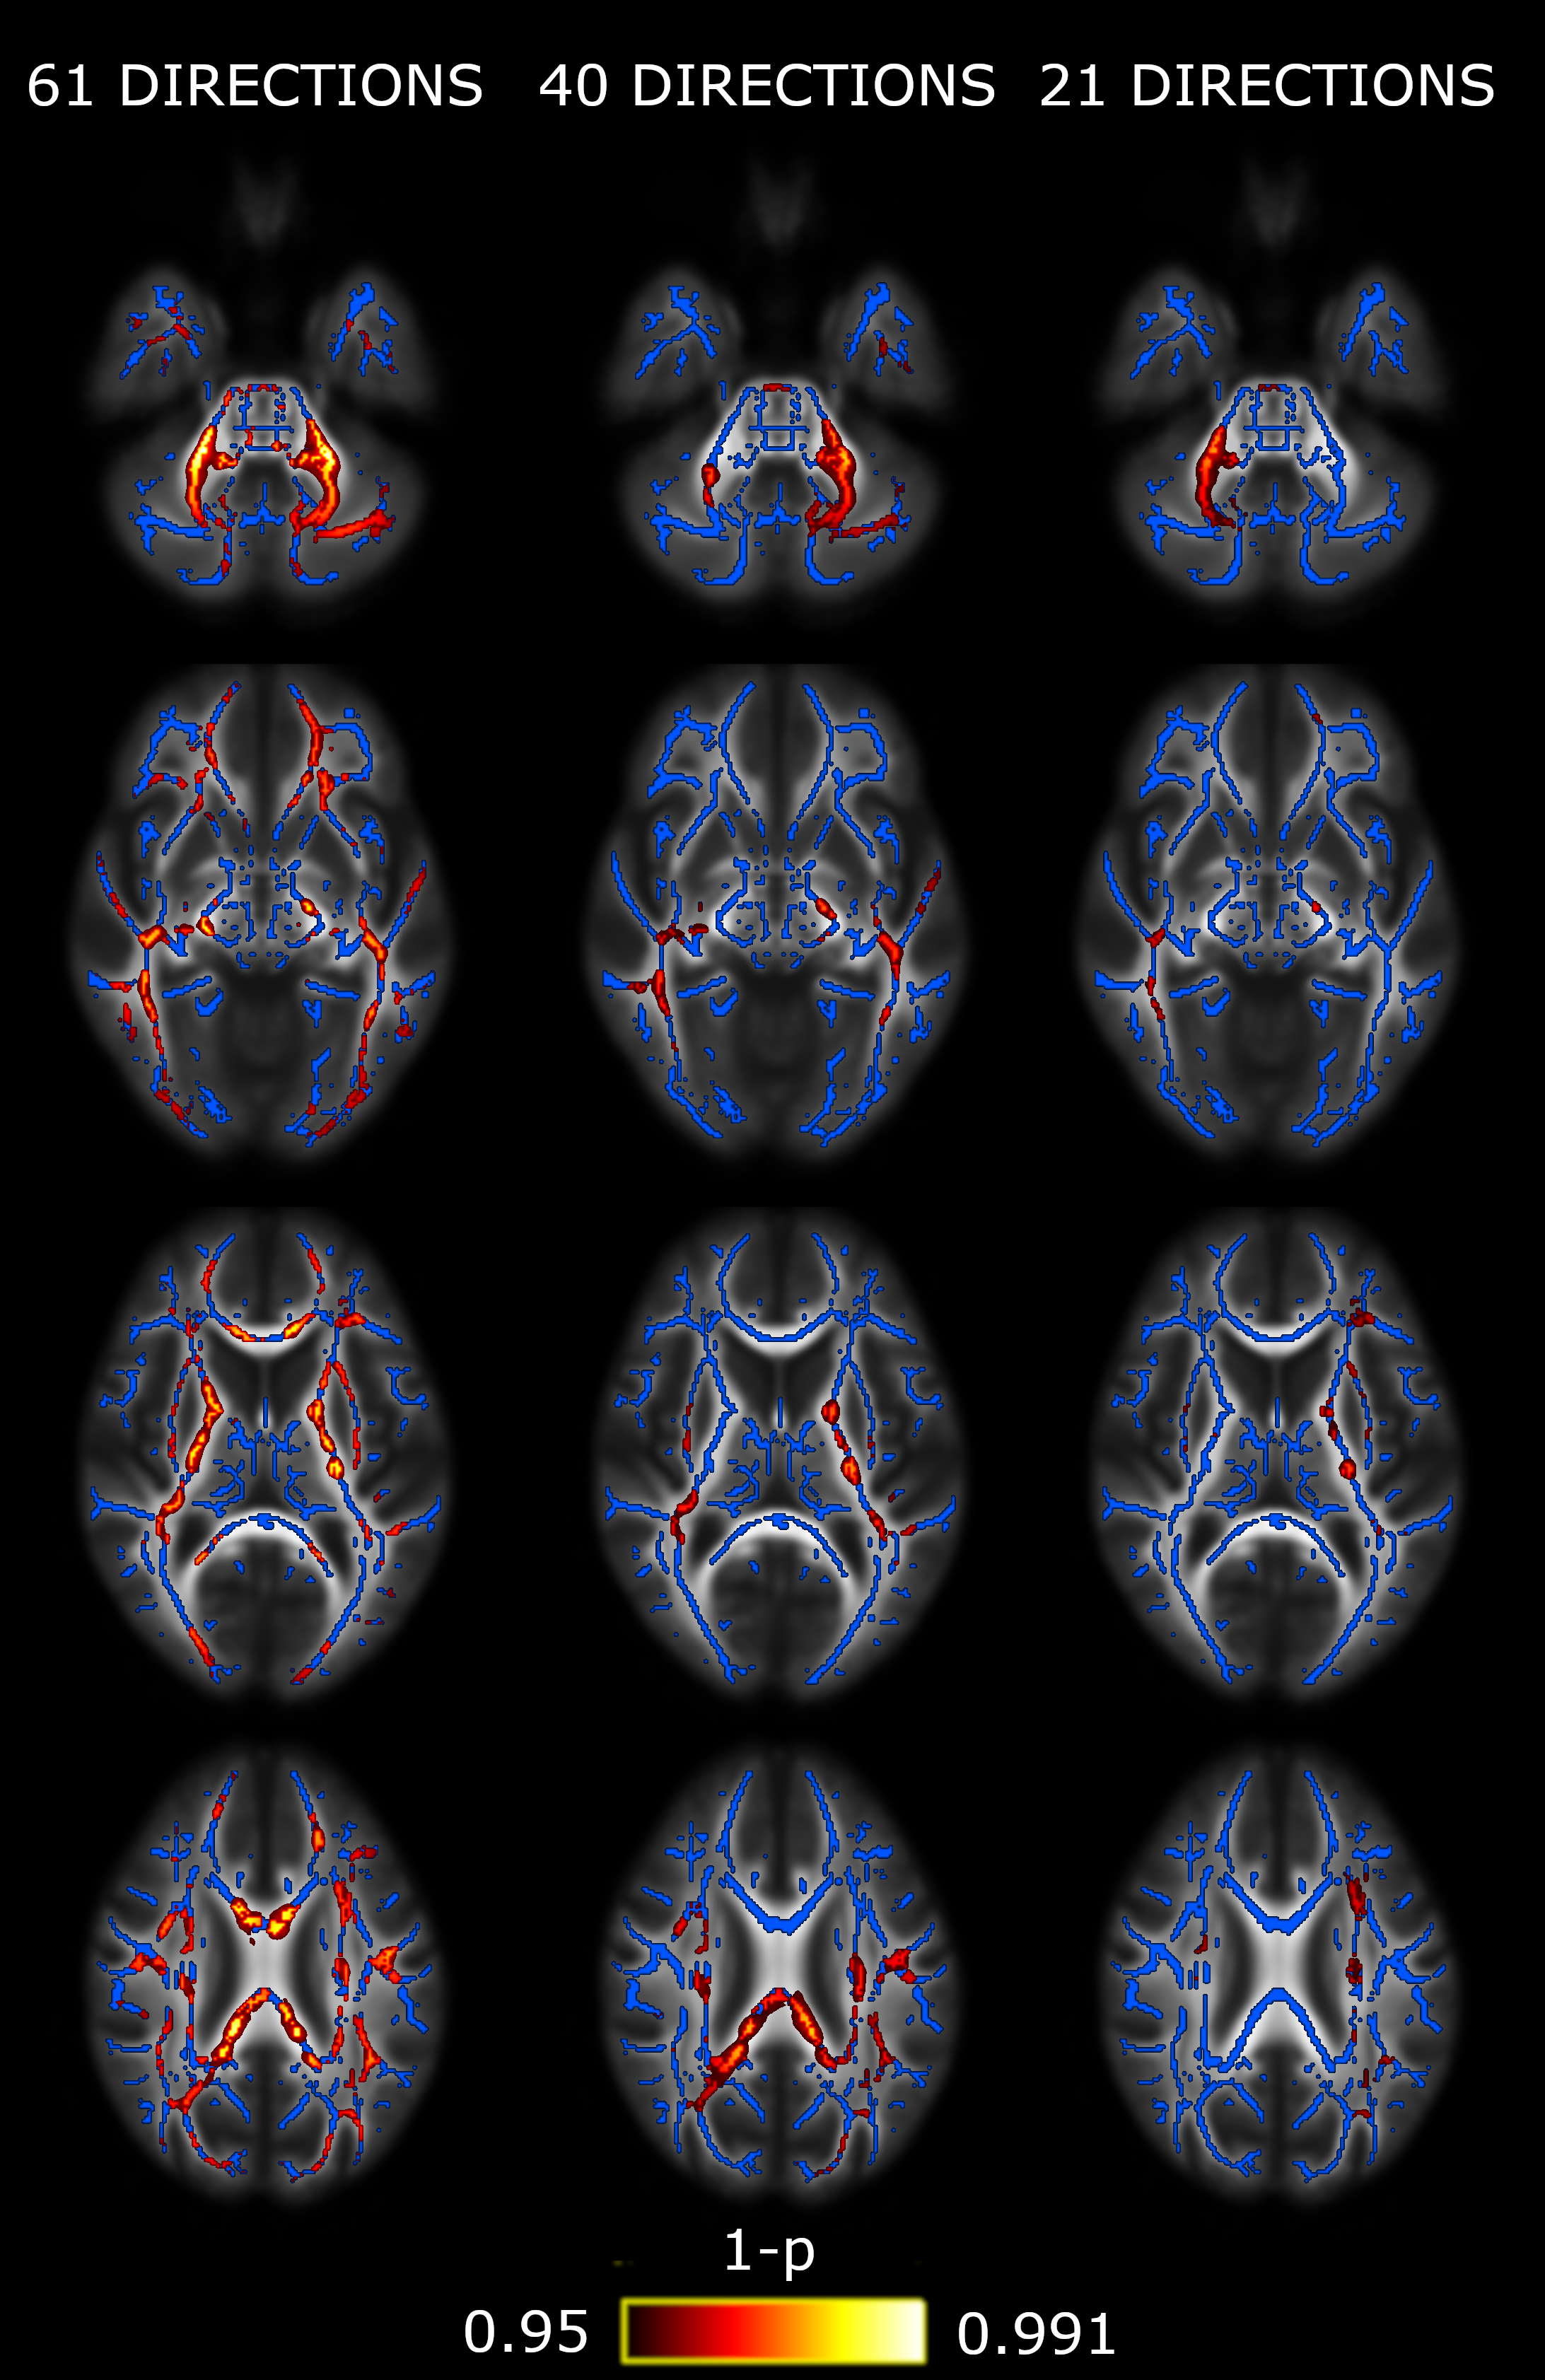
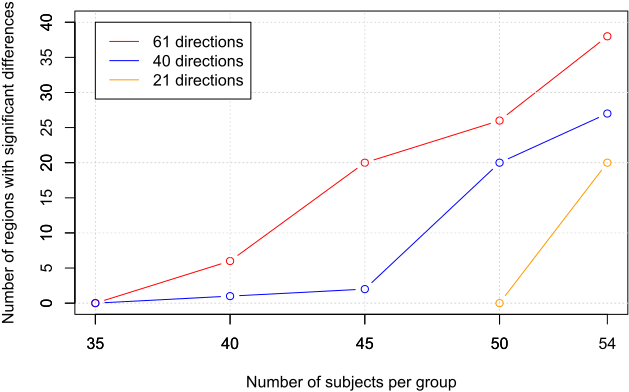
Significant lower AD was found in CM compared to EM in our dataset. The number of regions with significant differences decreases as the number of gradient directions is reduced, obtaining 37 white matter regions for 61 directions, 27 for 40 directions and 20 for 21 directions, when using all subjects for the analysis. Figure 1 shows a visual comparison of the detected differences for each configuration of gradient directions. No significant differences were detected for FA, MD or RD.Figure 2 shows the evolution in the number of white matter regions with significant differences when the size of the subject sample is reduced. As can be seen, a decrease in the number of gradients can be compensated by means of an increase in the number of subjects.
Discussion
When designing a white matter study with dMRI, both the acquisition parameters and the expected sample size needed to obtain significant results must be determined a priori. This problem is especially serious when dealing with pathologies where alterations in the white matter are very subtle, as in the case with migraine.Our results indicate that around 40 subjects per group are needed in order to detect significant differences between EM and CM patients. In fact, a similar study with migraine patients, but a lower sample size, detected no significant differences.14
As expected, the amount of detected significant differences increases, for a given sample size, when using configurations with a higher number of gradient directions. Nevertheless, the tricky question is the following: how much does fewer gradient directions penalize the discriminant power? In our dataset, reducing the number of gradient directions from 61 to 40 implies the need of around 5-10 additional subjects in each group, and around 10-15 subjects from 61 to 21 directions. This effect is related to the higher variance of the measures when employing fewer gradient directions (fewer samples in the q-space). To obtain similar results using fewer directions, an increase of the sample size is necessary to counterbalance the higher variance.
It is perhaps expected that increasing the sample size can counteract the use of fewer gradient directions. However, these two opposite effects must be quantified in order to make suitable decisions when designing a dMRI study.
In some dMRI studies, the sample size can be hardly increased because of very strict inclusion criteria in order to focus on very specific aspects of certain pathology, among possible reasons. Our results can be useful in those scenarios, in order to design acquisition schemes that are powerful enough to detect significant differences, even for reduced sample sizes.
Conclusion
The use of fewer gradient directions in dMRI can be counteracted with a higher sample size in clinical studies. We have quantified this tradeoff in order to allow better designs of dMRI studies.Acknowledgements
This work has been supported by Ministerio de Ciencia e Innovación of Spain with research grants RTI2018-094569-B-I00. ÁPG was supported by Junta de Castilla y León (Spain) and the European Social Fund (ID: 376062, Base de Datos Nacional de Subvenciones).References
1. Jones DK. The effect of gradient sampling schemes on measures derived from diffusion tensor MRI: a Monte Carlo study. Magn Reson Med. 2004;51(4):807-815.
2. Landman BA, Farrell JA, Jones CK, Smith SA, Prince JL, Mori S. Effects of diffusion weighting schemes on the reproducibility of DTI-derived fractional anisotropy, mean diffusivity, and principal eigenvector measurements at 1.5T. Neuroimage. 2007;36(4):1123-1138.
3. Lebel C, Benner T, Beaulieu C. Six is enough? Comparison of diffusion parameters measured using six or more diffusion‐encoding gradient directions with deterministic tractography. Magn Reson Med. 2012;68(2):474-483.
4. Barrio-Arranz G, de Luis-Garcia R, Tristan-Vega A, Martin-Fernandez M, Aja-Fernandez S. Impact of MR acquisition parameters on DTI scalar indexes: a tractography based approach. PLoS One. 2015;10:e0137905.
5. Aja-Fernández S, Pieciak T, Tristán-Vega A, Vegas-Sánchez-Ferrero G, Molina V, Luis-García R. Scalar diffusion-MRI measures invariant to acquisition parameters: A first step towards imaging biomarkers. Magn Reson Imaging. 2018;54:194-213.
6. Planchuelo-Gómez Á, García-Azorín D, Guerrero ÁL, Aja-Fernández S, Rodríguez M, de Luis-García R. Structural connectivity alterations in chronic and episodic migraine: A diffusion magnetic resonance imaging connectomics study. Cephalalgia. [journal on the Internet]. 2019 [cited 2019 Nov 6]. doi:10.1177/0333102419885392. [Epub ahead of print].
7. Veraart J, Novikov DS, Christiaens D, Ades-Aron B, Sijbers J, Fieremans E. Denoising of diffusion MRI using random matrix theory. Neuroimage. 2016;142:394-406.
8. Andersson JL, Sotiropoulos SN. An integrated approach to correction for off-resonance effects and subject movement in diffusion MR imaging. Neuroimage. 2015;125:1063-1078.
9. Zhang Y, Brady M, Smith S. Segmentation of brain MR images through a hidden Markov random field model and the expectation-maximization algorithm. IEEE Trans Med Imaging. 2001;20:45-57.
10. Smith SM, Jenkinson M, Woolrich MW, et al. Advances in functional and structural MR image analysis and implementation as FSL. Neuroimage. 2004;23:S208-S219.
11. Smith SM, Jenkinson M, Johansen-Berg H, et al. Tract-based Spatial Statistics: voxelwise analysis of multi-subject diffusion data. Neuroimage. 2006;31(4):1487-1505.
12. Nichols TE, Holmes AP. Nonparametric permutation tests for functional neuroimaging: a primer with examples. Hum Brain Mapp. 2002;15(1):1-25.
13. Mori S, Wakana S, Nagae-Poetscher LM, van Zijl PC. MRI Atlas of Human White Matter. Amsterdam: Elsevier; 2005.
14. Neeb L, Bastian K, Villringer K, et al. No microstructural White Matter Alterations in Chronic and Episodic Migraineurs: A Case-Control Diffusion Tensor Magnetic Resonance Imaging Study. Headache. 2015;55(2):241-251.
Figures