4546
Ultra-high b-value Diffusion MRI for Evaluation of Single Amyloid Precursor Protein Knock-in Mouse Model of Alzheimer’s Disease
Jin Gao1,2, Zachery Morrissey3, Alex Leow3, Orly Lazarov4, Danilo Erricolo1, Richard Magin5, and Weiguo Li2,5
1Electrical and Computer Engineering, University of Illinois at Chicago, Chicago, IL, United States, 2Research Resources Center, University of Illinois at Chicago, Chicago, IL, United States, 3Department of Psychiatry, University of Illinois at Chicago, Chicago, IL, United States, 4Department of Anatomy and Cell Biology, University of Illinois at Chicago, Chicago, IL, United States, 5Department of Bioengineering, University of Illinois at Chicago, Chicago, IL, United States
1Electrical and Computer Engineering, University of Illinois at Chicago, Chicago, IL, United States, 2Research Resources Center, University of Illinois at Chicago, Chicago, IL, United States, 3Department of Psychiatry, University of Illinois at Chicago, Chicago, IL, United States, 4Department of Anatomy and Cell Biology, University of Illinois at Chicago, Chicago, IL, United States, 5Department of Bioengineering, University of Illinois at Chicago, Chicago, IL, United States
Synopsis
Alzheimer’s disease (AD) has a tremendous impact in terms of social and economic cost. White matter damage in the progression of AD and the associated cognitive symptoms and pathophysiology are of crucial interest. Diffusion MRI offers unique insights into the pathophysiology of AD in vivo. This feasibility study aims to assess and visualize the white matter changes using an ultrahigh b-value diffusion MRI.
INTRODUCTION:
Alzheimer’s disease (AD) is the most common form of dementia that is estimated to affect 44 million people worldwide.1 Diffusion MRI characteristics, for example diffusion tensor imaging, offers unique insights into the pathophysiology and provides sensitive measurements of microstructure changes related to white matter degeneration of AD in vivo.2 Recent studies reported strong signals from white matter can persist in diffusion weighted images (DWI) at ultra-high b-values.3 However, the classical mono-exponential model fails to precisely depict diffusion weighted signal decay at high b values ( s/mm2).4,5 The objective of this preliminary study is to investigate diffusion signal decay behaviors at ultra-high b-values in an amyloid precursor protein (APP) knock-in mouse model of AD.METHODS:
All the experiments were approved by the Institutional Animal Care and Use Committee. Four 18-month old female mice—two APP knock-in and two wildtype C57/Bl6 (WT) controls6—were used for MRI scans. All MRI data were acquired with 31 cm bore 9.4 T Agilent MRI scanner. A diffusion weighted spin echo sequence was applied with following acquisition parameters: TR/TE = 2000/22 ms, δ/ Δ = 4/12.2 ms, slice thickness =1.0 mm, FOV = 12.8 mm × 16 mm, matrix = 64 × 64, NEX = 16, 8 b-values: (0, 1000, 2100, 3000, 4050, 5030, 6100, 8060) s/mm2 with diffusion gradient direction perpendicular to slice encoding direction. Image post-processing was performed in MATLAB (MathWorks). Normalized signal intensities were calculated from regions of interest (ROIs) that were manually drawn on corpus callosum (CC), anterior commissure (AC), and hippocampus in DW images for each mouse brain in both groups. A continuous-time random walk (CTRW) model was applied to evaluate the DW data, $$\overrightarrow{y}=E_{\alpha}(-(\overrightarrow{b}D)^{\alpha})$$ where D is diffusion coefficients, bD is raised to α power. In this model, a Mittag-Leffler function (Eα) was employed to represent restricted diffusion.7,8RESULTS:
Fig. 1 shows two slices of representative DWIs from one wild type control mouse and one APP knock-in mouse. Signal intensities in regions such as corpus callosum (CC), and anterior commissure (AC) persisted at DWIs with high b values of over 8000 s/mm2 in both APP and WT mice (Fig. 1). Diffusion signal decay with b values indicated a non-linear behavior between b-values and log-scaled normalized signal intensities (Fig. 2). Lower intensities were found for the APP mouse at all the high b-values when compared to those of the WT control (Fig. 2). From CTRW model, increased α values were found in CC in the APP mouse (shown by arrows in Fig. 3A) and decrease of D values were found in both CC and AC (Fig. 3B). In addition, α maps showed decreased intensities in the hippocampus area in the APP mouse when compared to the WT control mouse (Fig. 4).DISCUSSION:
The APP knock-in model was considered as a useful tool to study pathological changes in AD induced by αβ amyloidosis that affects both gray matter and white matter. Microstructure changes in white matter might actively contribute to the progression of the disease. Our preliminary study showed differences in CTRW model parameters extracted from AC and CC bundles in the APP knock-in mice. Decreased α values indicated increased tissue heterogeneity that could be caused by degeneration of these nerve bundles. In addition, decreased α values found in hippocampus might indicate degeneration of the fornix bundle connecting the hippocampus, which could provide information for diagnosing and staging AD in human.CONCLUSION:
CTRW parameters extracted from ultrahigh b-value diffusion MRI provide potential to detect microstructure changes in AD. Further studies are necessary to validate this method with histology and combine other quantitative MRI to investigate multiple aspects pathophysiological changes in AD at the same time.Acknowledgements
No acknowledgement found.References
- Lane CA, Hardy J, Schott JM. Alzheimer's disease. European Journal of Neurology. 2018; doi: 10.1111/ene.13439
- Perea RD, Rabin JS, Fujiyoshi MG, Neal TE, Smith EE, Van Dijk KRA, et al. Connectome-derived diffusion characteristics of the fornix in Alzheimer's disease. NeuroImage: Clinical 2018;19:331-342.
- Gao J, Gatto RG, Magin R, Larson AC, Li W. Preliminary Study of High b-value Diffusion MRI for Characterizing White Matter Damage in A Mouse Model of Amyotrophic Lateral Sclerosis. In: Proceedings of the 25th Annual Meeting of ISMRM, Honolulu, 2017. (abstract 4612)
- Cao P, Wu EX. In vivo diffusion MRS investigation of non-water molecules in biological tissues. NMR in Biomedicine 2017;30:3481-3481.
- Hoff BA, Chenevert TL, Bhojani MS, Kwee TC, Rehemtulla A, Le Bihan D, et al. Assessment of multiexponential diffusion features as MRI cancer therapy response metrics. Magn Reson Med 2010;64:1499-1509.
- Saito T, Matsuba Y, Mihira N, Takano J, Nilsson P, Itohara S, et al. Single App knock-in mouse models of Alzheimer’s disease. Nature Neuroscience 2014;17:661.
- Zhou XJ, Gao Q, Abdullah O, Magin RL. Studies of anomalous diffusion in the human brain using fractional order calculus. Magnetic Resonance in Medicine 2010;63:562-569.
- Magin RL, Abdullah O, Baleanu D, Zhou XJ. Anomalous diffusion expressed through fractional order differential operators in the Bloch–Torrey equation. Journal of Magnetic Resonance 2008;190:255-270.
Figures
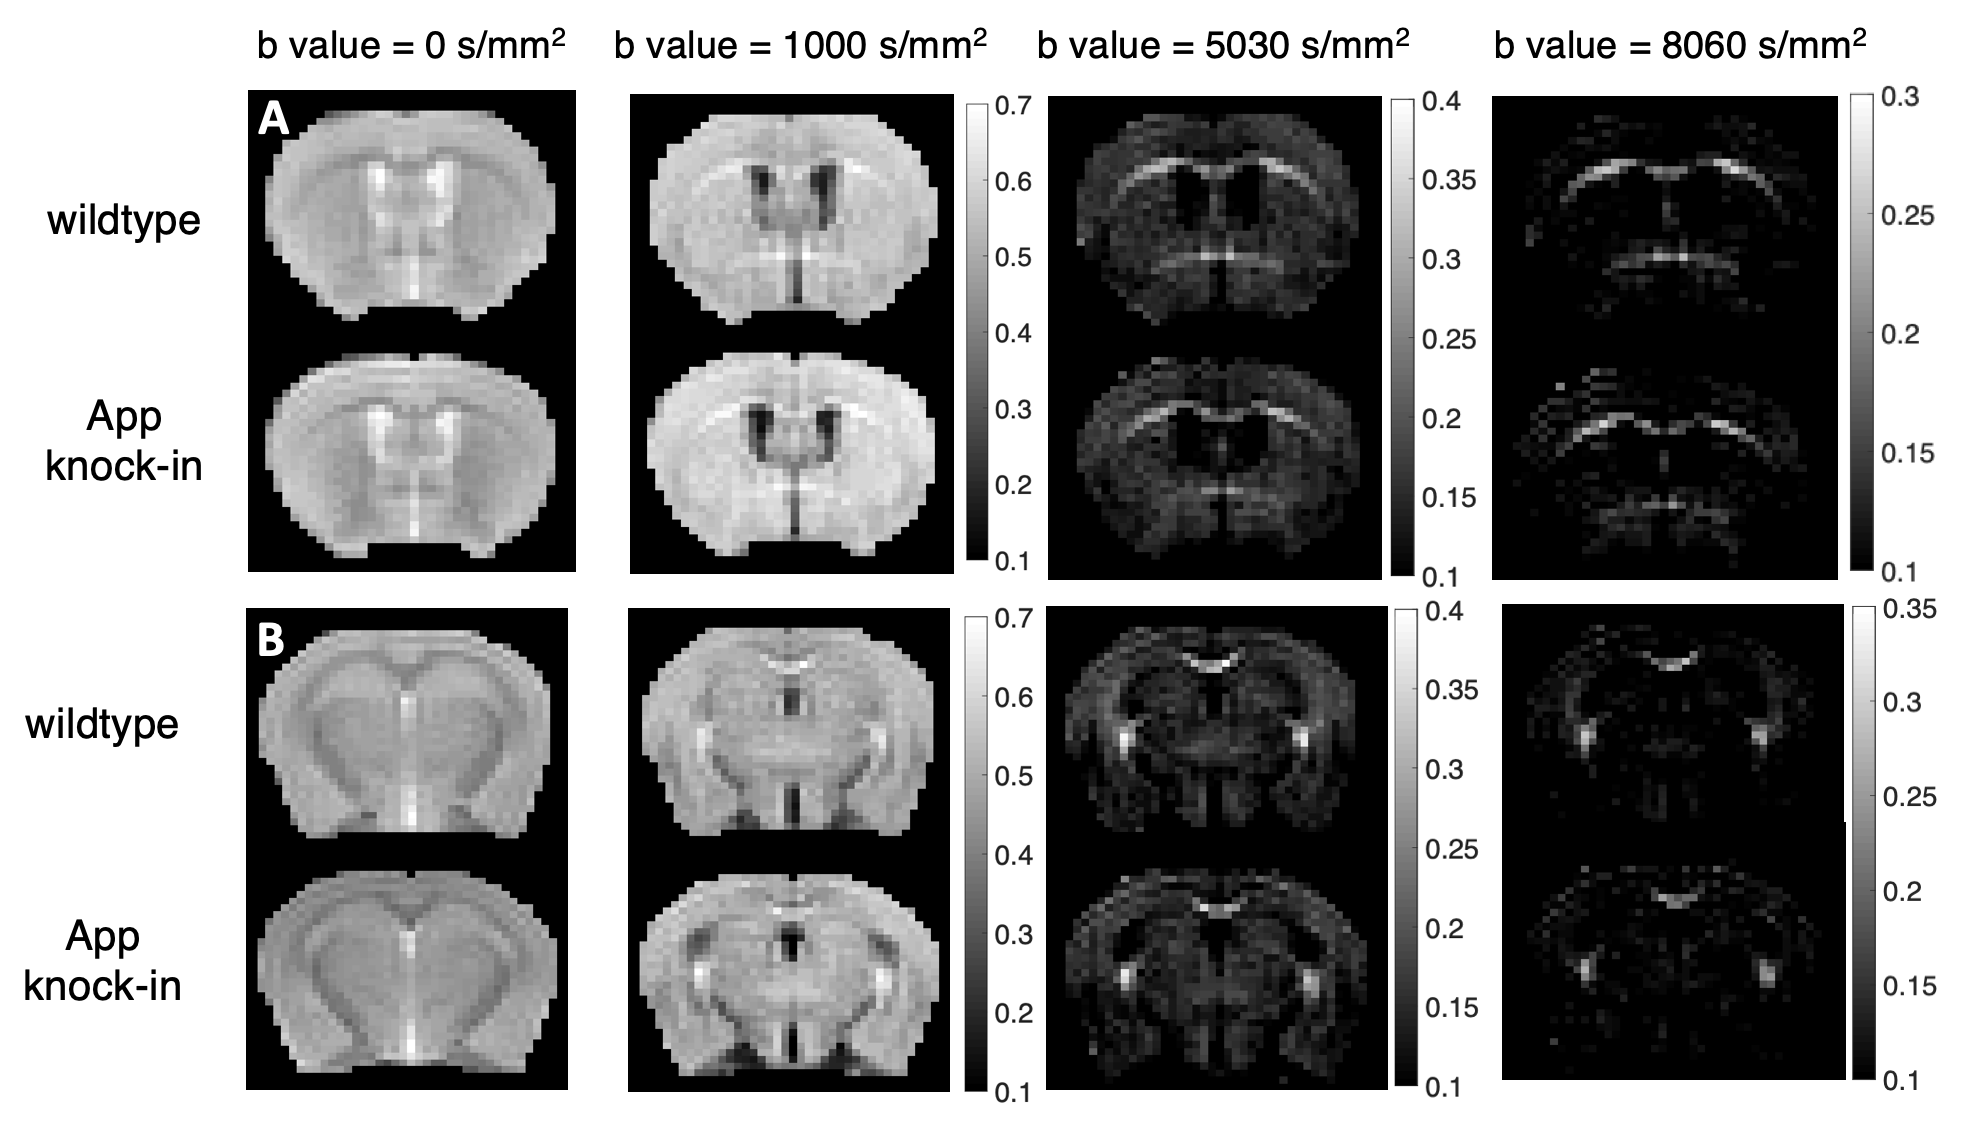
Fig. 1. Diffusion-weighted images showing CC , AC
and hippocampus in two slices (A and B) with four different b-values. Grayscale
bar show the normalized image intensity.
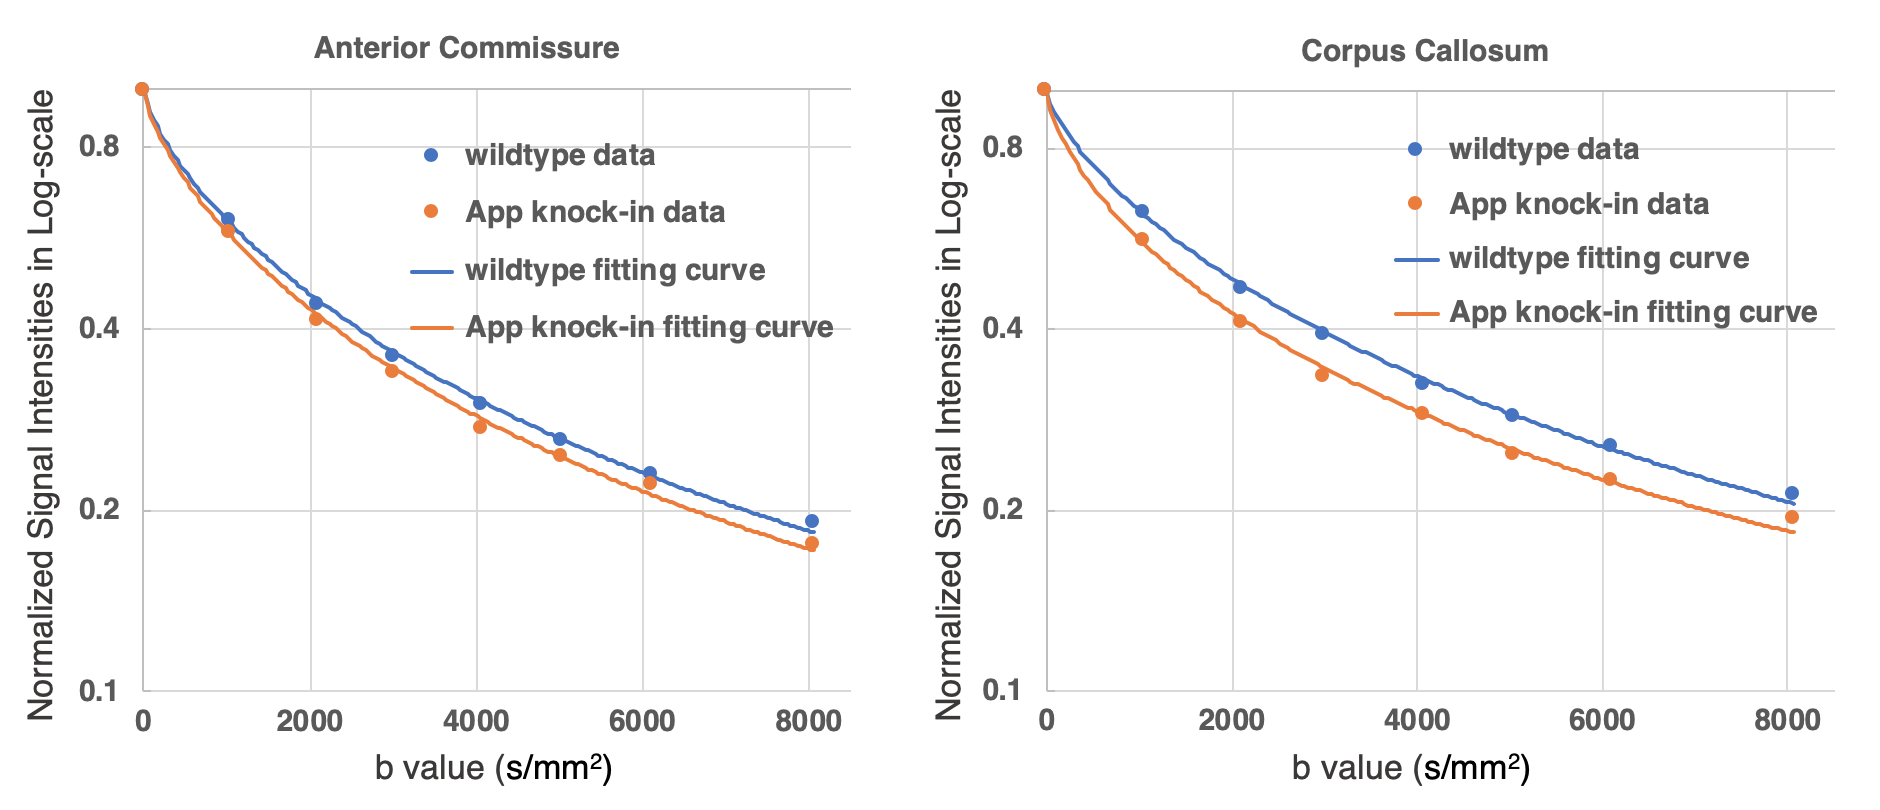
Fig. 2. Plots showing representative fitting
curves in AC (A) and CC (B) with CTRW model in normalized signal intensity vs
b-value in log-scale.
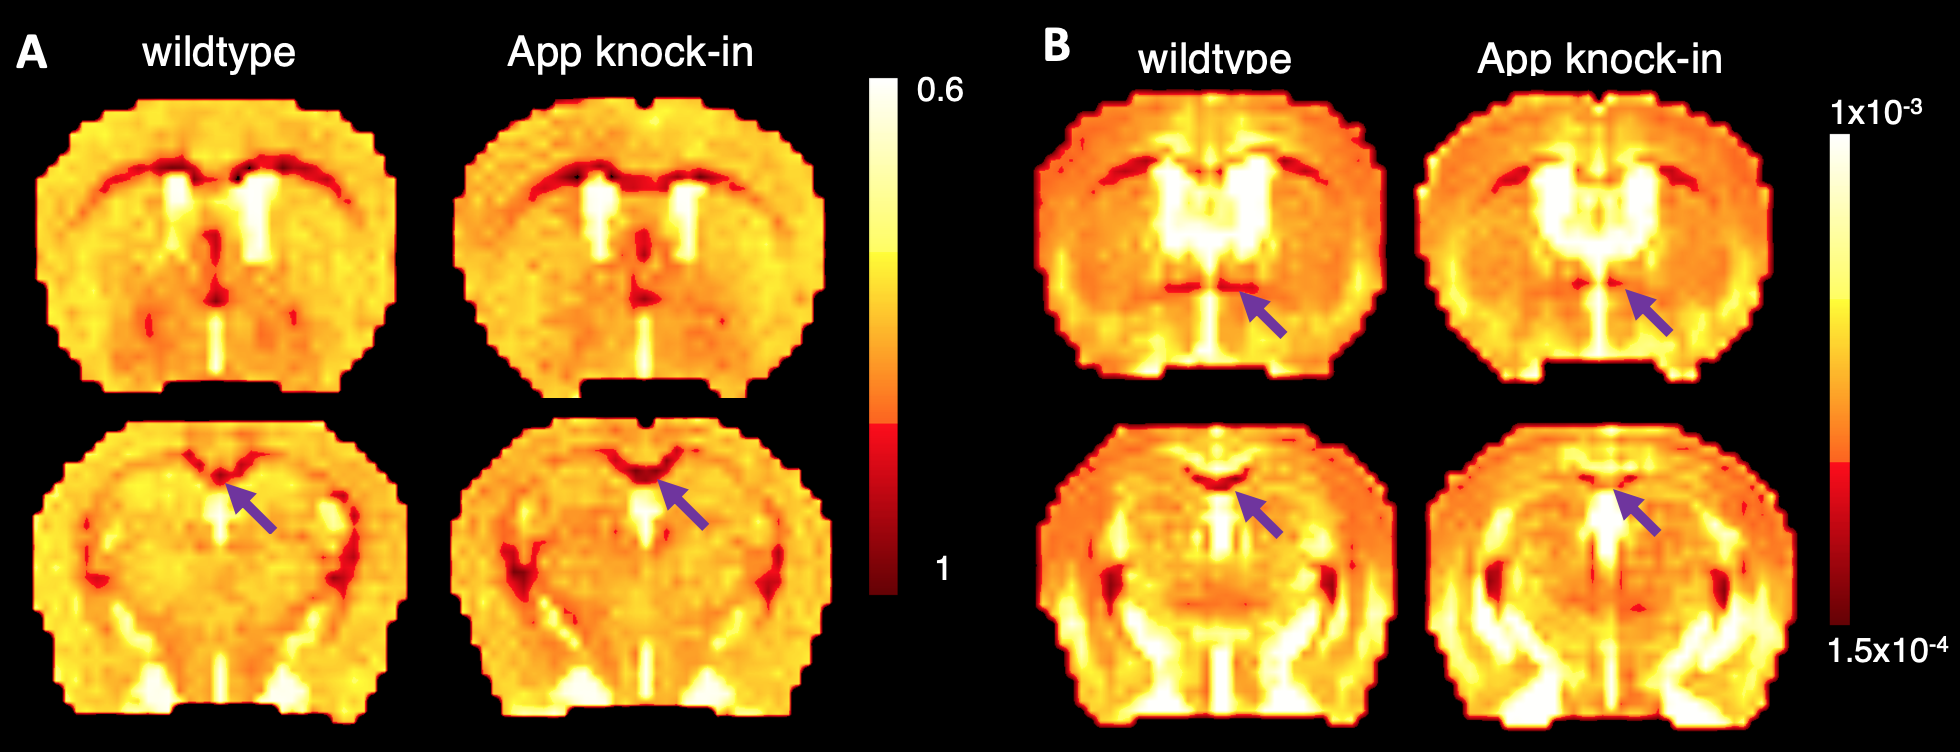
Fig. 3. Parameters maps generated from CTRW
diffusion model for two image slices of an APP knock-in mouse and corresponding
slices in WT control. A. α map with arrow pointed to CC; B, D maps (mm2/s)
with arrow
pointed to AC (upper panel) and CC (lower panel).
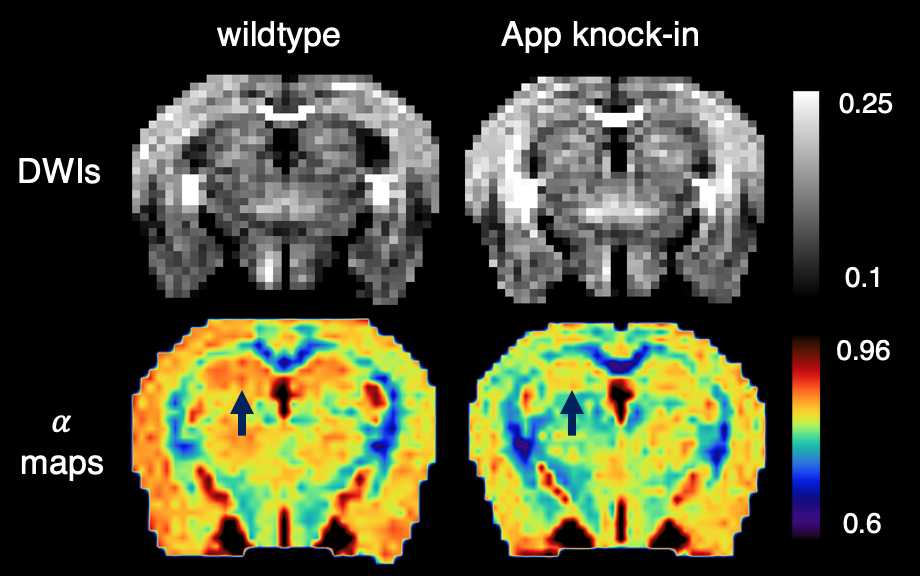
Fig. 4. Hippocampus showing lower values in α maps (lower panel) in APP knock-in mouse
comparing to the WT control. Upper panel: diffusion-weighted images
with b = 4050 s/mm2,
with gray bar showing the normalized signal intensity.
Lower panel: α maps with color bar showing the
extracted α values. Arrow points to the hippocampus.