4544
Diffusion Tractography at 0.5T: Comparison to 1.5T
Jeff A Stainsby1, Chad T Harris1, Andrew T Curtis1, Philip J Beatty1, and Curtis N Wiens1
1Synaptive Medical, Toronto, ON, Canada
1Synaptive Medical, Toronto, ON, Canada
Synopsis
The feasibility of generating diffusion tractography from data obtained on a head-only 0.5T system is demonstrated and results are compared qualitatively to tractography generated from clinical 1.5T data. DTI data from 0.5T compares favorably in quantitative (FA, ADC) measures to literature values, and qualitative (segmented white matter tracts) measures to 1.5T.
Introduction
Diffusion tensor imaging (DTI) is emerging as an important tool for the pre-operative planning of surgical treatment for many neurosurgical pathologies [1]. There is growing interest in increased accessibility to MR including locating systems closer to the point-of-care [2]. Lower field scanners with high-performance gradients have advantages in this context including less restrictive siting requirements, improved spatial fidelity through reduced geometric distortions, and diffusion imaging performance that can be comparable to 1.5T [3]. In this work we compare DTI imaging on a head-only 0.5T system designed for improved accessibility to standard clinical 1.5T imaging.Methods
Imaging was performed on two healthy volunteers with informed consent in compliance with health and safety protocols. Isotropic 3D T1-weighted images and DTI images were acquired on a head-only 0.5T system and compared to previously acquired data from a 1.5T system (Philips Achieva, Best, Netherlands). Images were then processed using a commercially available whole brain tractography and surgical planning software (Modus PlanTM, Synaptive Medical, Toronto). Acquisition parameters were as follows. 1.5T: 2.4 x 2.4 x 3mm resolution, 32 diffusion directions, scan time 9:56; 0.5T: 2.4 x 2.4 x 3.0mm resolution, 60 diffusion directions, scan time 10:19.Quantitative FA and ADC images were available at 0.5T and following the method of Hakulinen et al [4] mean FA and ADC values were computed in ROIs placed in the genu of the corpus callosum, the anterior corona radiata and the basal pons and compared to literature values.
Whole brain DTI results were compared qualitatively for the definition of major white matter tracts, applicability for automatic white matter segmentation and appropriate definition of key white matter bundles in automatically segmented results.
Results
Mean FA and ADC values at 0.5T were similar to values reported in the literature for regions in various locations in the brain (Table 1). Qualitatively, FA, ADC and RGB maps obtained at 0.5T compared favorably to those obtained at 1.5T in the clear identification and directionality of major white matter tracts, and in the similarity of ADC maps (Figure 1). Note that due to reduced chemical shift effects, fat saturation was not applied at 0.5T.Tractography from both 0.5T and 1.5T were able to visualize major white matter tracts throughout the brain including numerous branching tracts. DTI data from both volunteers at both field strengths was of sufficient quality for successful automatic white matter segmentation (Figure 2).
Qualitative comparisons between tractography results from 0.5T and 1.5T of the corticospinal tract, and the fornix demonstrated reasonable identification of these key fiber bundles, and good agreement in the characteristic of the bundles (Figure 3).
Discussion
Quantitative computed FA and ADC values are in close agreement with literature values.Processed RGB and FA maps and whole brain tractography had similar appearance between 0.5T and 1.5T compared to historical scans of the same volunteers from 2016. Due to the presence of fat in the 0.5T images, FA, ADC and RGB images contain structure in the subcutaneous fat of the scalp which can be addressed in the future with the use of fat suppression. Despite the significantly lower SNR associated with 0.5T compared to 1.5T, DTI results were similar. There is some apparent reduction in tract density at 0.5T. Regardless, these results demonstrate that DTI on a head-only 0.5T system with high-performance gradients can produce a significant improvement in both image quality and scan time over previously reported DTI performed at 0.5T [5].
Automatic white matter segmentation was successful on all studies. Fiber tracts which are good indicators of DTI fidelity include the fornix, and corticospinal tract due to their complex paths and deep brain locations. There is good qualitative agreement in the shape, location and extent of those structures.
Conclusion
This work has demonstrated that whole brain DTI at 0.5T (1) provides qualitatively similar segmented volumes and processed DTI images as 1.5T and (2) is of sufficient quality for automatic white matter segmentation.Acknowledgements
The authors would like to acknowledge Tim Hayes and Alicia McNeely for assistance with Modus Plan.References
- Essayed WI, Zhang F, Unadkat P, Cosgrove GR, Golby AJ, O’Donnell LJ. White matter tractography for neurosurgical planning: A topography-based review of the current state of the art. NeuroImage: Clinical. 2017;15:659-672.
- Panther A, Thevathasen G, Connell IRO, Yao Y, Wiens CN, Curtis AT, Bindseil GA, Harris CT, Beatty PJ, Stainsby JA, Cunningham CH, Chronik BA, Piron C. A Dedicated Head-Only MRI Scanner for Point-of-Care Imaging. Proceedings of the 27th Annual Meeting of ISMRM. Montreal, Canada, 2019. Abstract 3679
- Stainsby JA, Harris CT, Bindseil GA, Wiens CW, Beatty PJ, Curtis AT, High-Performance Diffusion Imaging on a 0.5T System, Proceedings of the 27th Annual Meeting of ISMRM. Montreal, Canada, 2019. Abstract 1193.
- Hakulinen U, Brander a, Ryymin P, Ohman J, Soimakallio S, Helminen M, Dastidar P, Eskola H, Repeatability and variation of region-of-interest methods using quantitative diffusion tensor MR imaging of the brain, BMC Medical Imaging, 2012, 12:30
- Hori M, Okubo T, Aoki S, Kumagai H, Ariki T. Line scan diffusion tensor MRI at low magnetic field strength: Feasibility study of cervical spondylotic myelopathy in an early clinical stage. Journal of Magnetic Resonance Imaging. 2006;23:183-188.
Figures
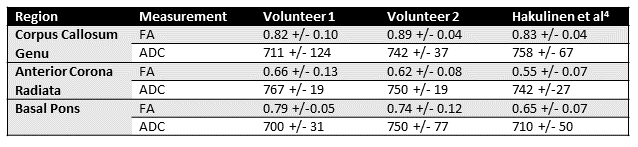
Table 1: Quantitative
comparison of mean pixel values in computed FA and ADC images in the genu of
the corpus callosum, the anterior corona radiata and the basal pons from DTI
data acquired at 0.5T and literature reported values.
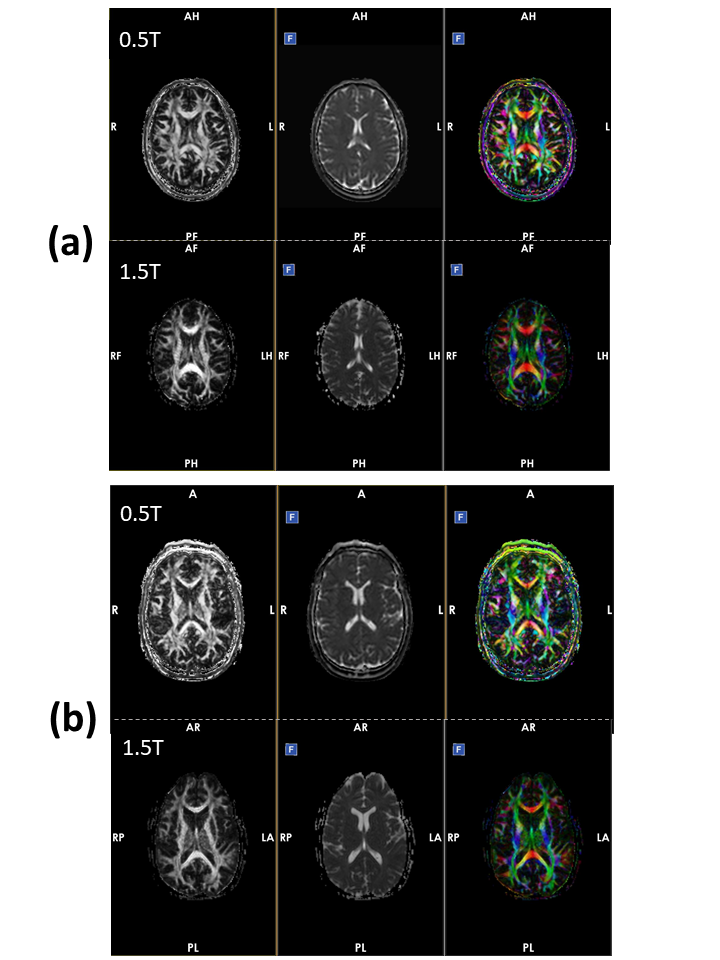
Figure 1: (a)
Representative processed FA (left), ADC (middle), and RGB (right) images from volunteer
#1 obtained at 0.5T (top) and 1.5T (bottom). (b) Analogous images from volunteer #2.
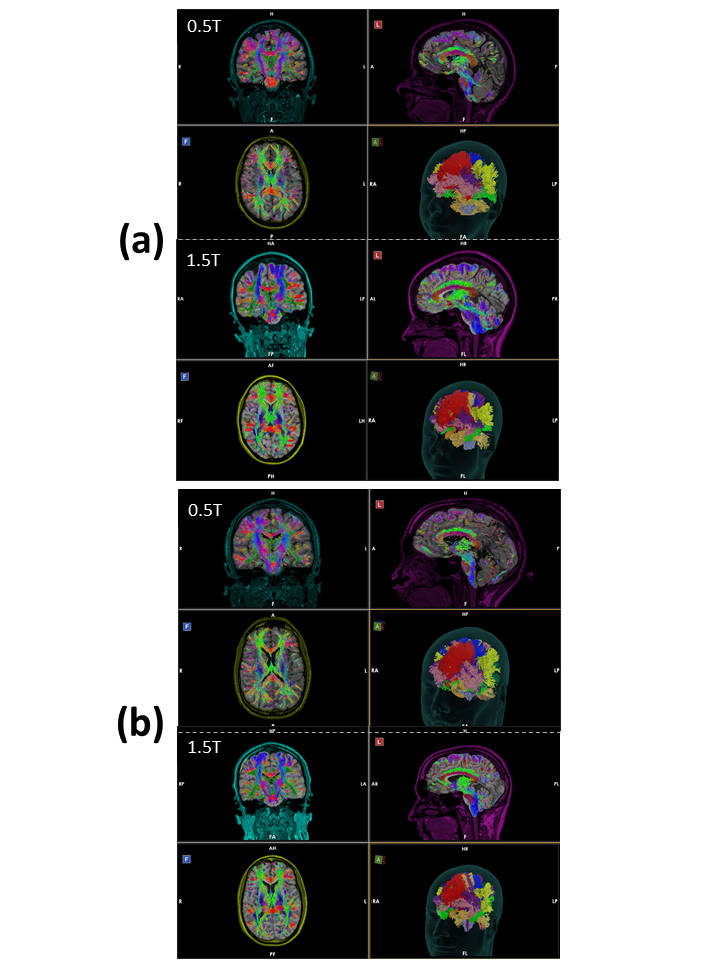
Figure 2: (a)
Representative whole brain tractography demonstrated in 3 orthogonal imaging
planes and whole brain automatic white matter segmentation results from volunteer
#1 obtained at 0.5T (top) and 1.5T (bottom). (b) Analogous tractography images
obtained from volunteer #2.
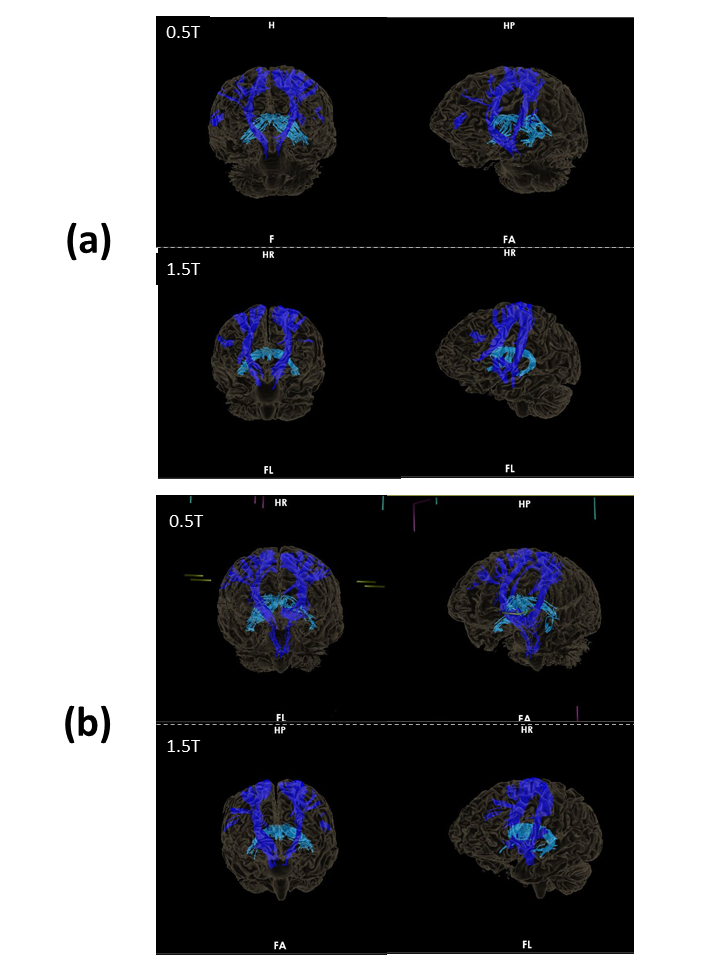
Figure 3: (a) Two
separate views of automatically segmented tract bundles of the corticospinal
tract (blue), and fornix (cyan) obtained from volunteer #1 at
0.5T (top) and 1.5T (bottom). (b) Analogous automatically segmented white
matter bundles from volunteer #2.