4542
Diffusion-Ordered NMR Spectroscopy Reconstruction Based on Low-rank and Sparse Inverse Laplace Transform1Department of Electronic Science, Xiamen University, Xiamen, China
Synopsis
DOSY (Diffusion-ordered NMR spectroscopy) presents an essential tool for the analysis of compound mixtures. However, existing DOSY reconstruction methods is limited by its relatively low resolution. Here, based on constraints on low rank and sparsity of DOSY data, we propose a reconstruction method to achieve high-resolution DOSY spectrum for measurements on complex mixtures, even when component signals are congested and mixed together along the spectral dimension. Experiment results indicate that our method is robust and possesses high-resolution reconstruction performance.
Introduction
DOSY1 presents an effective tool for identifying chemical substances in mixtures and detecting intermolecular interactions2, by differentiating NMR signals of a compound mixture according to differences in the molecular translational diffusion. High-resolution DOSY reconstruction requiring excellent peak alignment and narrow peak width in diffusion dimension. Unfortunately, these two objectives are difficult to achieve concurrently, particularly for measurements on complex mixtures that contains congested 1D NMR resonances. Here, based on constraints on low rank and sparsity of DOSY data, we propose a reconstruction method to achieve high-resolution DOSY spectrum with excellent peak alignments and accurate diffusion coefficients for measurements on complex mixtures, even when component signals are congested and mixed together along the spectral dimension.Methods
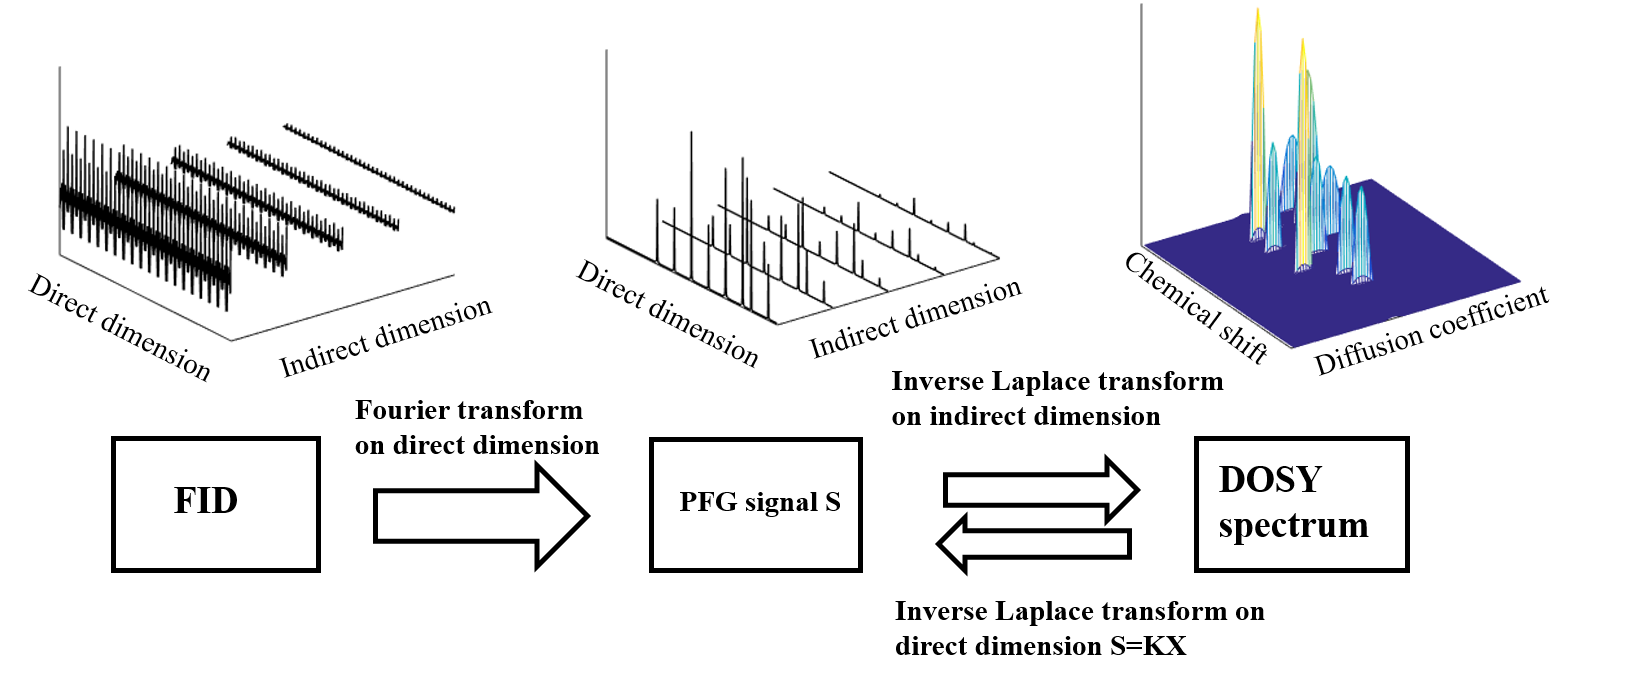
A 2D DOSY spectrum has a chemical shift dimension and a diffusion coefficient dimension. By Fourier transforming on FID data along direct dimension, we get PFG (Pulse Field Gradient) signals which are a kind of exponential decaying signals along indirect dimension. In order to obtain DOSY reconstruction spectrum, ILT (Inverse Laplace Transform) is performed on PFG signal along indirect dimension to figure out the decay rates. The integrated DOSY data processing flow diagram is illustrated in Figure 1. The desired DOSY spectrum should have narrow lineshape to ensure the spectral resolution, and with peaks well-aligned along the diffusion dimension. In mathematical terms, the ideal DOSY data matrix should be sparse and with low rank. In addition to non-negativity of DOSY spectrum data, we proposed a joint low rank and sparse inverse Laplace transform (LRSpILT) modelled as (1). \[\mathbf{X}=\underset{\mathbf{X}\succcurlyeq \mathbf{0}}{\mathop{\arg \min }}\,\frac{1}{2}\left\| \mathbf{KX}-\mathbf{S} \right\|_{F}^{2}+{{\lambda }_{1}}{{\left\| \mathbf{X} \right\|}_{*,b}}\text{+}{{\lambda }_{2}}{{\left\| \mathbf{X} \right\|}_{1,\mathbf{A}}}\] where $$$\mathbf{K}\in {{\mathbf{R}}^{p\times n}}$$$ denotes Laplace transform matrix, $$$\mathbf{S}\in {{\mathbf{R}}^{p\times m}}$$$ is the discretized gradient field attenuation signal. $$$\mathbf{X}\in {{\mathbf{R}}^{n\times m}}$$$ is the DOSY spectrum data matrix, which needs to be reconstructed.$$$ {{\left\| \bullet \right\|}_{*,b}}$$$is the weighted nuclear norm with the weighted factor vector $$$b\in {{\mathbf{R}}^{1\times r}}$$$, which constrains the low-rank of X. The weighted nuclear norm is defined as: \[{{\left\| \mathbf{X} \right\|}_{*,\mathbf{b}}}=\sum\limits_{i=1}^{r}{{{b}_{i}}{{\sigma }_{i}}}\] where $$${{\sigma }_{i}}$$$ is the i-th singular value of X, and r is the rank of $$$\mathbf{X}\$$$. A is the weighted l1 norm of the matrix, and $$$\mathbf{A}$$$ is the weighted factor matrix which constrains sparsity of X. $$${{\lambda }_{1}}$$$ and $$${{\lambda }_{2}}$$$ denote the regularized parameters, which trade off the nuclear norm and l1 norm, respectively. $$$\mathbf{X}\succcurlyeq \mathbf{0}$$$ constrains non-negativity of all elements in X. We utilize ADMM (Alternative Direction Multiplier Method)3 to solve (1) and obtain high-resolution DOSY.Result
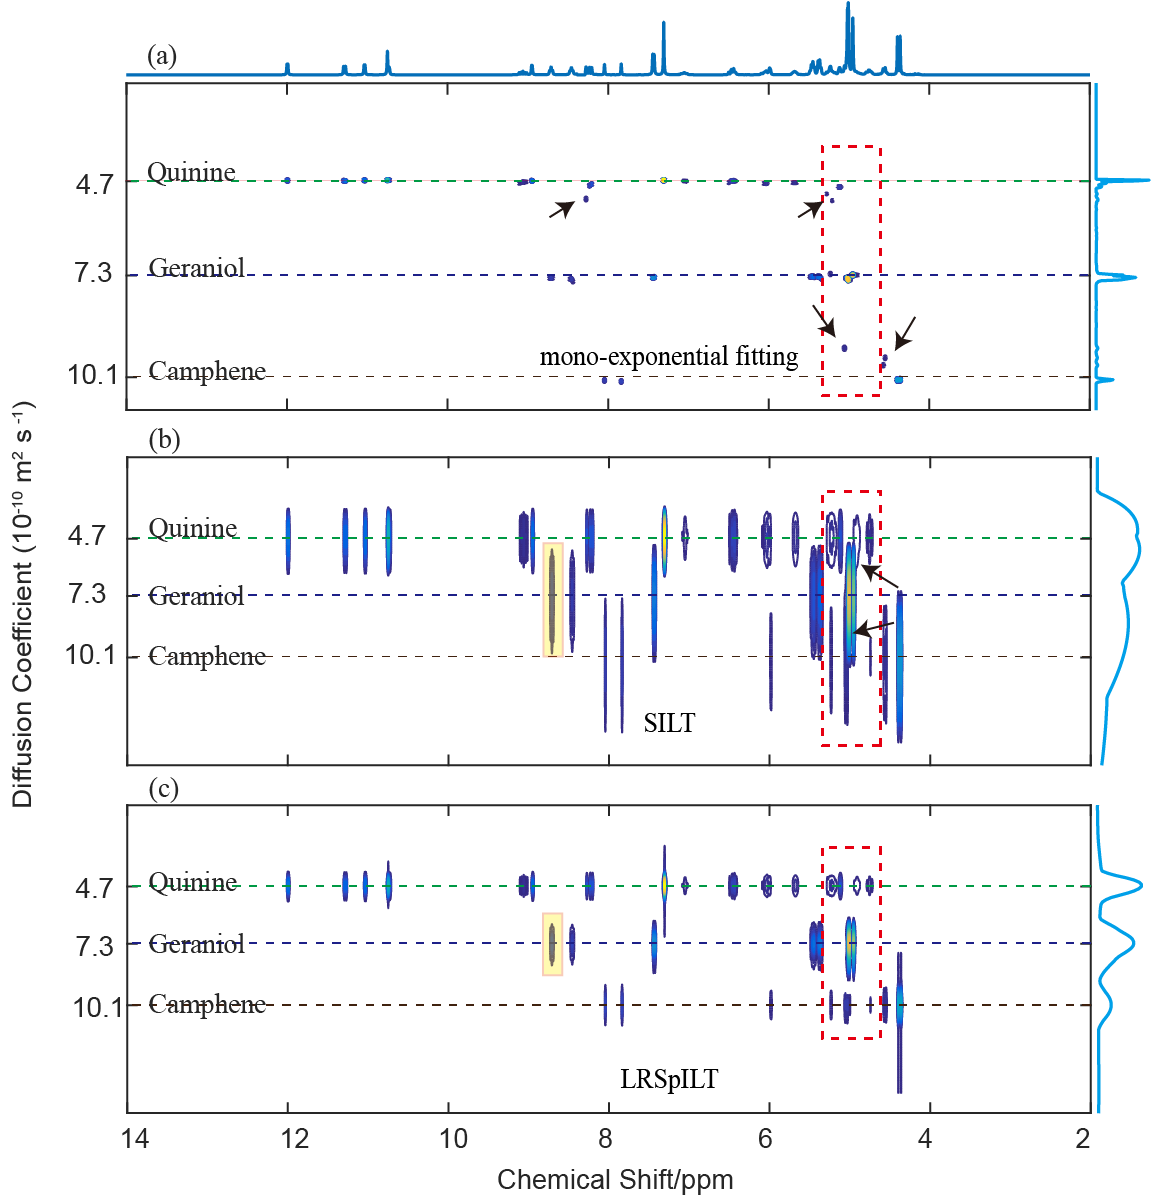
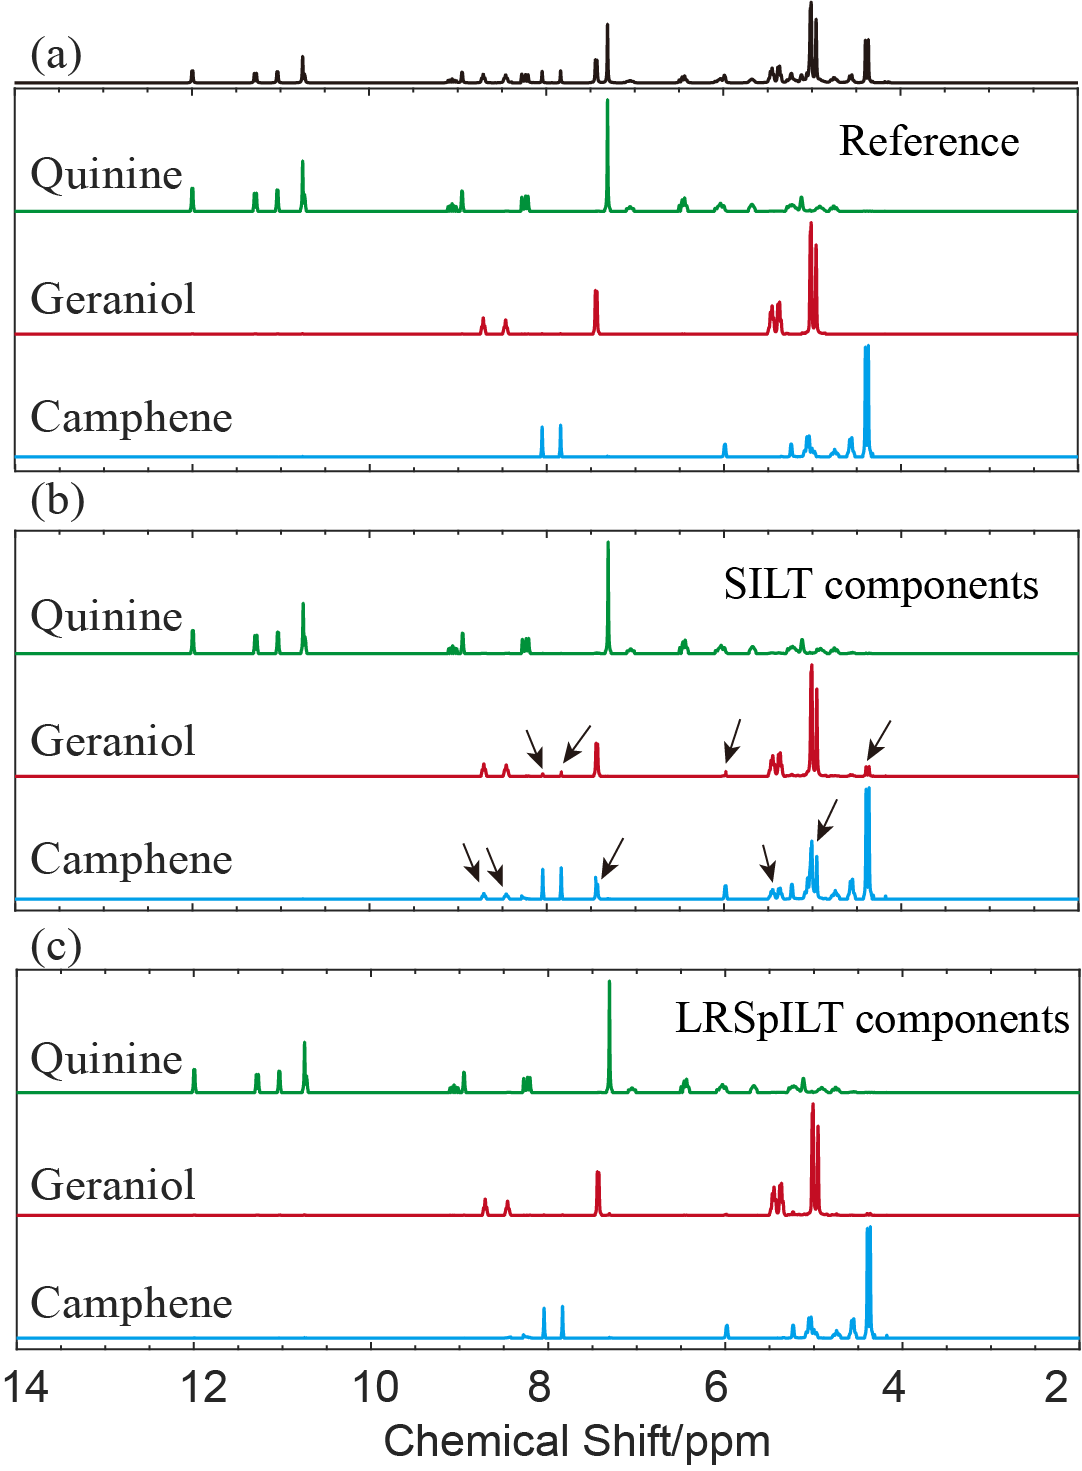
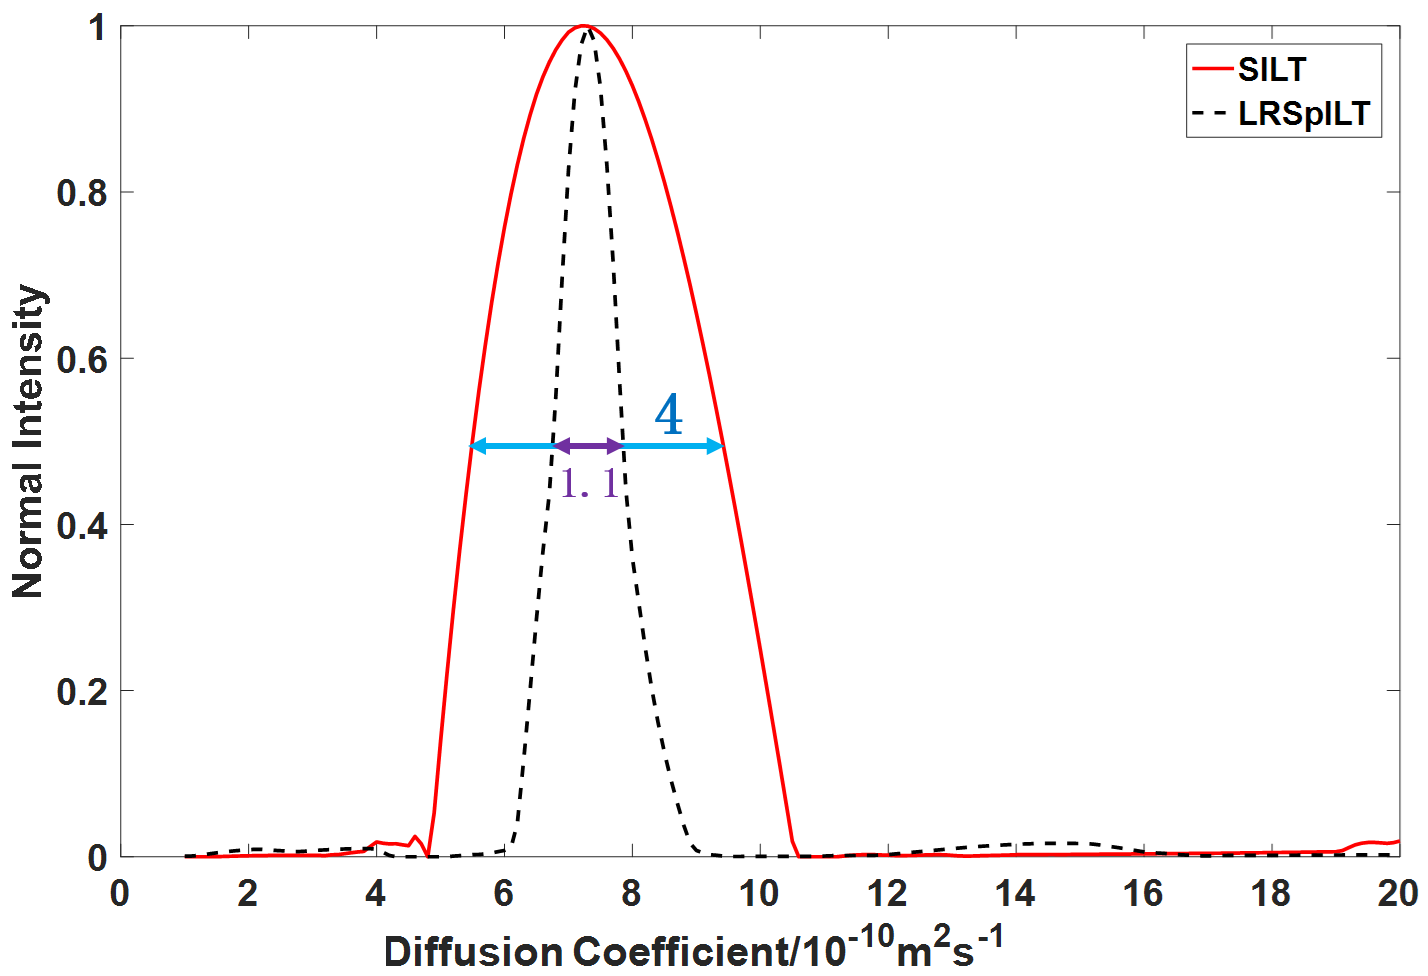
Through the reconstruction of sample QGC4 shown in Figure 2, we can see that spectral peaks of mono-exponential fitting5 reconstruction spectrum (Figure 2a) have some deviation from the reference lines and even artefacts, which might give rise to incorrect analysis of molecular components, and peaks are broadened along the diffusion dimension and serious peak overlapping is observed in the SILT6 reconstruction spectrum(Figure 2b). Our method (Figure 2c) performs better in peak alignment than mono-exponential fitting and has narrower peaks than SILT. Through analysis of peaks (highlighed in Figure 2(b)(c)) shown in Figure 4, the width at half higheit of spectral peak of our method is approxiamtely 4 times narrower than that of SILT. From spectra of separated 1D components shown in Figure 3, compared with reference spectra (Figure 3 (a)) we can see that there are clearly some artefacts in SILT results (Figure 3 (b)), while our method results present more accurate diffusion measurements with higher resolution in the diffusion dimension (Figure 3 (c)). In a word, our method balances well between peak alignment and narrow peaks and therefore achieves high-resolution DOSY reconstruction.Acknowledgements
This work was supported by the National Natural Science Foundation of China under grant numbers 61601386 and 11761141010.References
[1] Groves, P. Polym. Chem. 2017, 8, 6700-6708.
[2] Yu, M.; Meng, L.; Li, H.; Zhang, C. Crystengcomm 2017, 19, 3145-3155.
[3] Mathias, N. J. Magn. Reson. 2009, 200, 296-302.
[4] Giampouras, P.; Themelis, K.; Rontogiannis, A.; Koutroumbas, K. IEEE Trans.Geosci. Remote. 2016, 54, 4775-4789.
[5] Foroozandeh, M.; Castañar, L.; Martins, L. G.; Sinnaeve, D.; Poggetto, G. D.; Tormena, C. F.; Adams, R. W.; Morris, G. A.; Nilsson, M. Angew. Chem. 2016, 128, 15808-15811.
[6] Yuan, B.; Ding, Y.; Kamal, G. M.; Shao, L.; Zhou, Z.; Jiang, B.; Sun, P.; Zhang, X.; Liu, M. J. Magn. Reson. 2017, 278, 1-7.
Figures