4539
Preliminary Assessment of Intravoxel Incoherent Motion Diffusion-Weighted MRI (IVIM-DWI) Metrics in Alzheimer’s Disease1Division of Neuroimaging Research, Barrow Neurological Institute, Phoenix, AZ, United States, 2Mayo Clinic Arizona, Phoenix, AZ, United States, 3Department of Neuropsychiatry, Barrow Neurological Institute, Phoenix, AZ, United States, 4Lou Ruvo Center for Brain Health, Cleveland Clinic, Las Vegas, NV, United States, 5The Muhammad Ali Parkinson Center, Barrow Neurological Institute, Phoenix, AZ, United States
Synopsis
The objective of this study was to assess complementary metrics from voxel-based morphometry (VBM) and intravoxel incoherent motion diffusion-weighted images (IVIM-DWI) MRI methods in aging populations. Using voxel-based analysis, grey matter (GM) and white matter (WM) differences were analyzed across Alzheimer’s disease (AD), mild cognitive impairment (MCI), and cognitively normal (HC) individuals. IVIM-DWI demonstrated early significant differences between MCI and HC groups, while VBM did not. In addition, voxel-based correlations between neuroimaging metrics and cognitive assessments were assessed in the cognitively impaired groups (AD and MCI).
INTRODUCTION
Alzheimer's disease (AD) is a progressive neurodegenerative disease that affects aging populations. Although structural MRI is widely used to assess AD-induced morphological changes1, these changes occur late in the AD trajectory and may not be ideal early biomarkers. Functional and microstructural changes precede brain atrophy and may be detectable using advanced MRI in the earlier mild cognitive impairment (MCI) phases. The purpose of this study is to characterize differences in voxel-based morphometry (VBM)2, apparent diffusion coefficient (ADC), and IVIM-DWI3 metrics in aging populations. Additionally, the connection between cognitive performance and VBM/ADC/IVIM metrics was investigated.METHODS
Three aging populations were included in this study: 13 subjects with AD dementia (7 females; mean age±standard deviation (S.D): 77±8 years), 11 subjects with amnestic MCI (8 females; 76±5 years)4, and 14 healthy controls (HC, 9 females; 76±7 years). All participants completed the Montreal Cognitive Assessment (MoCA)5, Clock-Draw, and the Functional Assessment Staging Tool (FAST)6. MRI data were acquired at 3T (Ingenia, Philips). Standard T1-weighted (T1-w) anatomical images were acquired using a MP-RAGE acquisition (TR/TE, 6.7/3.104 ms; acquisition matrix, 256×256; voxel size, 1.06×1.06 mm; slice thickness, 1.2 mm; 170 sagittal slices; flip angle=9°). IVIM-DWI was performed using 7 b-values (25, 50, 75, 100, 200, 500, and 1000 s/mm2 with three orthogonal acquisition directions for each b-value; TR/TE, 6000/67.98 ms; acquisition matrix, 96×96; voxel size 2.5×2.5 mm; slice thickness, 2.5 mm). T1-w images were used for GM segmentation using FreeSurfer. All GM-VBM images generated in native space were warped to a T1-w group-wise template space using Advanced Normalization Tools (ANTs, http://stnava.github.io/ANTs/), followed standard procedures. For IVIM, a two-step fitting procedure was performed on the IVIM model3 to obtain D, D*, and f, which represent the pure diffusion coefficient, pseudo-diffusion coefficient, and perfusion fraction, respectively. ADC maps were generated from b=0 and 1000 s/mm2 images using a mono-exponential fit. A DWI group-wise template was created from the B0 images, and all ADC and IVIM maps were coregistered to this template through the same procedure described for VBM. Each voxel for VBM, ADC, and IVIM was fit by an ANCOVA model, with gender and age as covariates. All statistical analyses were conducted using the FSL tool Randomise7.RESULTS
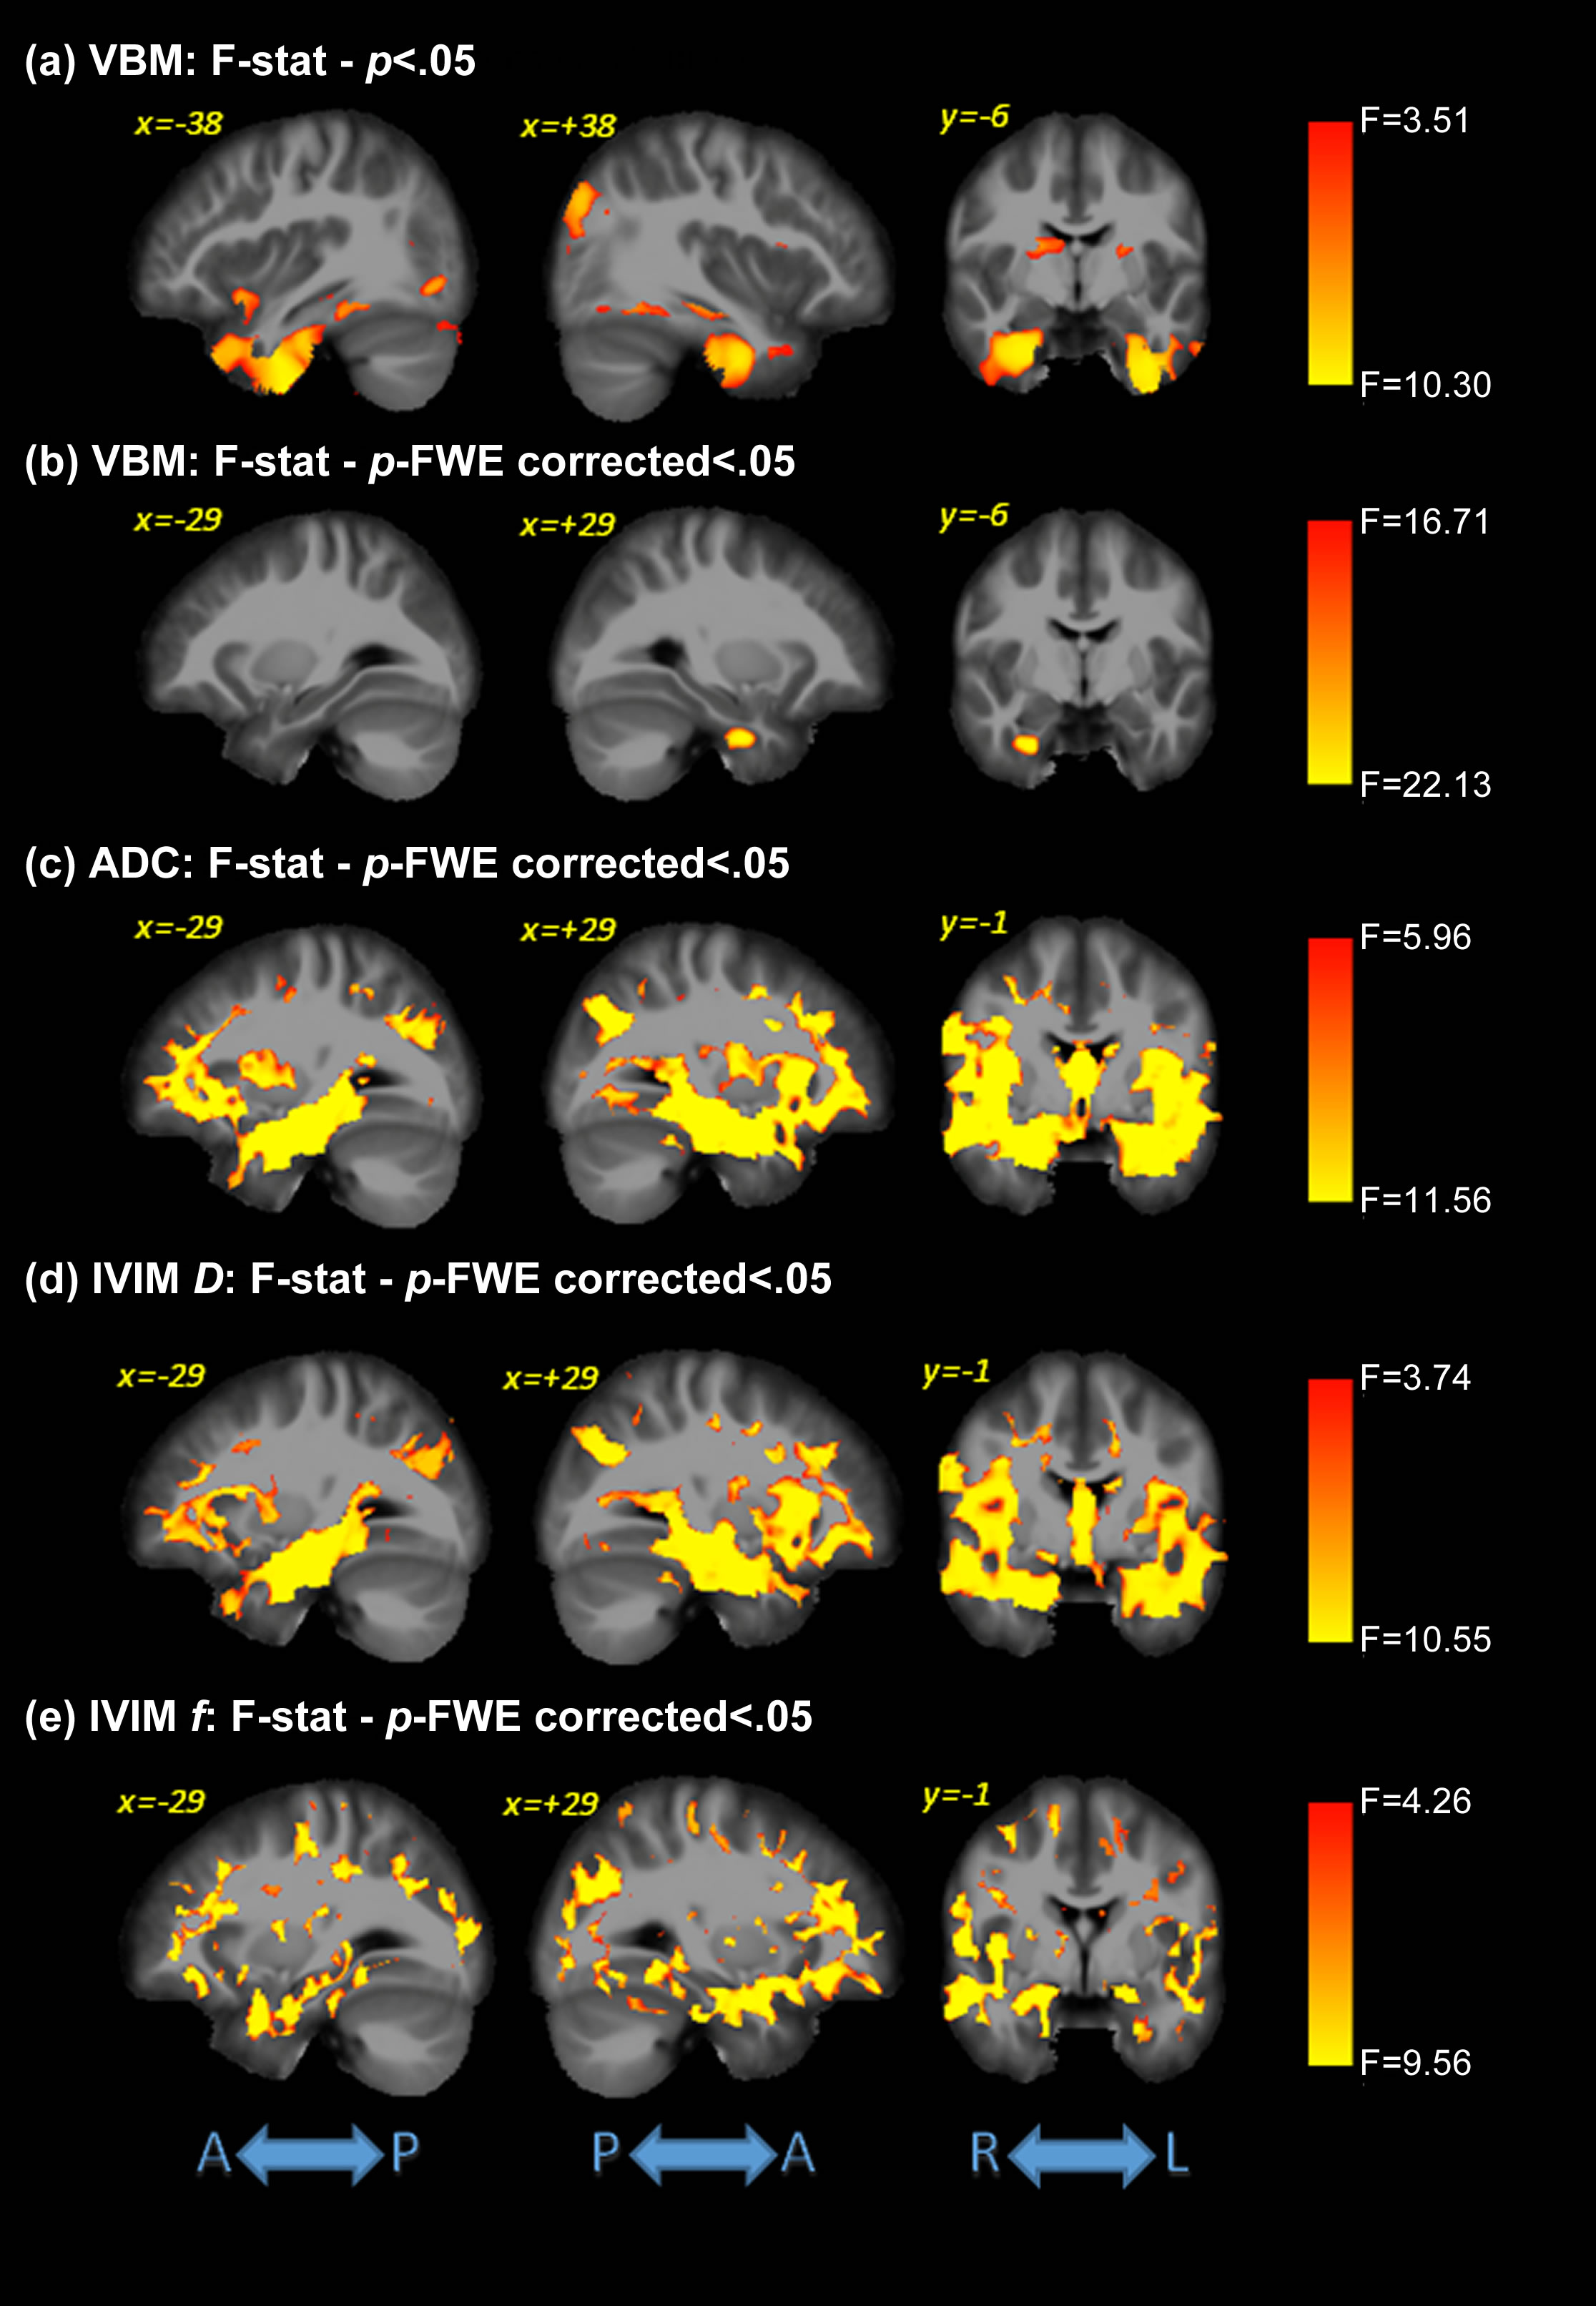
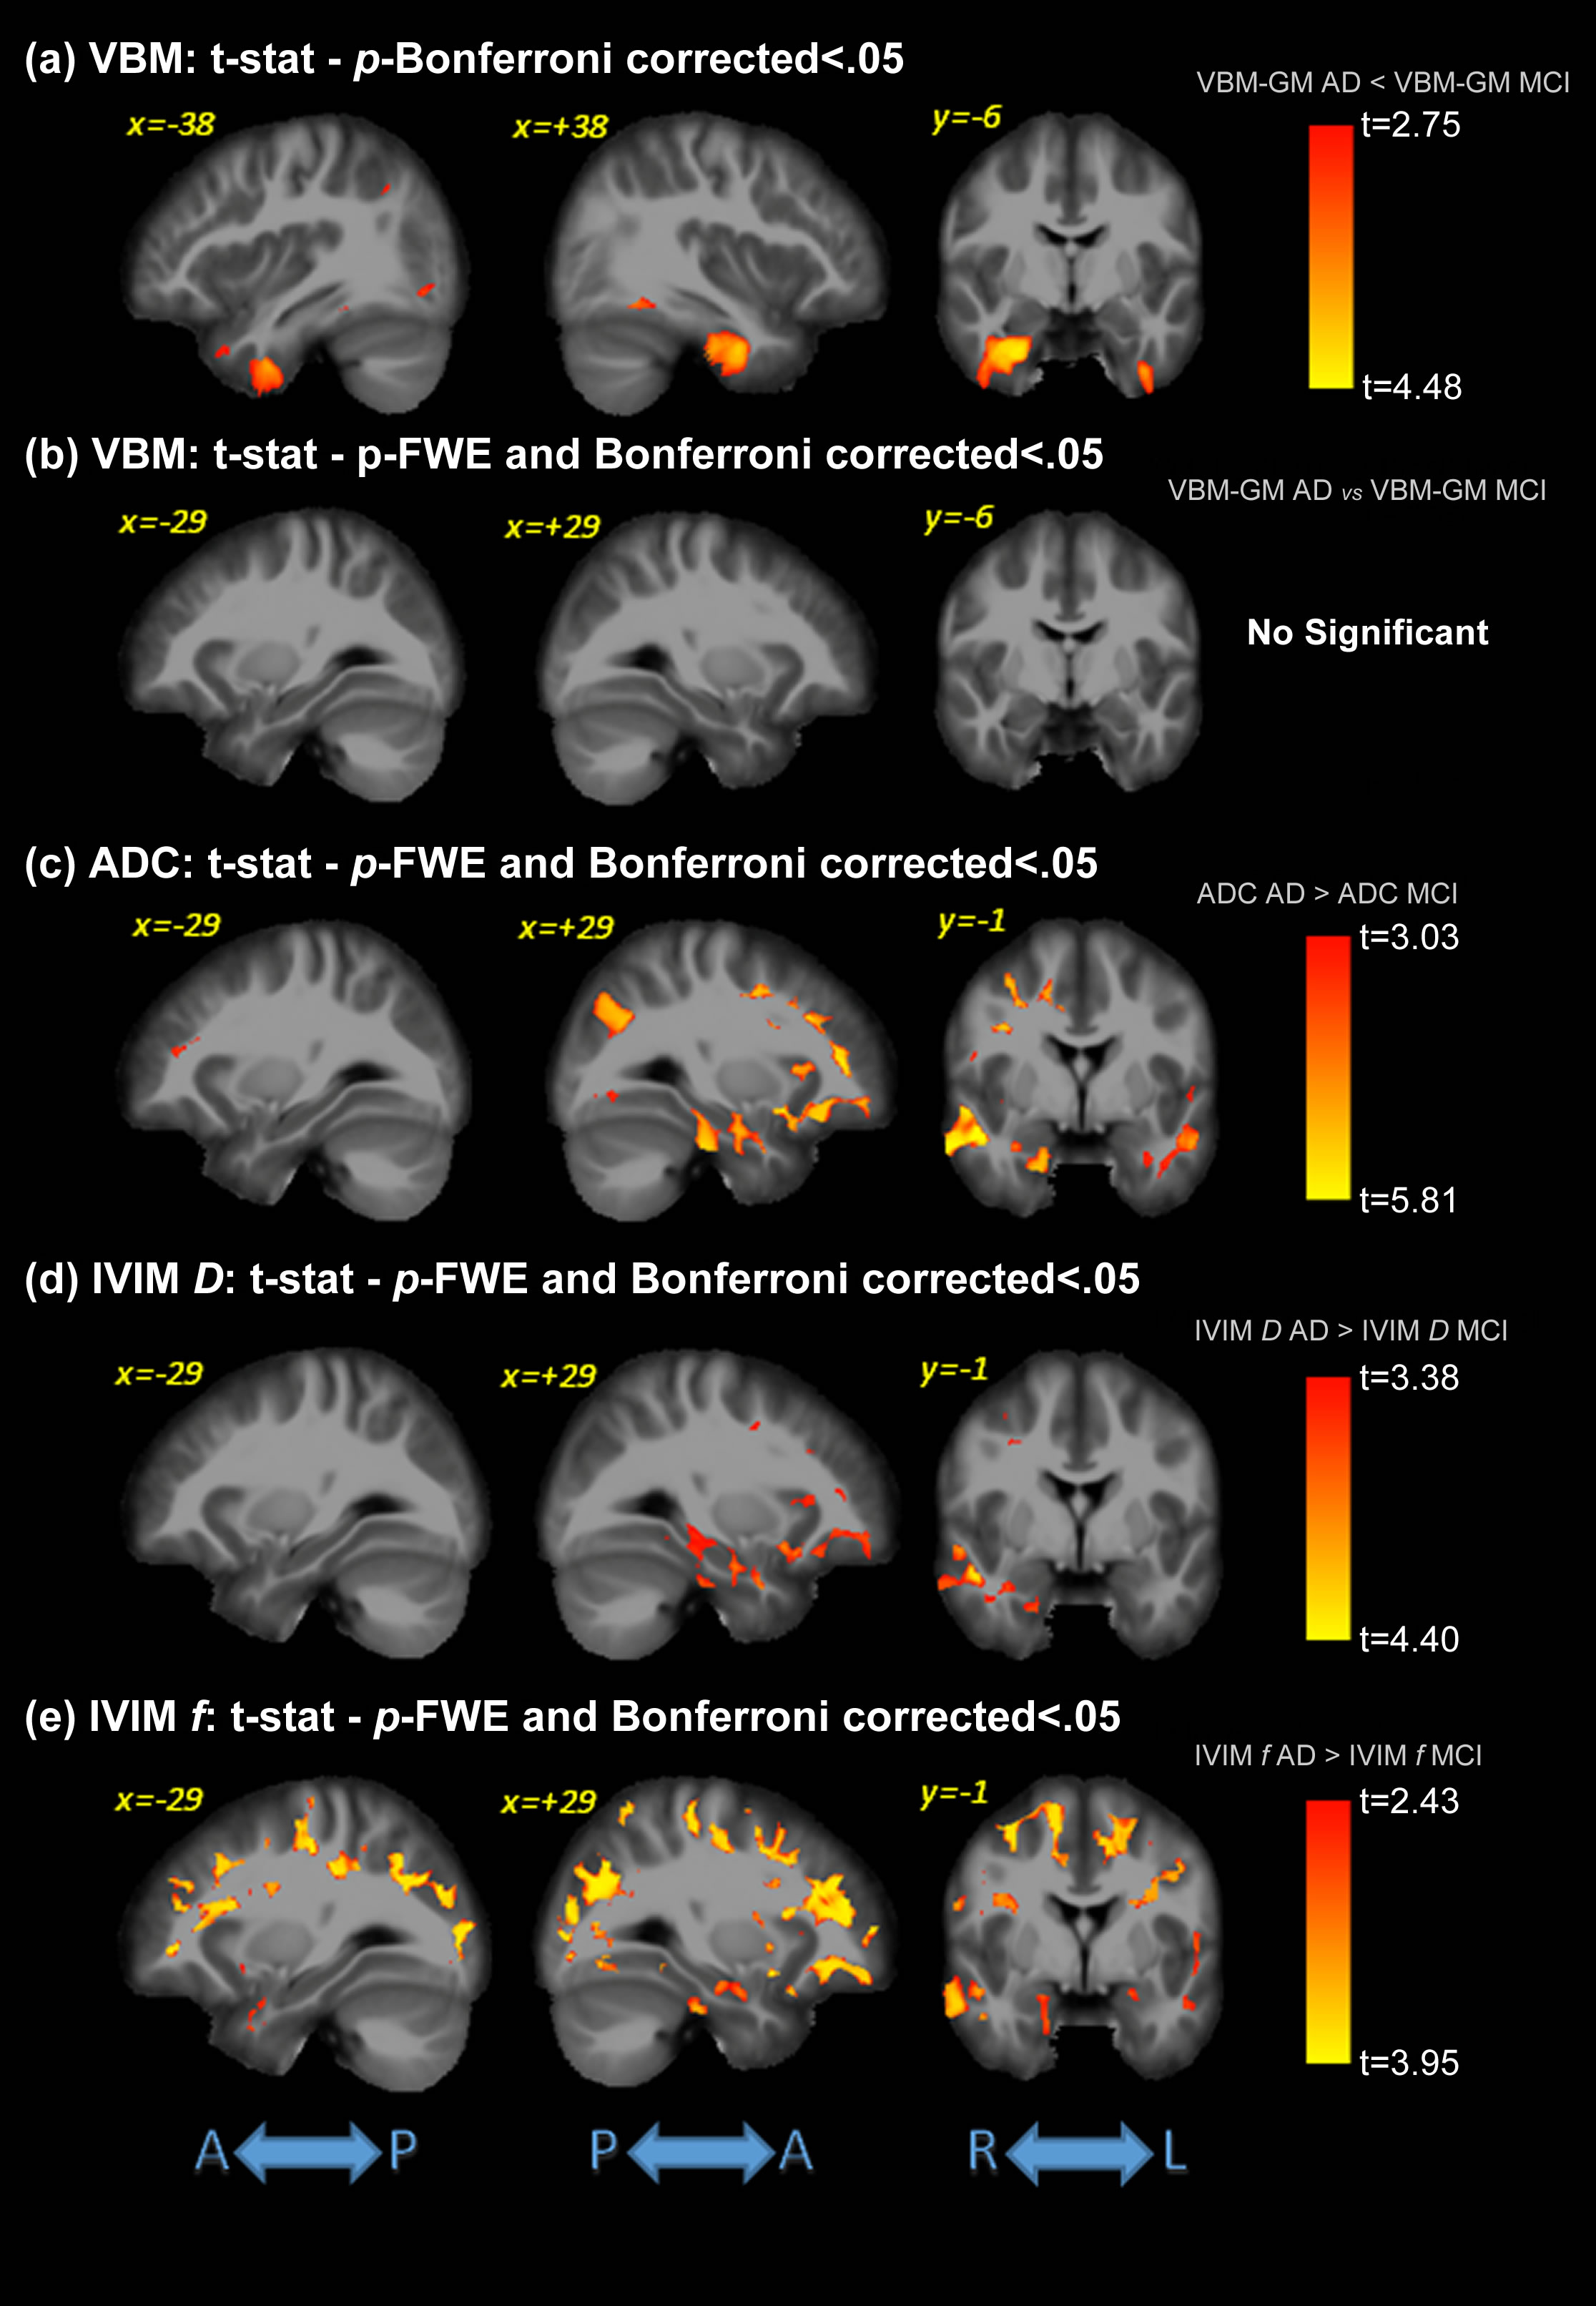
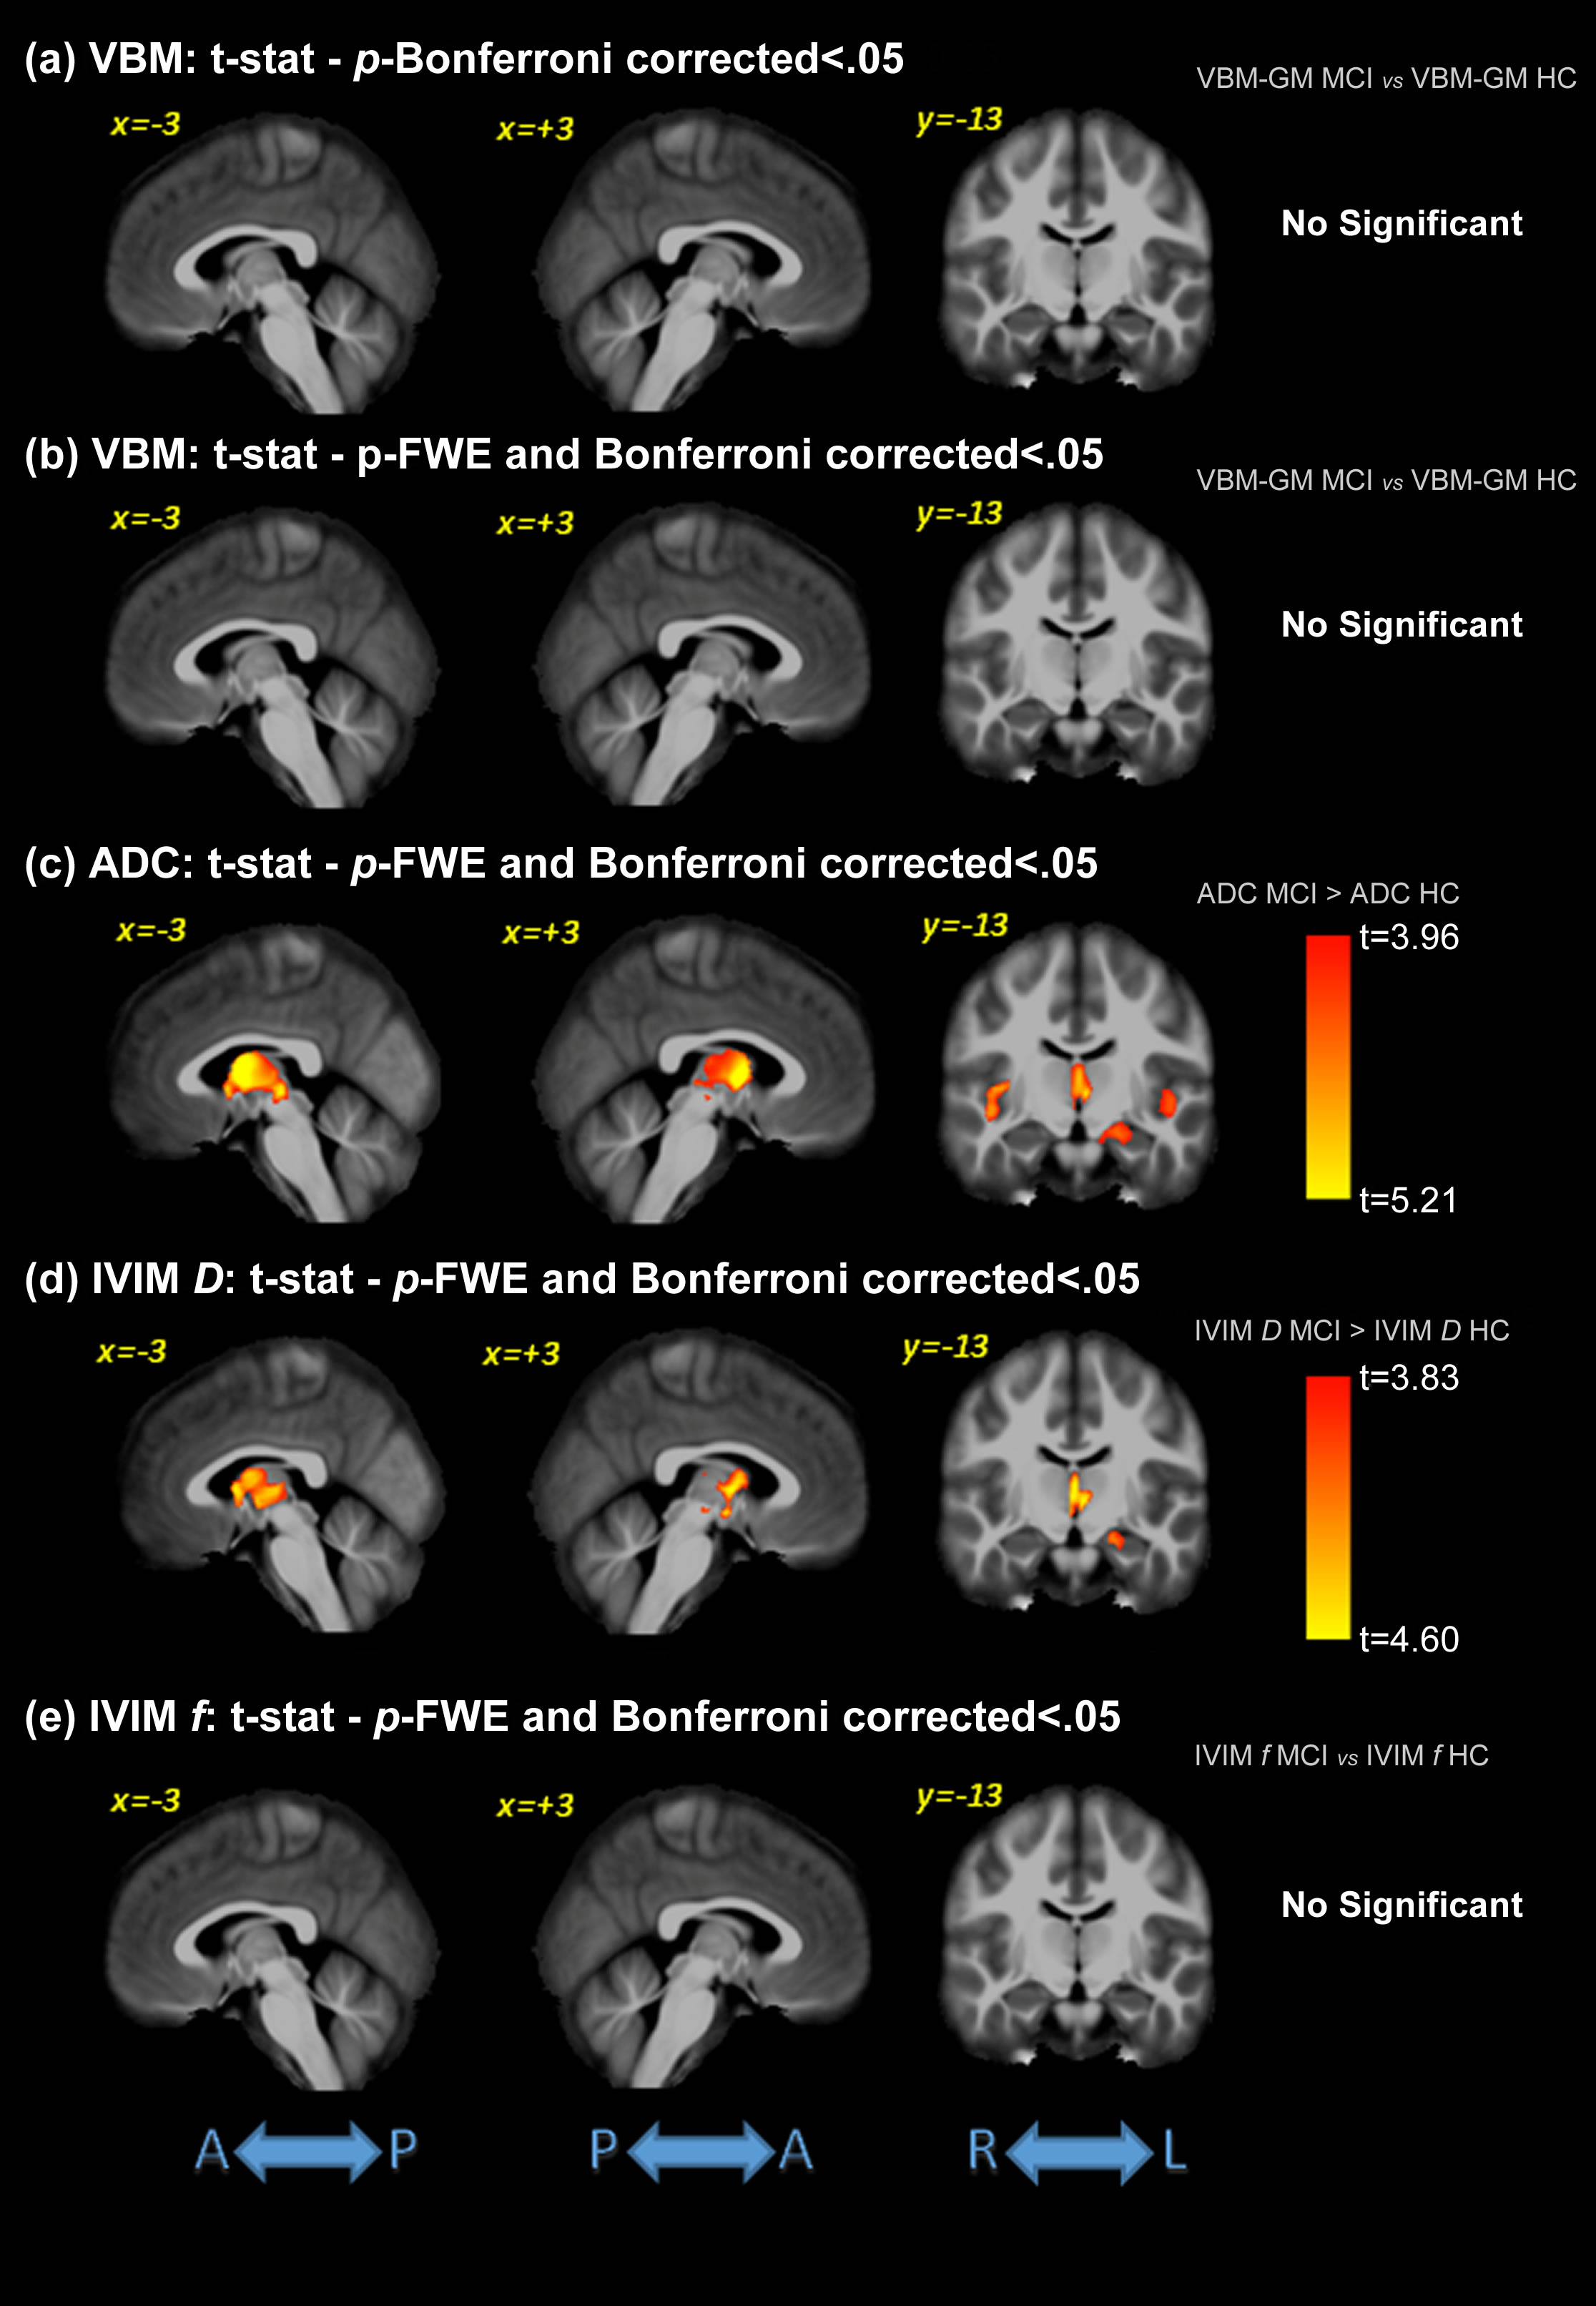
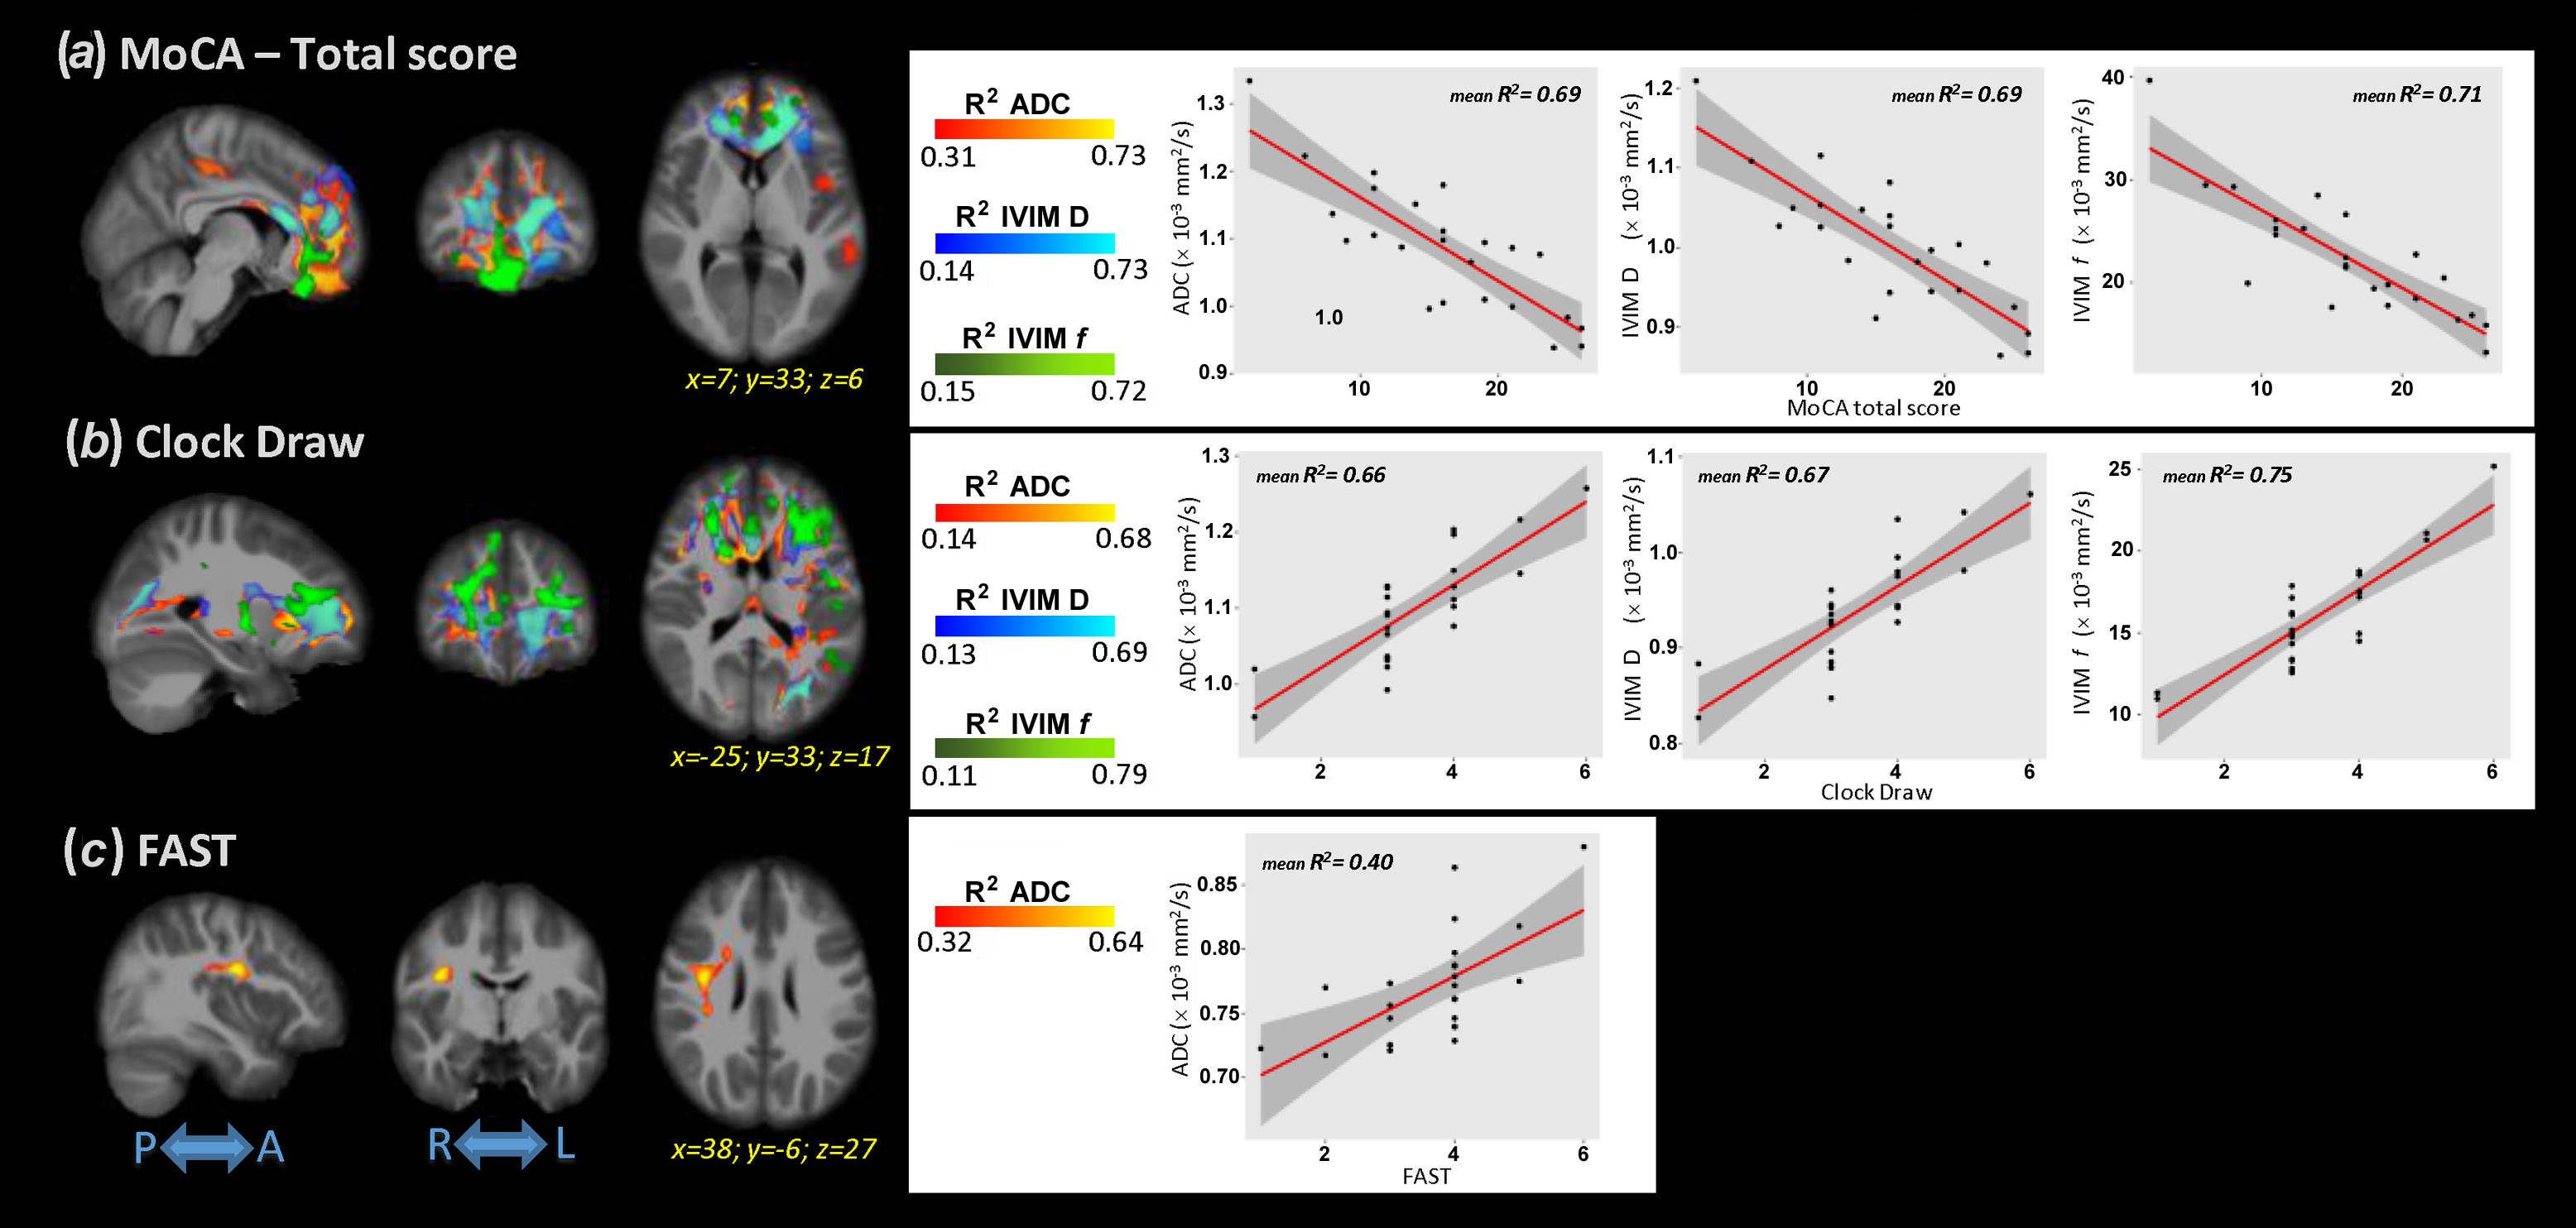
Significant differences were detected for the cognitive assessments across groups, as expected. Figure 1 shows the F-values for the significant differences between groups for all analysis methods (VBM, ADC, and IVIM). The subsequent post-hoc analysis, with Bonferroni correction for multiple comparisons, are shown in Figures 2-4 for AD vs. HC, AD vs. MCI, and MCI vs. HC, respectively. Widespread differences were observed between AD and HC, particularly for DWI metrics (Figure 2). More specifically, VBM values were reduced in the AD compared to the HC group in the medial temporal lobe, while DWI identified group differences in insula, parietal, frontal, and temporal lobes, thalamus, caudate, and cerebral WM and cerebral cortex. Comparisons between the AD and MCI groups (Figure 3) revealed differences in the frontal, occipital, parietal, and temporal lobes, right hippocampus, amygdala, and bilateral cerebral cortex using ADC and IVIM metrics. Although VBM identified significant clusters in the temporal lobe and cortex, as well as smaller clusters in the hippocampus and amygdala, these clusters were not observed after the family-wise error (FWE) correction. In addition, no significant clusters were observed between the MCI and HC groups using VBM (Figure 4). On the other hand, significant clusters were detected using ADC and IVIM-D maps in the thalamus, insula, left hippocampus, and amygdala. No significant differences were observed between MCI and HC using IVIM-f. Figure 5 shows the voxel-based correlations between the cognitive assessments and neuroimaging maps.DISCUSSION
IVIM-DWI metrics may improve sensitivity to sub-voxel microstructural and functional characteristics through the combination of perfusion-insensitive tissue diffusion coefficient and perfusion fraction. We found more significant regional changes using ADC and IVIM-DWI across patients with MCI and AD than standard assessment of GM atrophy with VBM. As expected, the differences were the greatest between AD and HC and occurred mainly in the temporal lobe, hippocampus, and amygdala, which are well-known regions involved in memory-related functions. More specifically, the significant clusters for ADC and IVIM-D covered ~70% of the temporal lobe and > 95% of the hippocampus and amygdala. The differences between MCI and HC were largely located in the thalamus, left amygdala, and left hippocampus using IVIM metrics, which may be consistent with recent evidence of early thalamic involvement in the MCI phase8. These results suggest that this method may provide complementary information to standard neuroimaging biomarkers, potentially leading to earlier biomarkers for these changes. Additionally, significant correlations between ACD/IVIM and several cognitive domains were observed, while no significant voxel-based correlations were found with VBM analysis.CONCLUSIONS
This study demonstrated the potential of IVIM-DWI for assessing AD-related neurodegenerative changes. IVIM-DWI provides complementary information regarding both diffusion and perfusion, which were found to correlate with cognitive decline. These results were compared to standard VBM analysis, which showed good agreement in the later stages of AD. IVIM-DWI may provide early biomarkers of AD, when intervention may prove most beneficial.Acknowledgements
This work was supported by the Arizona Alzheimer’s Consortium and the Barrow Neurological Foundation.References
1. Frisoni, G.B., Fox, N.C., Jack Jr. CR, et al. The clinical use of structural MRI in Alzheimer disease. Nat Rev Neurol 2010;6:67–77.
2. Ashburner, J., Friston, K.J. Voxel-based morphometry-the methods. Neuroimage 2000;11:805-821.
3. Le Bihan, D., Breton, E., Lallemand, et al. Separation of diffusion and perfusion in intravoxel incoherent motion MR imaging. Radiology 1988;168:497-505.
4. Petersen, R.C. 2004. Mild cognitive impairment as a diagnostic entity. J Intern Med 2004;256:183-194.
5. Nasreddine, Z.S., Phillips, N.A., Bedirian, V. et al. The Montreal Cognitive Assessment, MoCA: a brief screening tool for mild cognitive impairment. J Am Geriatr Soc 2005;53,:695-699.
6. Reisberg, B., Ferris, S.H., de Leon, M.J., et al. The Global Deterioration Scale for assessment of primary degenerative dementia. Am J Psychiatry 1982;139:1136-1139.
7. Winkler, A.M., Ridgway, G.R., Webster, et al. Permutation inference for the general linear model. Neuroimage 2014;92:381-397.
8. Aggleton, J.P., Pralus, A., Nelson, A.J., Hornberger, M., 2016. Thalamic pathology and memory loss in early Alzheimer's disease: moving the focus from the medial temporal lobe to Papez circuit. Brain 139, 1877-1890.
Figures