4538
Diffusion Tensor Imaging Detects Cross-Sectional and Longitudinal Brain Changes in Type 2 Diabetes Mellitus1University of California at Los Angeles, LOS ANGELES, CA, United States, 2UCLA School of Nursing, University of California at Los Angeles, Los Angeles, CA, United States, 3Anesthesiology, University of California at Los Angeles, Los Angeles, CA, United States, 4Medicine, University of California at Los Angeles, Los Angeles, CA, United States, 5Radiology, University of California at Los Angeles, Los Angeles, CA, United States, 6Bioengineering, University of California at Los Angeles, Los Angeles, CA, United States, 7Brain Research Institute, University of California at Los Angeles, Los Angeles, CA, United States
Synopsis
Patients with Type 2 diabetes mellitus (T2DM) show brain tissue changes in mood and cognitive control sites, functions that are deficient in the condition. However, the nature and extent of brain injury in T2DM, and their progression with time along with functional deficits are unclear. Using diffusion tensor imaging based MD procedures, we showed wide-spread chronic tissue changes in T2DM subjects and their continued progression after 6 months follow-up in areas involve in mood and cognitive regulatory functions. These findings may have resulted from underlying metabolic dysfunction associated with the condition.
Purpose
Type 2 diabetes mellitus (T2DM) patients show brain tissue changes in mood and cognitive control sites, functions that are commonly deficient in the condition.1-6 However, the nature and extent of brain injury in various brain sites, as well as progression of injury with time in T2DM subjects are unclear, which can be examined with diffusion tensor imaging (DTI)-based mean diffusivity (MD) measures. Mean diffusivity measures motion of water molecules within tissue and shows microstructural changes, with reduced values in acute and increased values in chronic pathological conditions. In the present study, our aim was to examine whether brain tissue changes are in acute or chronic condition in T2DM over control subjects, and whether those changes progress with time in T2DM subjects.Materials and methods
We examined 23 T2DM (age, 56.1±7.2 years; body-mass-index (BMI), 29.3±6.1 kg/m2; 13 female; HbA1C, 7.0±1.1 %; disease duration, 10.3±7.3 years), who were followed after 6 months, and 25 healthy control subjects (age, 54.3±7.3 years; BMI, 27.2±3.8 kg/m2; 13 female) using a 3.0-Tesla MRI (Magnetom Prisma; Siemens). Diffusion tensor imaging was performed using single-shot echo-planar imaging with twice-refocused spin-echo pulse sequence [repetition-time (TR) = 12,200 ms; echo-time (TE) = 87 ms; flip angle (FA) = 90°; band width = 1345 Hz/ pixel; matrix size = 128×128; FOV = 230×230 mm; slice thickness = 1.7 mm, no interslice-gap, diffusion values = 0 and 800 s/mm2; diffusion gradient directions = 30; separate series = 2). High-resolution T1-weighted image series were collected using the magnetization-prepared rapid acquisition gradient-echo pulse sequence [TR=2200 ms; TE=2.4 ms; inversion time=900 ms; flip angle=9°; matrix size=320×320; field-of-view=230×230 mm2; slice thickness=0.9 mm)]. Cognitive impairment and depressive and anxiety symptoms were evaluated using the Montreal cognitive assessment (MoCA), Beck Depression Inventory (BDI-II), and Beck Anxiety Inventory (BAI), respectively. The diffusion tensor matrices were calculated and diagonalized, and principal eigenvalues (λ1, λ2, and λ3) were quantified using the Diffusion toolkit software. Using the principal eigenvalues, MD values [(λ1+λ2+λ3)/3] were calculated at each voxel, with voxel intensities on the MD maps representing the corresponding MD values. We realigned and averaged MD maps computed from each DTI series, normalized to Montreal Neurological Institute (MNI) space, and smoothed with a Gaussian filter (8mm). High resolution T1-weighted images of a control subject were normalized to MNI space, and were used as background images for structural identification. The smoothed MD maps were compared voxel-by-voxel between the groups [T2DM at baseline vs controls, T2DM at 6 months follow-up vs controls] using ANCOVA (SPM12; covariate, age and sex; uncorrected threshold p < 0.005). Paired samples t-test (SPM12) was performed between T2DM at baseline and 6 months follow-up using the smoothed MD maps. The brain clusters with significant differences between groups were overlaid onto background images for structural identification. Cognitive and mood status were assessed between groups using independent samples t-tests and paired t-tests (SPSS v25).Results
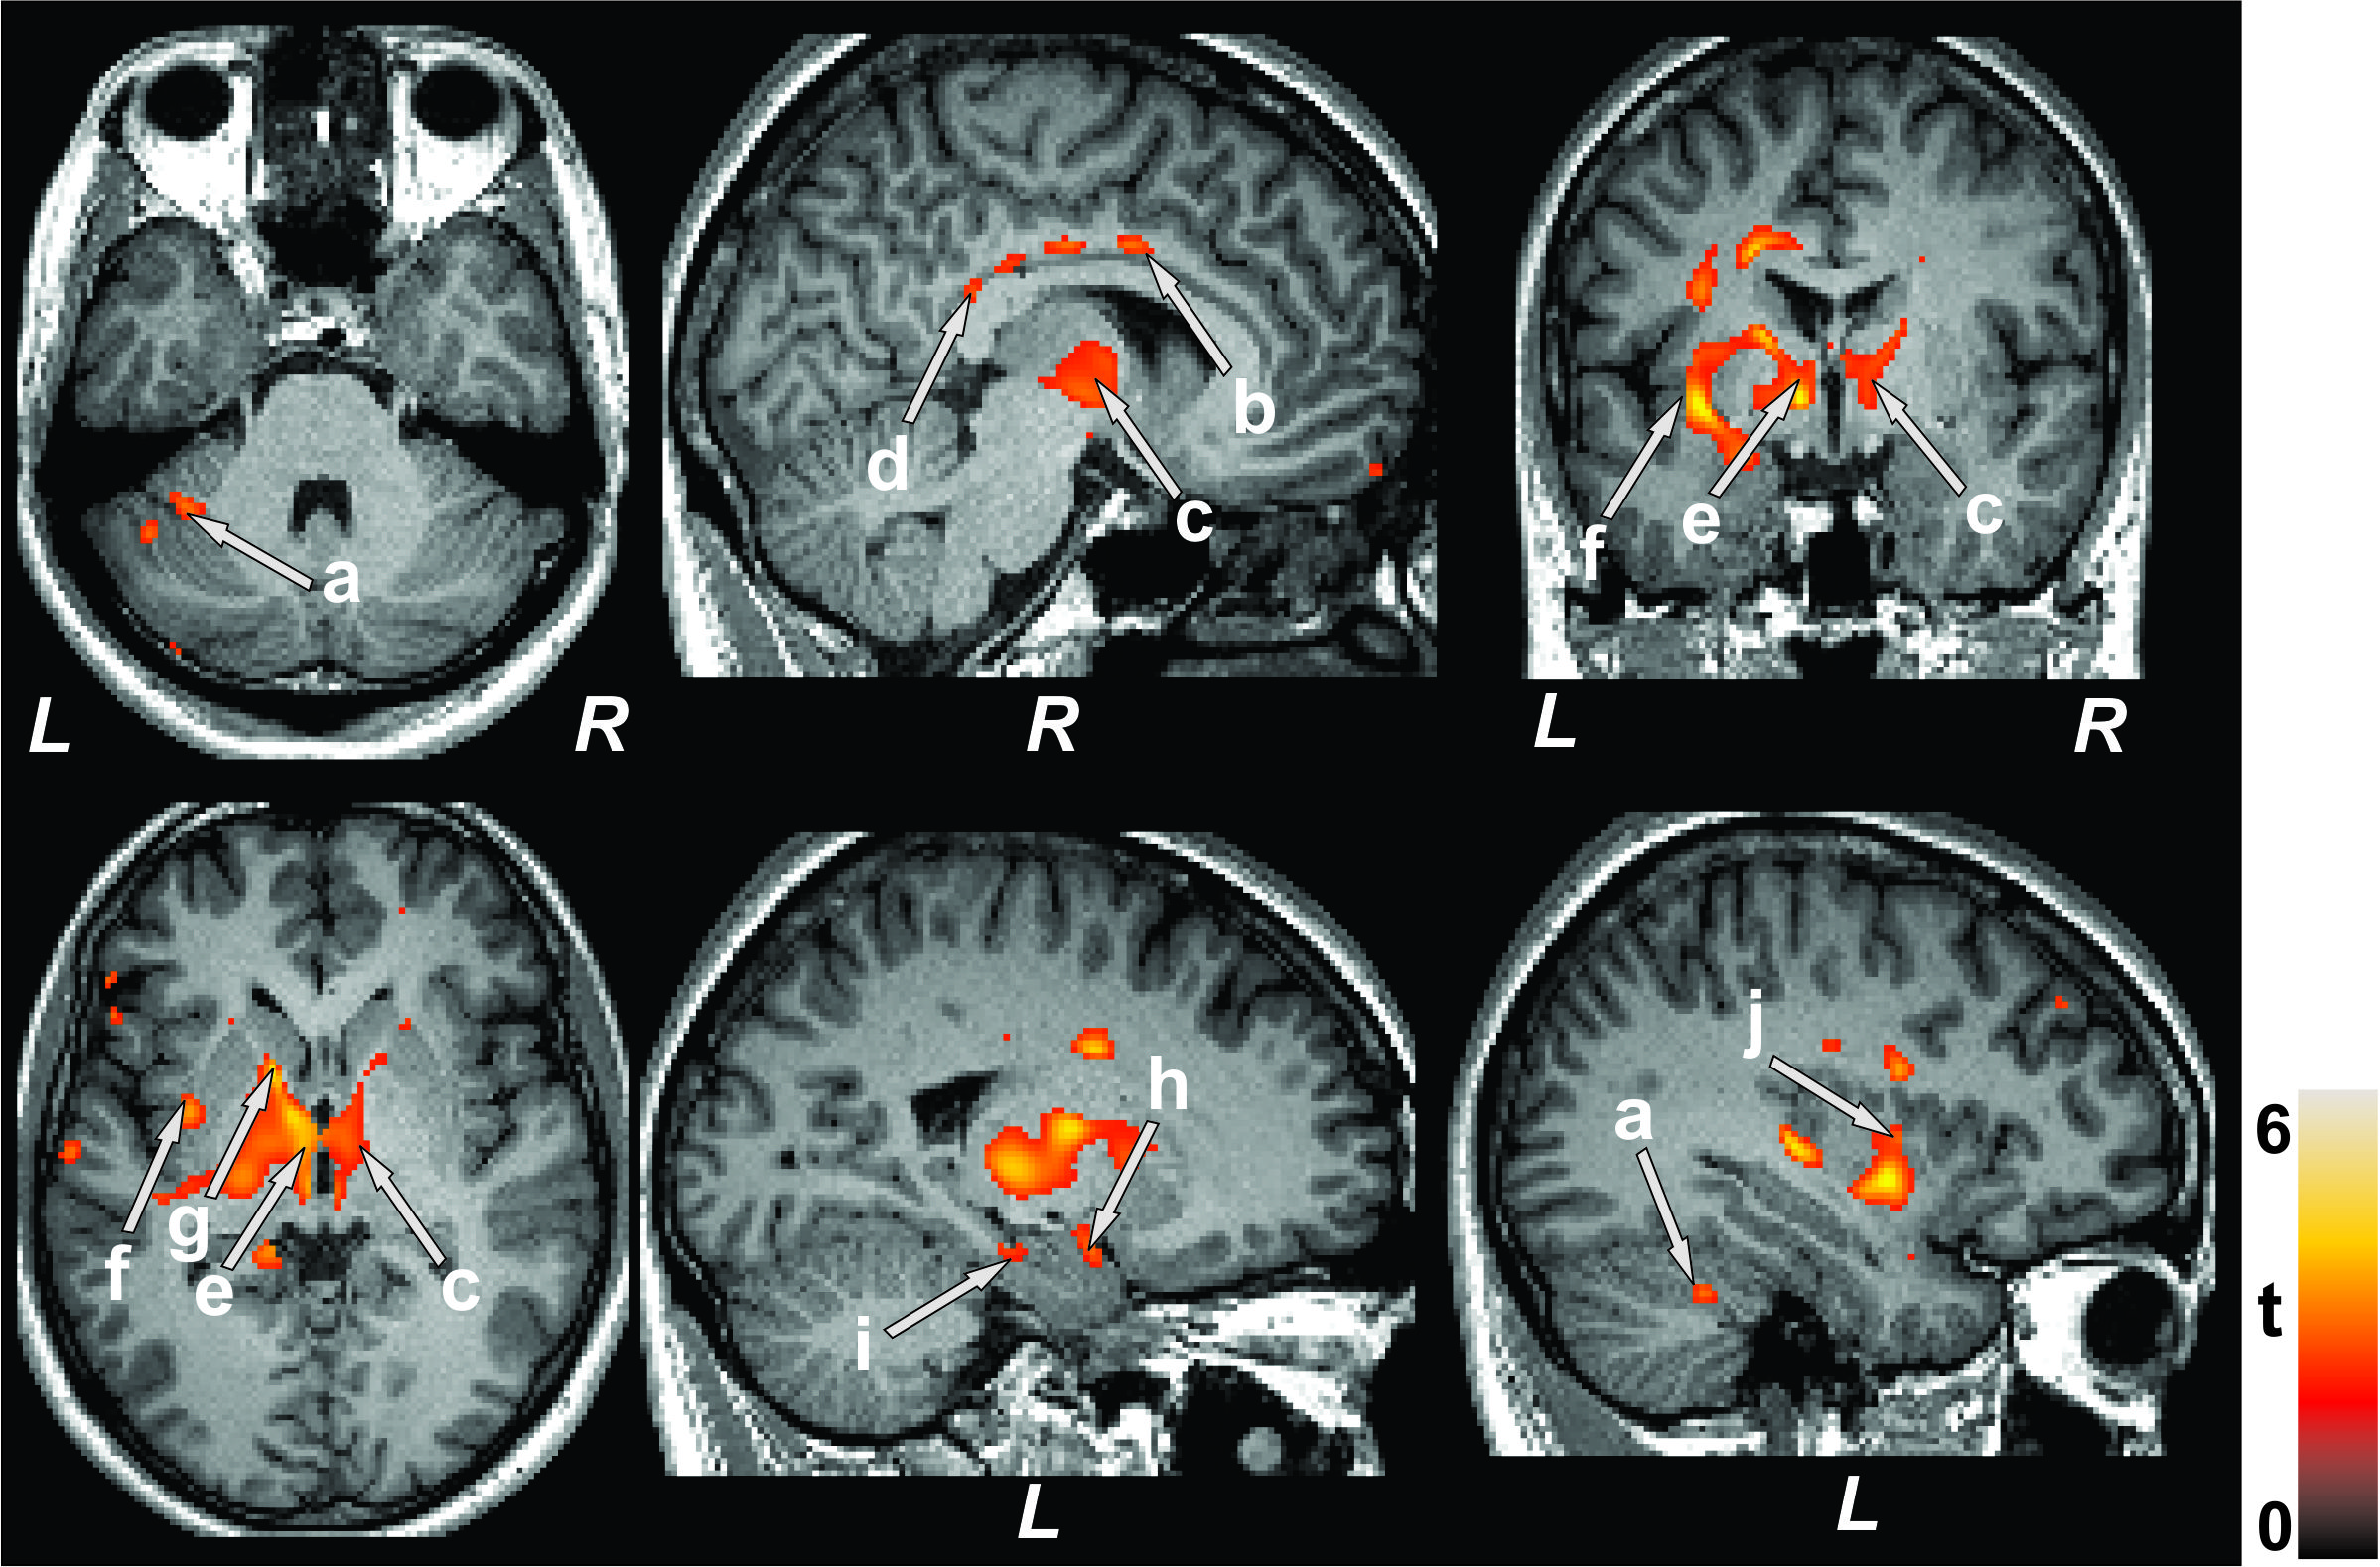
No significant differences in age, sex, and BMI emerged between T2DM and control subjects (age, p=0.42; sex, p=0.75; BMI, p=0.17). T2DM subjects had significantly higher BDI-II (p=0.004) and BAI (p=0.01), and low global MoCA scores (p=0.01) compared to controls. Multiple brain areas showed increased MD values in T2DM, indicating chronic tissue changes, compared to control subjects at baseline (Fig.1), including the anterior and posterior cingulate (a-c), basal forebrain, frontal (d) and prefrontal cortices (e), insular cortices (f), cerebellum (g), and vermis. After 6 months follow-up, MoCA, BDI-II, and BAI scores did not varied significantly from baseline in T2DM subjects. Regional brain MD values continued to be increased in 6 months follow-up in T2DM patients compared with controls (Fig. 1) at several selected brain sites, including the caudate (h), middle cingulate (i), hypothalamus (j), and hippocampus (k). The paired-t test comparison showed increased MD values at 6 months over baseline in T2DM patients (Fig 2) in the cerebellum (a), mid (b) and posterior (d) cingulate, thalamus (c, e), insular cortices (f, j), caudate (g), amygdala (h), and hippocampus (i).Discussion
T2DM patients showed significant brain damage in widespread areas that are involved in depression, anxiety, and cognition regulation. Cognitive and mood deficits emerged in T2DM patients at baseline over control subjects, and deficits were comparable at 6 months. However, several brain sites showed injury progression with time at 6 months. These findings indicate that brain injury is in chronic pathological stage and progressive, which may result from underlying metabolic dysfunction associated with the condition.Conclusion
T2DM patients have cognitive and mood dysfunctions and brain damage at regions regulating these functions. In addition, after 6 month follow-up the brain damage progresses with similar functional deficits in T2DM patients.Acknowledgements
This work was supported by National Institutes of Health R01 NR017190.References
1. Gavard JA, Lustman PJ, Clouse RE. Prevalence of depression in adults with diabetes. An epidemiological evaluation. Diabetes Care. 1993;16:1167-1178.
2. Watari K, Letamendi A, Elderkin-Thompson V, et al. Cognitive function in adults with type 2 diabetes and major depression. Arch Clin Neuropsychol. 2006;21:787-796.
3. Brain atrophy in type 2 diabetes: regional distribution and influence on cognition. Diabetes Care. 2013;36:4036-4042.
4. Zhang Y, Zhang X, Zhang J, et al. Gray matter volume abnormalities in type 2 diabetes mellitus with and without mild cognitive impairment. Neurosci Lett. 2014;562:1-6.
5. Gold SM, Dziobek I, Sweat V, et al. Hippocampal damage and memory impairments as possible early brain complications of type 2 diabetes. Diabetologia. 2010;53:2298-2306.
6. Yau PL, Javier DC, Ryan CM, et al. Preliminary evidence for brain complications in obese adolescents with type 2 diabetes mellitus. Diabetologia. 2011; 34:1060-1064.
Figures