4535
Clinical monitoring of axonal loss in multiple sclerosis using advanced diffusion MRI1Monash University, Prahran, Australia, 2University of Melbourne, Parkville, Australia
Synopsis
Brain atrophy is currently the accepted method for measuring neurodegeneration in multiple sclerosis (MS) but is insensitive over short times and ignores changes in cellular density. Recent advances in diffusion weighted imaging provide markers of axonal fibre density and atrophy. This study aimed to study the longitudinal sensitivity of these markers in comparison to brain atrophy based on data acquired in a standard clinical MS study. Annualised within-patient change in fibre density was around seven times more sensitive than brain volume change. This supports the development of fibre density based methods for clinical monitoring of axonal loss in MS.
Introduction
Axonal loss is a key driver of progressive neurological impairments in people with MS (pwMS) [1]. There is significant interest in the development of biomarkers for axonal loss to be used for patient monitoring and prognostication. Axonal fibre density, measured using diffusion MRI, is a putative in-vivo axonal biomarker for MS [2, 3], but is yet to be clinically translated. This study aimed to determine the sensitivity of longitudinal axonal fibre density measurements acquired as part of a standard radiological MRI protocol for detecting progressive axonal loss in pwMS.Methods
Between 2011 and 2014, 59 pwMS underwent 3T MRI (15 with 1 and 25 with 2 year follow-up) as part of their routine clinical monitoring. Expanded disability status scale (EDSS) and symbol digit modality test (SDMT) scores were obtained to measure neurological and cognitive progression respectively. Patients were imaged using 3D-FLAIR for measuring brain and lesion volumes using SPM12 and Lesion Segmentation Tool, and 30-direction diffusion weighted MRI (b-value=3000s/mm2) for measurement of axonal fibre density using the Fixel-Based Analysis pipeline in MRtrix 3.0 [2]. Briefly, fibre orientation distributions (FODs) were calculated using constrained spherical deconvolution [4]. FODs for all subjects were iteratively non-linearly co-registered to produce a study specific template. Each subjects FOD map was registered to the template and corrected fibre density was calculated as the FOD lobe amplitude (fibre density) multiplied by the jacobian determinant of the warp field perpendicular the FOD lobe (to account for macroscopic tract atrophy). Corrected fibre density was compared across subjects for each fixel in the template using general linear models corrected for age and sex. Fixel-wise general linear models (GLMs) tested for: 1) correlation at baseline with brain parenchymal fraction (BPF), lesion volume, EDSS and SDMT; and 2) change over time.Results
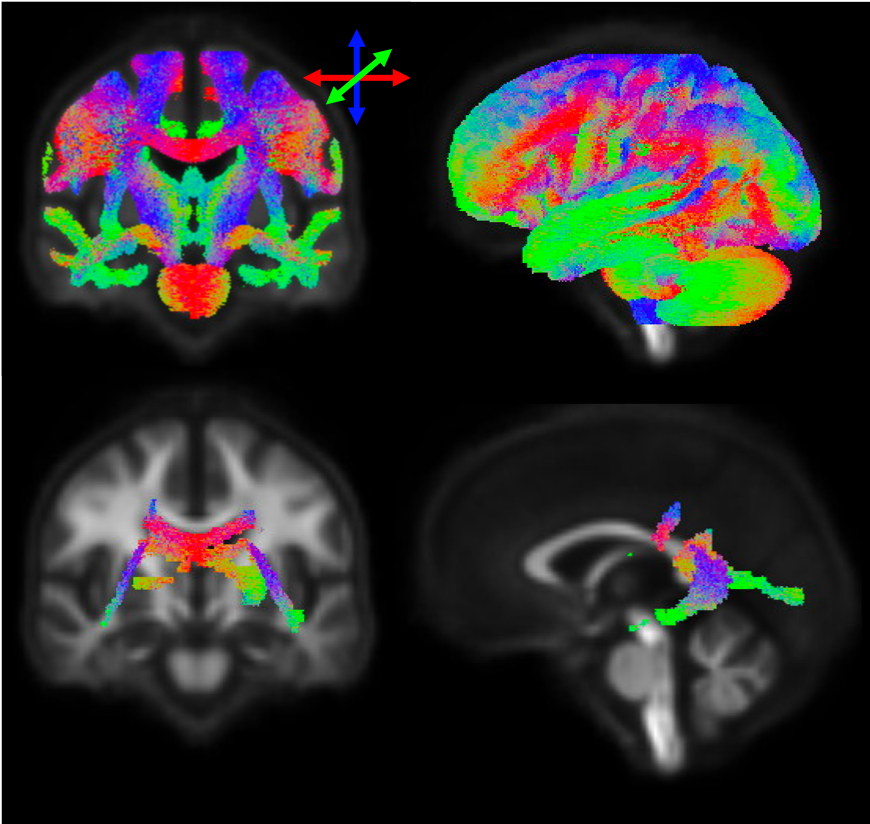
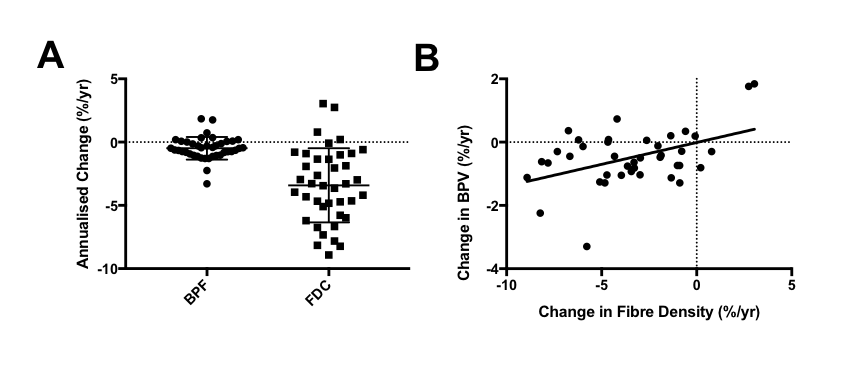
At baseline, lower BPF was associated with lower fibre density in posterior periventricular white matter (Figure 1). No baseline correlations were detected with lesion volume, EDSS or SDMT. Longitudinally, patients exhibited loss of axonal fibre density in the cortico-spinal tract, splenium of the corpus callosum and tapetum (Figure 2). The magnitude of change in this region was -3.41 (2.92) %/y compared to -0.48 (0.89) %/y change in BPF (Figure 3A). Loss of axonal fibre density significantly correlated with atrophy (R=0.45, p=0.003, Figure 3B). Baseline axonal fibre density correlated with subsequent SDMT worsening (R=0.49, p=0.002) but not with EDSS worsening. Neither baseline nor longitudinal change in BPF correlated with EDSS or SDMT progression.Discussion and Conclusion
This study shows that axonal fibre density can be measured from data collected within a standard radiological MS study and is nearly seven times more sensitive to structural brain change in pwMS than brain atrophy measurements.Future studies in larger samples across multiple sites are required to determine the reproducibility of fibre density in healthy subjects, and the degree of variability associated with differences in MRI sequences and scanners.
Acknowledgements
No acknowledgement found.References
1. Trapp, B.D., et al., Axonal Transection in the Lesions of Multiple Sclerosis. New England Journal of Medicine, 1998. 338(5): p. 278-285.2.
2. Raffelt, D., et al., Investigating white matter fibre density and morphology using fixel-based analysis. Neuroimage, 2017. 144, Part A: p. 58-73.3.
3. Gajamange, S., et al., Fibre-specific white matter changes in multiple sclerosis patients with optic neuritis.NeuroImage: Clinical, 2018. 17(Supplement C): p. 60-68.4.
4. Jeurissen, B., et al., Multi-tissue constrained spherical deconvolution for improved analysis of multi-shell diffusion MRI data. Neuroimage, 2014. 103: p. 411-426.
Figures