4534
Hemodialysis can contribute to acute changes in cerebral volume and white matter structure
Madeleine T Dacey1,2,3, Stefan E Poirier1,3, Janice Gomes2,4, Udunna C Anazodo1,3, and Christopher W McIntyre1,2
1Medical Biophysics, Western University, London, ON, Canada, 2Kidney Clinical Research Unit, Lawson Health Sciences Center, London, ON, Canada, 3Imaging, Lawson Health Research Insitute, London, ON, Canada, 4Pathology and Laboratory Medicine, Western University, London, ON, Canada
1Medical Biophysics, Western University, London, ON, Canada, 2Kidney Clinical Research Unit, Lawson Health Sciences Center, London, ON, Canada, 3Imaging, Lawson Health Research Insitute, London, ON, Canada, 4Pathology and Laboratory Medicine, Western University, London, ON, Canada
Synopsis
Cognitive impairment and white matter degeneration are common in hemodialysis patients. Hemodialysis can severely impede blood flow and create osmotic imbalances in the brain. This may cause brain injury by a mechanism similar to that of stroke. To investigate the acute effects of hemodialysis on the brain, we used a novel system to perform diffusion and T1 weighted MRI scans during hemodialysis. Several tracts exhibit diffusion tensor imaging markers for cytotoxic and ionic edema. Increased white and grey matter volume during hemodialysis further support the presence of ionic edema. Ionic and cytotoxic edema are evidence of acute brain injury.
Introduction
Cognitive impairment affects 30-70% of hemodialysis (HD) patients and leukoaraiosis (white matter degeneration) is almost universal.1,2 Previous work has found that during HD, cerebral ischemia can be severe, even comparable to stroke. Ischemia-reperfusion injury in stroke causes cytotoxic (intracellular) edema, which may in turn cause ionic (extracellular) edema. It has also been established that HD can create an osmotic gradient from the plasma to brain tissue when osmoles (namely urea) are dialyzed more rapidly than they can cross the blood-brain barrier, compounding neuronal swelling. To investigate the acute effects of HD on the brain and their role in these neurological abnormalities, we used a novel system to perform magnetic resonance imaging (MRI) during HD for the first time. Diffusion tensor imaging (DTI) is an MRI modality used to characterise white matter (WM) structure using scalar metrics. Axial and radial diffusivity (AD and RD) quantify the amount of diffusion in the primary and secondary diffusion directions, respectively. Fractional anisotropy (FA) describes the degree of directionality and mean diffusivity (MD) measures the average amount of diffusion. Cytotoxic edema is associated with a specific pattern of diffusion changes: increased FA & AD and decreased MD & RD.5 A combination of cytotoxic and ionic edema manifests as increased MD and cerebral swelling.3 We hypothesize that ischemia and osmotic imbalances during HD cause acute brain injury, which manifests as cytotoxic and ionic edema.Methods
CKD patients (N=16) receiving HD 3 times/week underwent diffusion (2D EPI, 2.0 mm isotropic resolution, FoV=192 mm, TR=9800 ms, TE=102 ms, 64 diffusion encoding directions, b-values = 0 and 1000 s/mm2) and T1 weighted (MPRAGE, 1.0 mm isotropic resolution, FoV=256 mm, TR=2000 ms, TE=2.98 ms, TI=900 ms, flip angle=9 degrees) MRI scans (Siemens 3T Biograph mMR) prior to and within the last 60 minutes of HD, at peak circulatory stress. The MRI data were denoised using an optimized non-local means filter (Pierrick Coupe) and processed to correct for bias field, Gibb's ringing, eddy current, and motion artifacts (ANTs, MRtrix3, FSL).6,7,8 Tensor fitting was performed using a non-linear least squares method (ExploreDTI).9 Scalar maps were compared pairwise using tract-based spatial statistics (TBSS) and a general linear model with threshold-free contrast enhancement.10,11 Since FA is the most sensitive indicator of cytoxic edema, mean scalar values within functional regions of interest (fROIs) where FA increased were calculated. WM, grey matter (GM), and cerebrospinal fluid (CSF) volumes were extracted from T1 weighted images in CAT12.12 fROI means and tissue volumes were compared pairwise using Wilcoxon signed-rank tests.Results
Through TBSS analysis, we found FA, AD, MD, and RD were all significantly (P<0.05) elevated at peak stress during HD in a variety of white matter tracts with some overlap, as shown in figure 1.Within fROIs where FA increased significantly (P<0.05) on the tract-based level, mean RD and MD decreased. WM and GM volumes increased significantly, while CSF volume decreased (P<0.05), as shown in figure 2.
Discussion
TBSS results of increased AD and FA are consistent with previous DTI results from the acute phase following ischemic stroke and indicate the presence of cytotoxic edema during HD. The decrease in MD and RD in these regions further support the presence of cytotoxic edema. The increased MD in anterior regions may reflect ionic edema. Increased white and grey matter volume are evidence of the brain swelling, which also denotes ionic edema.12Conclusion
Novel intra-dialytic MRI results indicate the presence of cytotoxic and ionic edema, key markers of acute ischemic brain injury.2,3 These results may explain the decline in neurological health previously observed in HD patients. 1-year follow-up scans and cognitive testing will be acquired to assess the long term effects of HD in this cohort, determine if they correspond to these acute changes, and assess their clinical significance. We are also investigating the efficacy of remote ischemic preconditioning (RIPC), a therapy which has been shown to protect vital organs from ischemia-reperfusion injury.Acknowledgements
I would like to thank the Heart and Stroke foundation for funding this research. Jarrin Penny, Justin Dorie, Tanya Tamasi, Heather Biernaski, and John Butler filled essential roles, conducting this work as research nurses, coordinators and technical support. Finally, I would like to thank our patients for persevering through our long protocol.References
- San A, Hiremagalur B, Muircroft W, Grealish L. Screening of Cognitive Impairment in the Dialysis Population. Dement Geriatr Cogn Disord 2017;44:182-195.
- McIntyre, Christopher W. et al. Ischemic brain injury in hemodialysis patients. Kidney Int., 2015;15: 1109-1115.
- Stokum J.A., Gerzanich V., Simard J.M. Molecular pathophysiology of cerebral edema. J Cereb Blood Flow Metab. 2016;36(3):513–538.
- Mistry, K. Dialysis disequilbrium syndrome treatment and management. Int J Nephrol Renovasc Dis. 2019;12: 69-77.
- Sotak, C. H. et al.
The role of diffusion tensor imaging in the evaluation of ischemic brain injury - a review. NMR Biomed., 2002;15: 561-569. (DTI ischemia)
- Pierrick Coupé, et al. An optimized blockwise nonlocal means denoising filter for 3-D magnetic resonance images. IEEE Transaction on Med. Imaging, 2008; 27 (4), pp.425-41. (denoising)
- Tustison, N., et al. N4ITK: Improved N3 Bias Correction IEEE Transactions on Medical Imaging, 2010; 29, 1310-1320 (bias field corr in ants)
- Andersson, J. L. & Sotiropoulos, S. N. An integrated approach to correction for off-resonance effects and subject movement in diffusion MR imaging. NeuroImage, 2015;125, 1063-1078 (MRtrix3
- Smith, S.M. et al. Tract-based spatial statistics: voxelwise analysis of multi-subject diffusion data. NeuroImage, 2006;31: 1487-1505. (TBSS)
- Winkler, A.M., et al. Permutation inference for the general linear model. NeuroImage, 2014;92:381-397. (randomise)
- Leemans, A., et al. ExploreDTI: A graphical toolbox for processing, analyzing, and visualizing diffusion MR data. Proceedings of the 17th Scientific Meeting, Int. Soc. for MR in Medicine, Honolulu, USA, p. 3537, 2009. (tensor fitting)
- Ashburner, J., Friston, K.J. Unified segmentation. Neuroimage, 2005; 26(3):839-51. (cat12 segment)
Figures
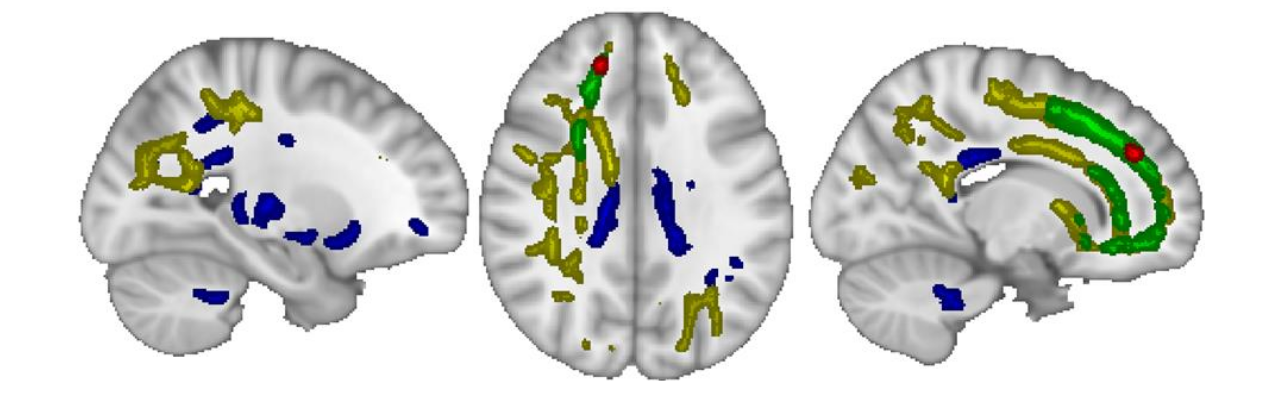
The colored regions show where each diffusion metric increased significantly (P<0.05) at peak stress during hemodialysis. The blue and yellow regions correspond to fractional anisotropy and axial diffusivity, respectively, and indicate cytotoxic edema. The green and red regions correspond to mean diffusivity. Radial diffusivity is shown in red.

White and grey matter volume increase significantly at peak stress during hemodialysis while cerebrospinal fluid volume decreases (p<0.05). These changes are consistent with brain swelling and indicate ionic edema.