4533
Can mapping cortical diffusivity provide unique microstructural insight into aging?1Rotman Research Institute, Baycrest Health Sciences, Toronto, ON, Canada, 2Department of Medical Biophysics, University of Toronto, Toronto, ON, Canada, 3MGH/HST Athinoula A. Martinos Center for Biomedical Imaging, Massachusetts General Hospital, Harvard Medical School, Charlestown, MA, United States, 4Neuroimaging Research for Veterans Center, VA Boston Healthcare System, Boston, MA, United States
Synopsis
The aging process in the cerebral cortex is typically measured in-vivo via MRI-based cortical thickness. Here we show that mean diffusivity (MD), a parameter derived from diffusion MRI, serves as a more sensitive measure of aging than thickness across the cortex. MD shows distinct age-related differences than thickness, suggesting that MD can provide insight into microscopic degeneration that cannot be detected with macroscopic structural MRI measures. While diffusion MRI microstructural analyses are typically limited to the white matter, this work suggests that additionally assessing age-related differences in cortical gray matter diffusivity can offer potentially valuable information on early cortical degeneration.
Introduction
It is well-known that the cerebral cortex degenerates with normal adult aging.1 This process can be measured in-vivo using MRI via cortical thickness (CT) measurements (which is generally considered a more sensitive measure to age than cortical surface area measurements).2 However, such macroscopic measurements cannot provide a complete view of cortical degeneration because early microstructural cellular and subcellular breakdown does not necessarily lead to an immediate loss of thickness.3-4 A potential marker for capturing these early microstructural processes is mean diffusivity (MD), derived from diffusion MRI, which preliminary studies suggest is positively associated with age in the cortex.5-6 Therefore, here we assess the strength and spatial distribution of age-related differences in MD across the cerebral cortex in a large sample of UK Biobank participants. Since increased (macroscopic) partial voluming with cerebrospinal fluid (CSF) with age is expected due to a reduction in CT, we compare our results with age-related differences in MRI-derived CT to test the hypothesis that MD captures distinct microstructural information.Methods
Study ParticipantsAll subjects were participants of the UK Biobank. Subjects were excluded from our study if they reported a neurological, psychological or psychiatric disorder, neurological injury, or history of stroke. Subjects were divided into seven age categories [46-50, 51-55, 56-60, 61-65, 66-70, 71-75, 76-80] years and 100 subjects were randomly selected from each of the seven age categories. Data from 52 of the subjects were deemed unusable by the UK Biobank, and 11 additional data were deemed unusable by our own quality control. The final sample thus consisted of 637 subjects aged 46-80 (54% male, 46% female) .
Diffusion MRI Data
Information about dMRI data and processing can be found at biobank.ctsu.ox.ac.uk/crystal/crystal/docs/brain_mri.pdf. In brief, dMRI data were acquired on a Siemens Skyra 3T system with 5x b=0, 50x b=1000, 50x b=2000 mm2/s, and corrected for distortions via TOPUP.7 Cortical reconstruction was performed and cortical thickness (CT) was calculated using FreeSurfer.8 Mean diffusivity (MD) maps were projected onto cortical surfaces via FreeSurfer’s mri_vol2surf (projfrac=0.5) and registered to a standard (fsaverage) surface.
Data Analysis
Age-related difference per year of MD and CT was calculated as the regression coefficient from a general linear model as implemented in FreeSurfer's mri_glmfit. The effect is displayed on the cortical surface if significant at p<0.05 following correction for multiple comparisons (cluster-wise correction via FreeSurfer’s mri_glmfit-sim). Cerebral lobes were also segmented via FreeSurfer.
Results
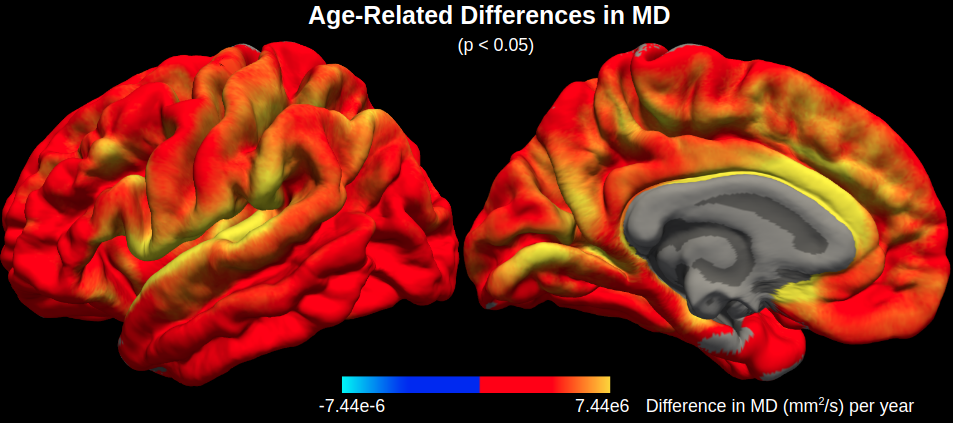
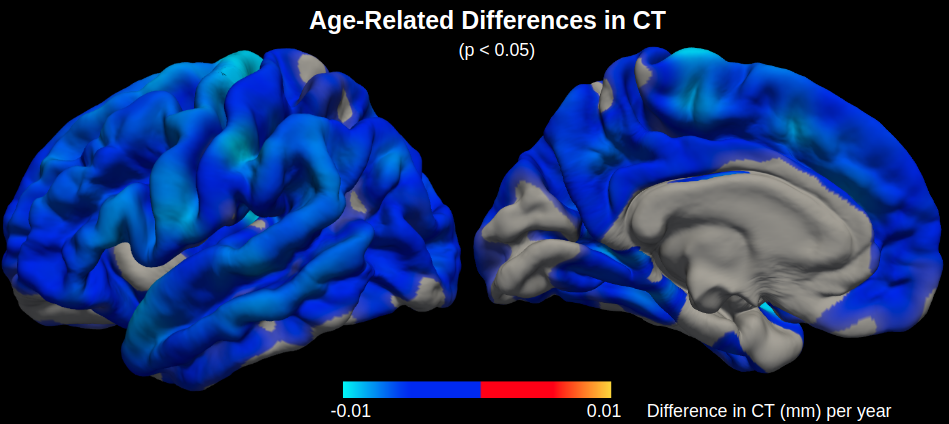
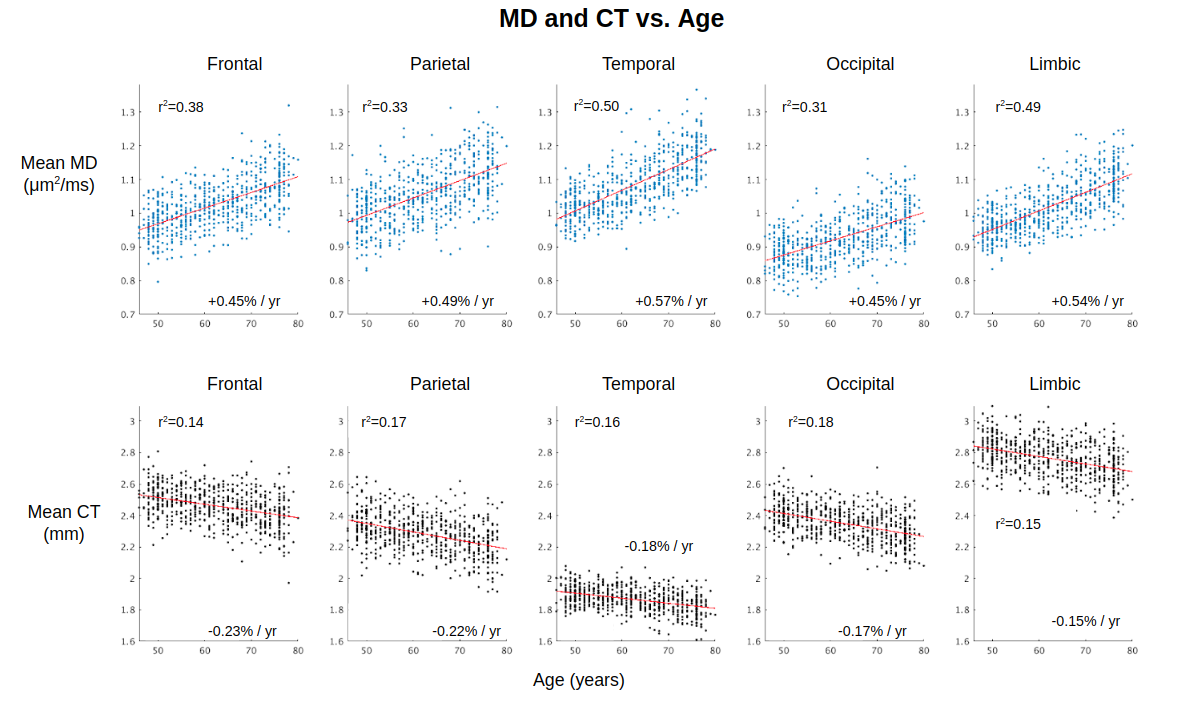
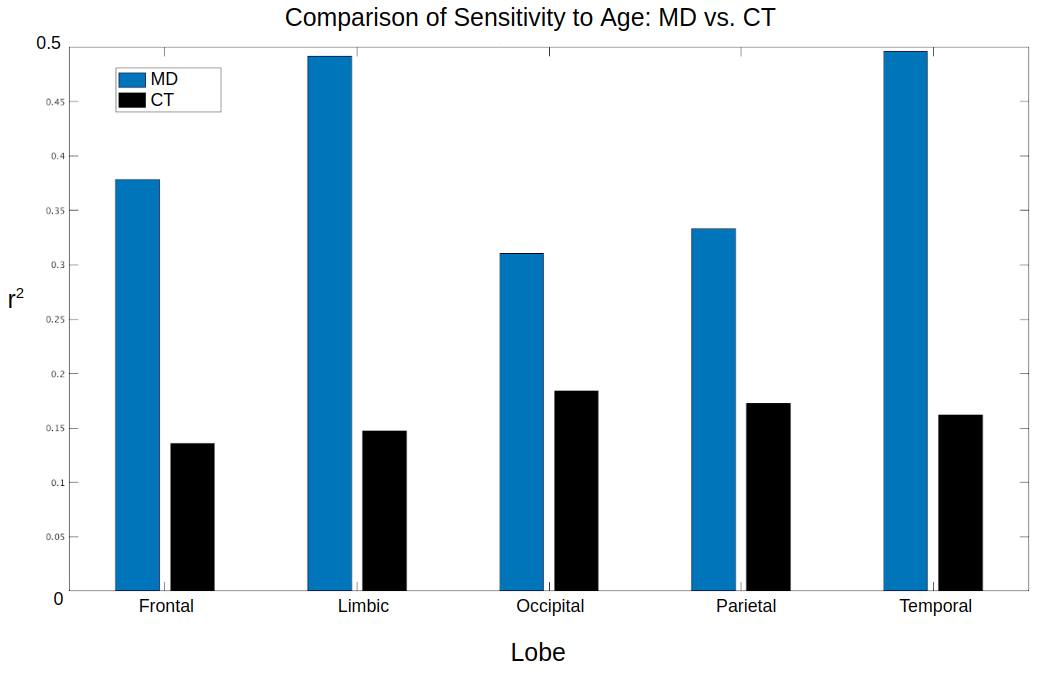
Maps of age-related difference in mean diffusivity (MD) and cortical thickness (CT) are displayed in Figures 1 and 2, respectively. Both effects are widespread across the cortex, although the effects of each metric peak different spatially. Cortical thinning is particularly pronounced in the motor cortex, whereas increased diffusivity with age is particularly pronounced in the cingular, insular and superior temporal cortices.Across the cortex, MD is more sensitive to age than CT in all five lobes (Figures 3 and 4). MD is most sensitive to age in the temporal (r2=0.50) and limbic (r2=0.49) cortices (the corresponding r2 values for CT are r2=0.16 and r2=0.15, respectively).
Discussion
This study is among the first to investigate the spatial distribution of age-related differences in mean diffusivity (MD) across the cortex, extending our previous preliminary study on a larger sample.6 Here we demonstrated that MD can serve as a more sensitive measure of aging in the cerebral cortex than cortical thickness (CT). Given that the spatial peaks of age-related differences in MD are distinct from CT, mapping cortical diffusivity ostensibly allows detection of increased microscopic diffusion with age, presumably reflecting early cellular breakdown, which traditional macroscopic MRI measures cannot detect. Future work will further test this hypothesis by comparing age-related differences in MD in the cortex with age-related differences in MD in the corresponding cortical white matter, which is less susceptible to partial voluming with CSF.Conclusion
This work suggests that, rather than discarding diffusion MRI data following white matter analysis, it is beneficial re-examine such data by utilizing the information acquired in the gray matter. MD holds promise for serving as a sensitive measure of early cortical aging in future diffusion MRI studies.Acknowledgements
This research has been conducted using the UK Biobank Resource under Application Number 40922. We thank CIHR, NSERC and NIH for financial support.
References
1. Peters R (2006) Ageing and the brain. Postgrad MEd J 82(964):84-88.
2. Lemaitre H et al (2012) Normal age-related brain morphometric changes: nonuniformity across cortical thickness, surface area and gray matter volume? Neurobiol Aging 33(3):617e1–9.
3. DiLoreto R & Murphy CT (2015) The cell biology of aging. Mol Biol Cell 26: 4524–4531.
4. Brites D (2015) Cell ageing: a flourishing field for neurodegenerative diseases. AIMS Mol Sc. 2:225–258.
5. Salminen LE et al (2016) Regional age differences in gray matter diffusivity among healthy older adults. Brain Imaging Behav 10:203–211.
6. Chad JA et al (2018) Age-effects on cortical tissue diffusivity. ISMRM 2018:3096.
7. Andersson JLR et al (2003) How to correct susceptibility distortions in spin-echo echo-planar images: application to diffusion tensor imaging. Neuroimage 20(2):870-888.
8. Fischl B (2012) FreeSurfer. Neuroimage 62(2):774-781.
Figures