4532
High-resolution Distortion-free DWI of Pituitary Adenomas and Rathke Cleft Cysts Using Point-spread-function Encoded EPI1Center for Biomedical Imaging Research, Department of Biomedical Engineering, School of Medicine, Tsinghua University, Beijing, China, 2Department of Radiology, the First Hospital of Jilin University, Changchun, China, 3Department of Neurosurgery, the First Hospital of Jilin University, Changchun, China, 4Philips Healthcare, Beijing, China
Synopsis
Differentiation between pituitary adenomas (PAs) and Rathke cleft cysts (RCCs) is important for treatment planning. Diffusion weighted imaging (DWI) has been reported for the differentiation. However, traditional single-shot echo planar imaging (EPI) DWI has limited resolution and suffers from image distortion near the skull base. High-resolution distortion-free DWI should be more suitable. We apply a recently developed fast point-spread-function encoded EPI on pituitary imaging. It generates high-resolution distortion-free DWI, in which the signals of the microadenoma and the RCCs are hyperintense and hypointense, respectively. This study shows the potential of this technique to distinguish between PAs and RCCs.
Introduction
Pituitary adenomas (PAs) and Rathke cleft cysts (RCCs) are two kinds of most common abnormalities that arise in the pituitary gland1. They require different surgical treatments 2-4. Therefore, preoperative differentiation between them is important for treatment planning5.In clinical examinations, T1 weighted (T1W), T2 weighted (T2W), and postcontrast images are routinely used for the diagnosis. However, both PAs and RCCs could show various intensity on T1W and T2W images. It’s difficult to distinguish between them even with contrast agent administration5,6, which may bring discomfort to patients.
Diffusion weighted imaging (DWI) can suppress the signal of fluid-filled cysts and has been used for differentiation between PAs and RCCs 7. Traditional single-shot echo planar imaging (SS-EPI) DWI suffers from severe susceptibility artifacts near the skull base and thus has limited applicability in pituitary imaging. In addition, the small size of microadenomas, less than 1 cm 6, is also a challenging factor for SS-EPI DWI. Previous results have shown applications of distortion-reduced or distortion-free DWI 7-11, but they are limited to low-resolution or small field of view (FOV) imaging.
Point-spread-function encoded EPI (PSF-EPI) can acquire high-resolution DWI without geometric distortion12-19. This technique applies an additional phase encoding gradient before the SS-EPI readout and acquires a 3D k-space in a multi-shot manner, by which it can record the B0 inhomogeneity and reconstruct distortion-free images. Its acquisition efficiency was improved to be practical enough by undersampling along the phase encoding (ky) and the PSF encoding (ks) directions and employing tilted-CAIPI19. This project investigates the ability of PSF-EPI to generate high-resolution distortion-free DWI of pituitary lesions and compares the features of PAs and RCCs in DWI.
Methods
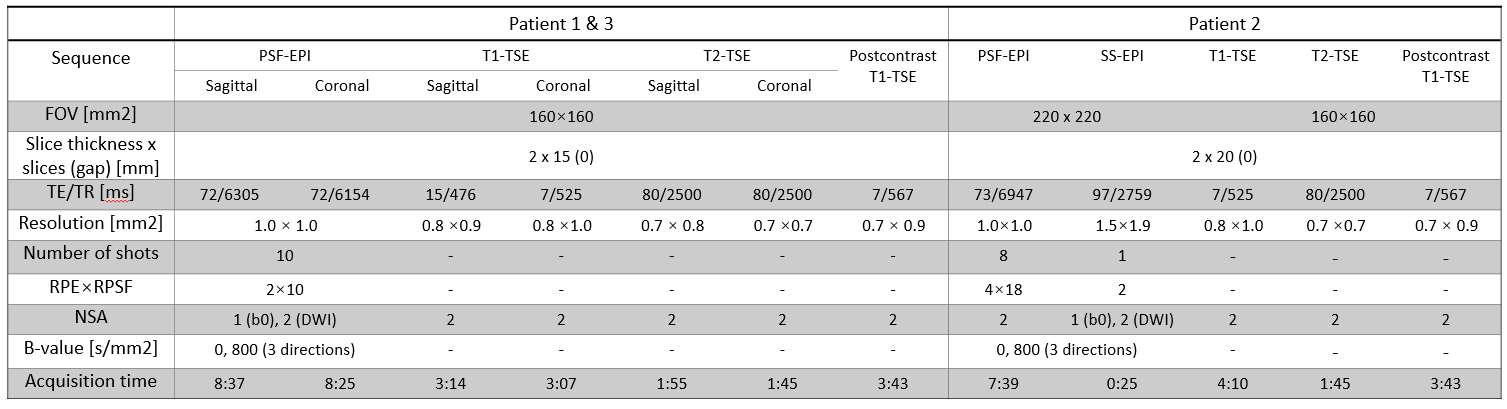
Three patients (1 male, 2 female) with pituitary lesions underwent MR imaging followed by surgery. The diagnosis was made by a radiologist via MR images and confirmed by a neurosurgeon during surgery.In PSF-EPI, to achieve the tilted-CAIPI kernel, RPE×RPSF = 4×18 and RPE×RPSF = 2×10 were used. 30 extra ky lines were acquired for self-navigated inter-shot phase correction. For patients 1 and 3, an FOV of 160×160 mm2 and 10 shots (RPE×RPSF = 2×10) were used. For patient 2, DW images with an FOV of 220×220 mm2 and 8 shots (RPE×RPSF = 4×18) were acquired and cropped to match with the anatomical images. The other DWI parameters were: resolution = 1×1×2 mm3 and b-value = 800 s/mm2 with three orthogonal directions.
SS-EPI was acquired in patient 2. T2W turbo spin echo (T2-TSE) and T1W turbo spin echo (T1-TSE) were acquired for all patients. In patients 2 and 3, T1-TSE images after contrast agent administration were also acquired. All acquisition parameters are listed in Table 1. All images were acquired on a 3.0T Phillips Achieva TX scanner (Philips Healthcare, Best, The Netherlands), using a 16-channel head coil.
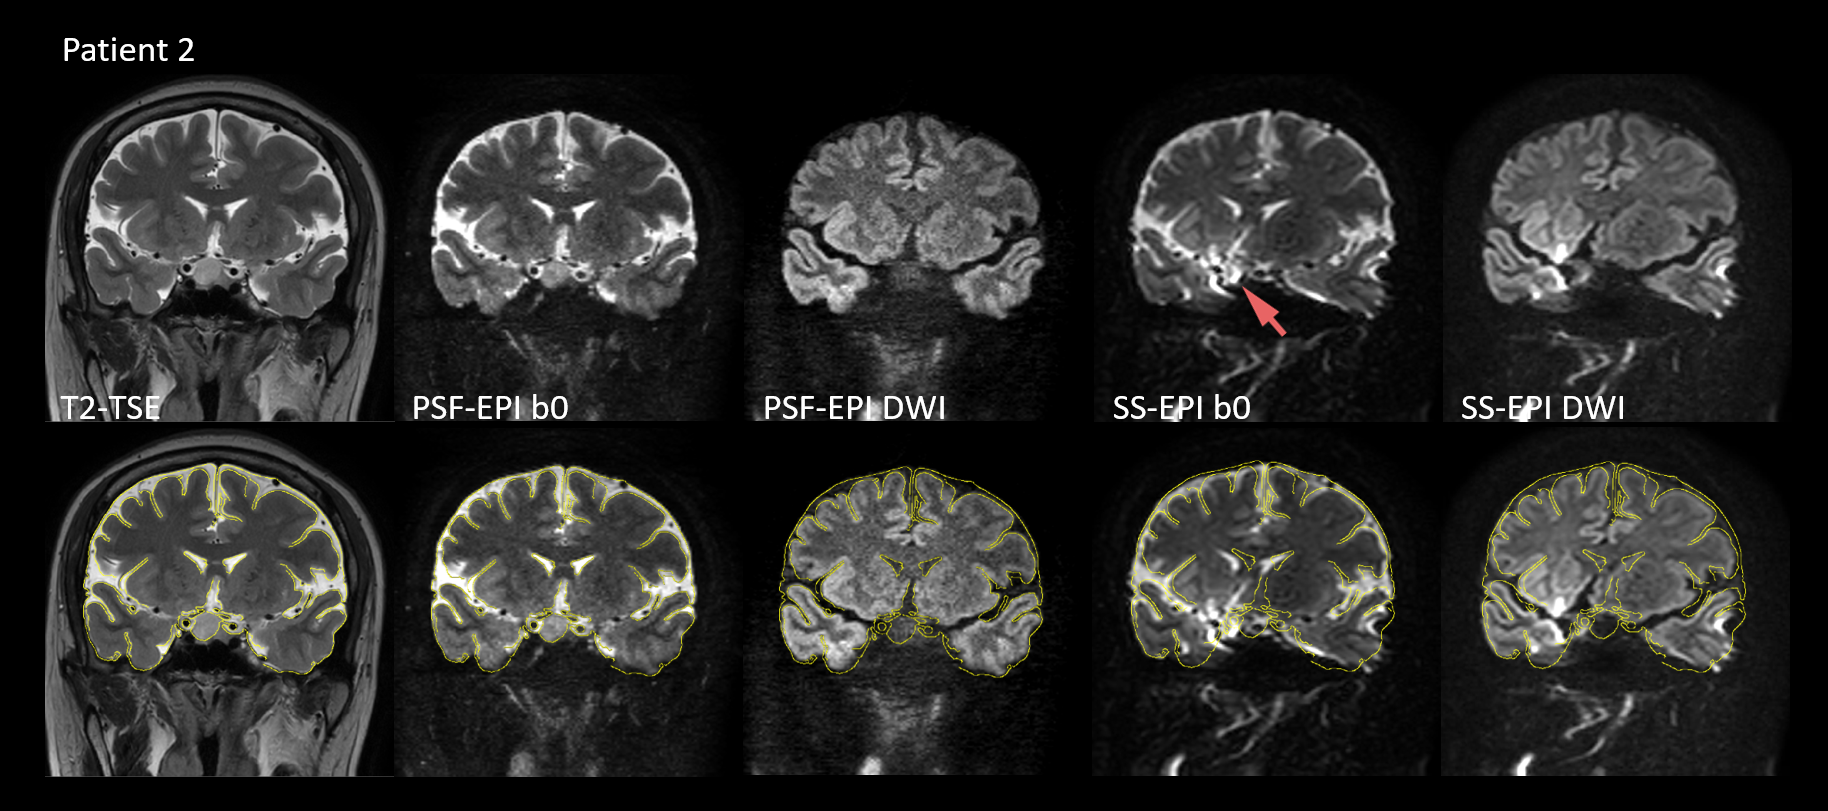
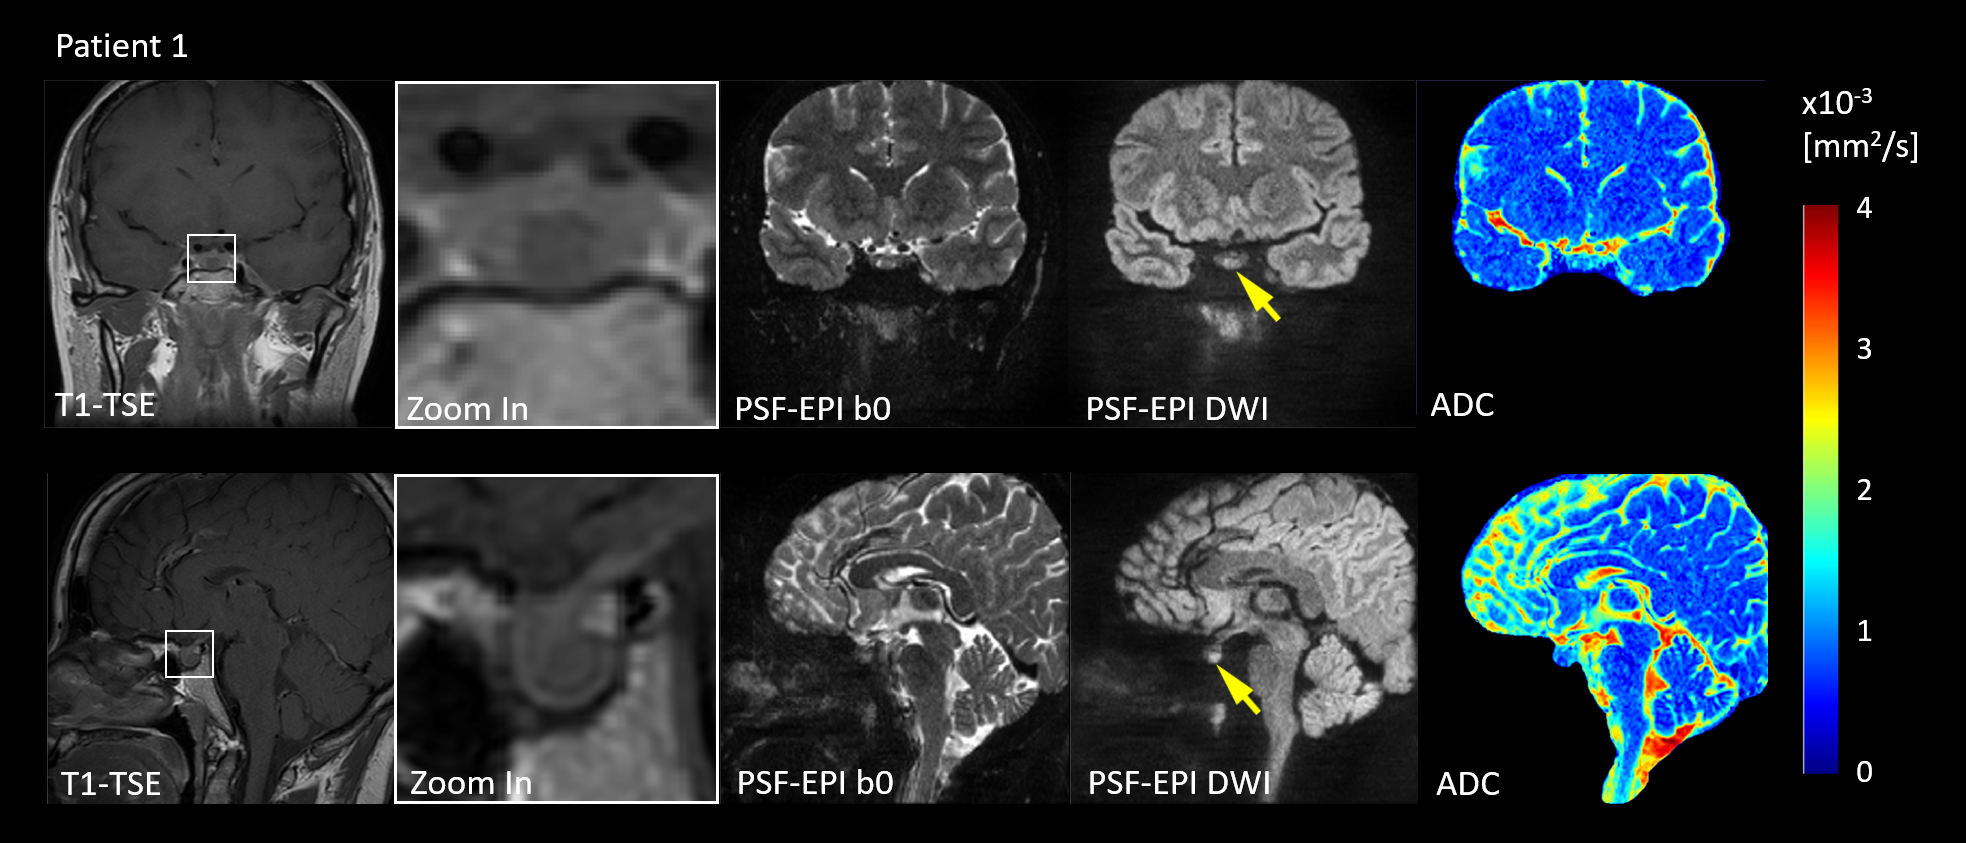
In order to validate PSF-EPI in terms of geometric distortion, we used the T2-TSE image as a distortion-free reference. The edges of the brain and the pituitary gland were extracted from the T2-TSE images and superimposed to the PSF-EPI images. Apparent diffusion coefficient (ADC) maps were calculated. A comparison between different lesions on DWIs was made qualitatively.
The maximum diameters of lesions were measured. In the precontrast and postcontrast T1-TSE, regions of interest (ROIs) were placed to measure the levels of enhancement. Although the positions of patients and the preparation pulses of sequences were not perfectly matched before and after contrast agent administration, these results could help to illustrate the enhancement.
Results & Discussion
From Fig. 1 it can be observed that PSE-EPI preserves high structural consistency with T2-TSE, while severe distortion exists in SS-EPI, which may prevent accurate quantitative analysis of the lesions. Patient 1 was diagnosed with a microadenoma with a size of 8.3 mm, which was confirmed by the surgical findings.Fig. 2 shows that the microadenoma can be detected by PSF-EPI. The lesion shows high intensity in DWIs and leads to lower ADC values, which agrees with the published results 8,9.
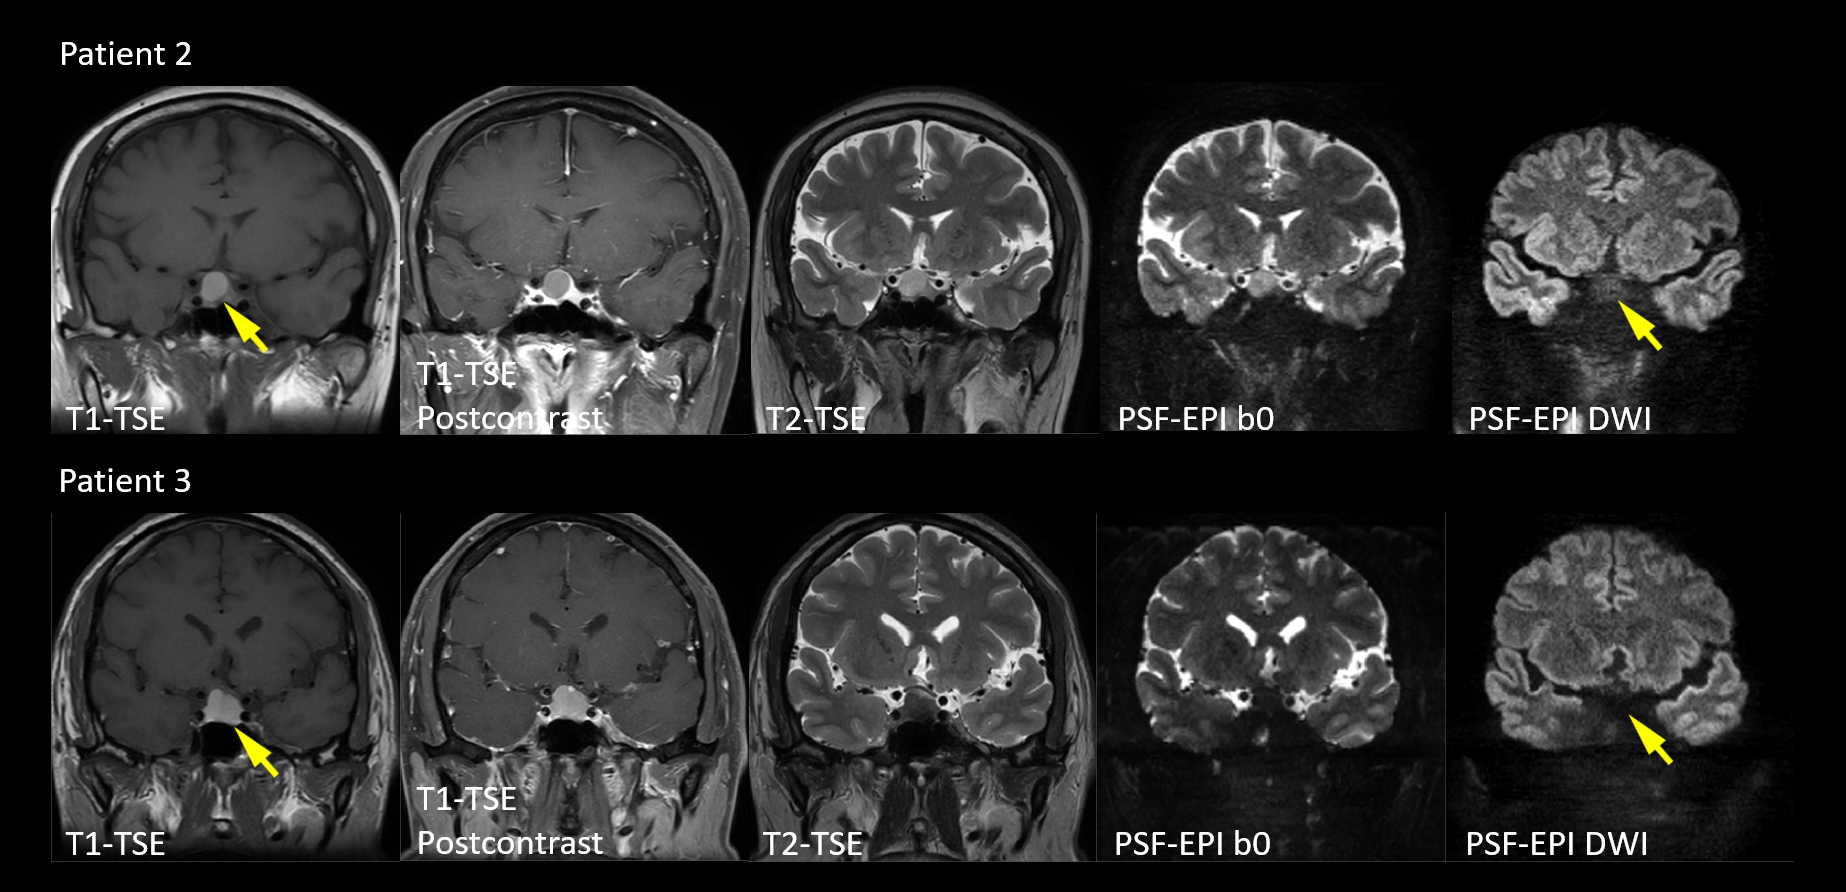
Fig. 3 shows the images of patients 2 and 3. No enhancement was found in both patients. Therefore, they were diagnosed with RCCs with sizes of 17.3 mm and 12.8 mm, respectively. Surgical findings agreed with the diagnosis. Although the RCCs of the two patients show various intensity in T1-TSE and T2-TSE, both of them manifest as hypointense in the DWI images, which accords well with the previous research 7.
Two kinds of lesions included in this study show different features in DWI, which indicate the potential of PSF-EPI to differentiate between PAs and RCCs without using contrast agent.
Conclusion
PSF-EPI can achieve distortion-free DWI of lesions in the pituitary. According to the results, PAs and RCCs may be distinguishable using PSF-EPI. Moreover, PSF-EPI can acquire high-resolution DWI and reduce the partial volume effect, which may improve the accuracy of the analysis of microadenomas with a small size. It may serve as an efficient tool for the preoperative diagnosis of pituitary lesions. To prove this idea, acquisitions of more patients and quantitative analysis are required in future research.Acknowledgements
References
1. Famini P, Maya MM, Melmed S. Pituitary magnetic resonance imaging for sellar and parasellar masses: ten-year experience in 2598 patients. The Journal of Clinical Endocrinology & Metabolism 2011;96(6):1633-1641.
2. Barker FG, Klibanski A, Swearingen B. Transsphenoidal surgery for pituitary tumors in the United States, 1996–2000: mortality, morbidity, and the effects of hospital and surgeon volume. The Journal of Clinical Endocrinology & Metabolism 2003;88(10):4709-4719.
3. Buchfelder M, Schlaffer S. Surgical treatment of pituitary tumours. Best Practice & Research Clinical Endocrinology & Metabolism 2009;23(5):677-692.
4. Kuan EC, Yoo F, Chyu J, Bergsneider M, Wang MB. Treatment outcomes of Rathke's cleft cysts managed with marsupialization. Journal of Neurological Surgery Part B: Skull Base 2017;78(02):112-115.
5. Park M, Lee S-K, Choi J, et al. Differentiation between cystic pituitary adenomas and Rathke cleft cysts: a diagnostic model using MRI. American Journal of Neuroradiology 2015;36(10):1866-1873.
6. Rennert J, Doerfler A. Imaging of sellar and parasellar lesions. Clinical Neurology and Neurosurgery 2007;109(2):111-124.
7. Kunii N, Abe T, Kawamo M, Tanioka D, Izumiyama H, Moritani T. Rathke’s cleft cysts: differentiation from other cystic lesions in the pituitary fossa by use of single-shot fast spin-echo diffusion-weighted MR imaging. Acta neurochirurgica 2007;149(8):759-769.
8. Hiwatashi A, Yoshiura T, Togao O, et al. Evaluation of diffusivity in the anterior lobe of the pituitary gland: 3D turbo field echo with diffusion-sensitized driven-equilibrium preparation. American Journal of Neuroradiology 2014;35(1):95-98.
9. Mahmoud OM, Tominaga A, Amatya VJ, et al. Role of PROPELLER diffusion-weighted imaging and apparent diffusion coefficient in the evaluation of pituitary adenomas. European journal of radiology 2011;80(2):412-417.
10. Wang M, Liu H, Wei X, et al. Application of Reduced-FOV Diffusion-Weighted Imaging in Evaluation of Normal Pituitary Glands and Pituitary Macroadenomas. American Journal of Neuroradiology 2018;39(8):1499-1504.
11. Suzuki C, Maeda M, Hori K, et al. Apparent diffusion coefficient of pituitary macroadenoma evaluated with line-scan diffusion-weighted imaging. Journal of neuroradiology 2007;34(4):228-235.
12. Zeng H, Constable RT. Image distortion correction in EPI: Comparison of field mapping with point spread function mapping. Magnetic Resonance in Medicine 2002;48(1):137-146.
13. Zaitsev M, Hennig J, Speck O. Point spread function mapping with parallel imaging techniques and high acceleration factors: Fast, robust, and flexible method for echo-planar imaging distortion correction. Magnetic Resonance in Medicine 2004;52(5):1156-1166.
14. Robson MD, Gore JC, Constable RT. Measurement of the point spread function in MRI using constant time imaging. Magnetic Resonance in Medicine 1997;38(5):733-740.
15. Oh S-H, Chung J-Y, In M-H, et al. Distortion correction in EPI at ultra-high-field MRI using PSF mapping with optimal combination of shift detection dimension. Magnetic Resonance in Medicine 2012;68(4):1239-1246.
16. In M-H, Posnansky O, Speck O. High-resolution distortion-free diffusion imaging using hybrid spin-warp and echo-planar PSF-encoding approach. NeuroImage 2017;148:20-30.
17. In M-H, Posnansky O, Speck O. PSF mapping-based correction of eddy-current-induced distortions in diffusion-weighted echo-planar imaging. Magnetic Resonance in Medicine 2016;75(5):2055-2063.
18. In M-H, Posnansky O, Beall EB, Lowe MJ, Speck O. Distortion Correction in EPI Using an Extended PSF Method with a Reversed Phase Gradient Approach. PLOS ONE 2015;10(2):e0116320.
19. Dong Z, Wang F, Reese TG, et al. Tilted-CAIPI for highly accelerated distortion-free EPI with point spread function (PSF) encoding. Magnetic Resonance in Medicine 2018;0(0).
Figures