4529
Evaluating advanced multi-shell diffusion MRI microstructural biomarkers of Alzheimer’s disease1USC Imaging Genetics Center, University of Southern California, Los Angeles, CA, United States, 2USC Stevens Neuroimaging and Informatics Institute, University of Southern California, Marina del Rey, CA, United States, 3USC Imaging Genetics Center, University of Southern California, Marina del Rey, CA, United States, 4Therapanacea, Paris, France, 5Athena Project Team, Inria Sophia-Antipolis Méditerranée, Université Côte d'Azur, Nice, France
Synopsis
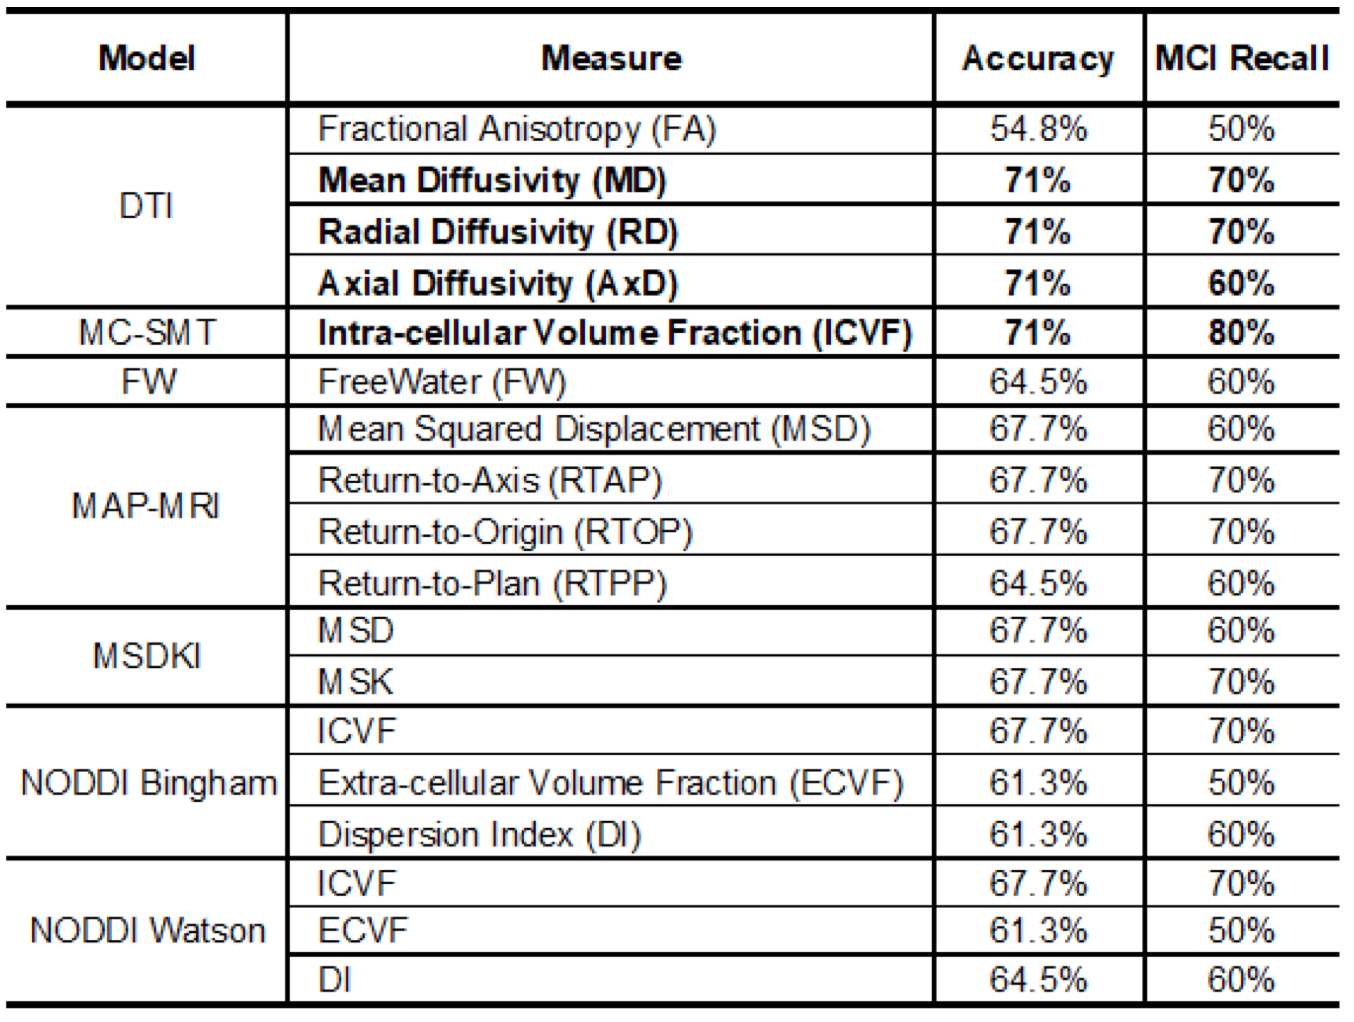
To identify microstructure-based biomarkers sensitive to cognitive impairment, we used ADNI-3 multi-shell dMRI data to estimate 18 measures from seven dMRI models and assessed their ability to predict mild cognitive impairment (MCI). For each measure, we used TV-L1 regularized logistic regression to find cohesive clusters of brain tissue that contribute to correct classification. We found that tensor-based (DTI) diffusivity and multi-compartment spherical mean technique (MC-SMT) measures showed the highest prediction accuracy, but differential anatomical distributions of classifying voxels. MC-SMT may offer greater sensitivity and specificity to MCI than DTI as MC-SMT resulted in the highest recall and fewest classifying voxels.
Introduction
In an effort to identify tissue microstructure-based biomarkers that are sensitive to the progression of Alzheimer’s disease (AD), the Alzheimer’s Disease Neuroimaging Initiative (ADNI-3) recently introduced multi-shell diffusion MRI (dMRI) protocols1. Many dMRI models have been proposed over the last two decades that may offer greater specificity about tissue microstructure than the single-shell diffusion tensor model (DTI). The ability of these novel measures to characterize pathological changes in brain microstructure associated with cognitive impairment is not yet clear. Here, we used the new ADNI-3 dataset to evaluate seven different dMRI models (both multi-compartment and diffusion-propagator based models) to identify 1) which of 18 dMRI-derived scalar measures best classify individuals with mild cognitive impairment (MCI) versus controls, and, 2) which of the measures that classify sufficiently well give unique information about microstructural changes not captured by other measures.Methods
Data downloaded from the ADNI database included 31 participants with MCI (mean age: 75.6±7.8yrs, 22M/9F) and 64 cognitively normal individuals (CN; mean age: 74±7.1yrs; 25M/39F). Siemens Prisma 3T multi-shell dMRI data included 13 b0 images, 48 b=1000, 6 b=500, and 60 b=2000 s/mm2 diffusion weighted images (voxel size: 2mm3, TE=71ms; TR=3300ms, δ=13.6ms, Δ=35ms). After dMRI were corrected for eddy, motion, and EPI distortions, we used DMIPY2 to fit six multi-compartment models: Neurite Orientation Dispersion Density Imaging (NODDI) with either Watson or Bingham distributions3,4, and the Multi-Compartment Spherical Mean Technique (MC-SMT)5. We also used DIPY6 to fit DTI, the ‘freewater’ component (FW)7 and diffusion-propagator based models including the Mean Apparent Propagator (MAP-MRI)8 and Diffusion Kurtosis (DKI)9. Using ANTs10, we created a multichannel minimal deformation template in the IIT template space, and warped all 18 resulting dMRI scalar maps (Table 1) to the template using a multi-channel registration. We ran a logistic regression with TV-L1 regularization across all voxels to classify individuals as MCI or CN (Training/Test: 66.7/33.3%)11. A classification accuracy > 70% was used to benchmark dMRI measures with meaningful associations with diagnosis. From that subset of dMRI measures, we compared the Hamming similarity coefficient from the resulting logistic weights to identify which dMRI measures gave similar information in similar regions and which offered unique information about underlying pathological changes.Results
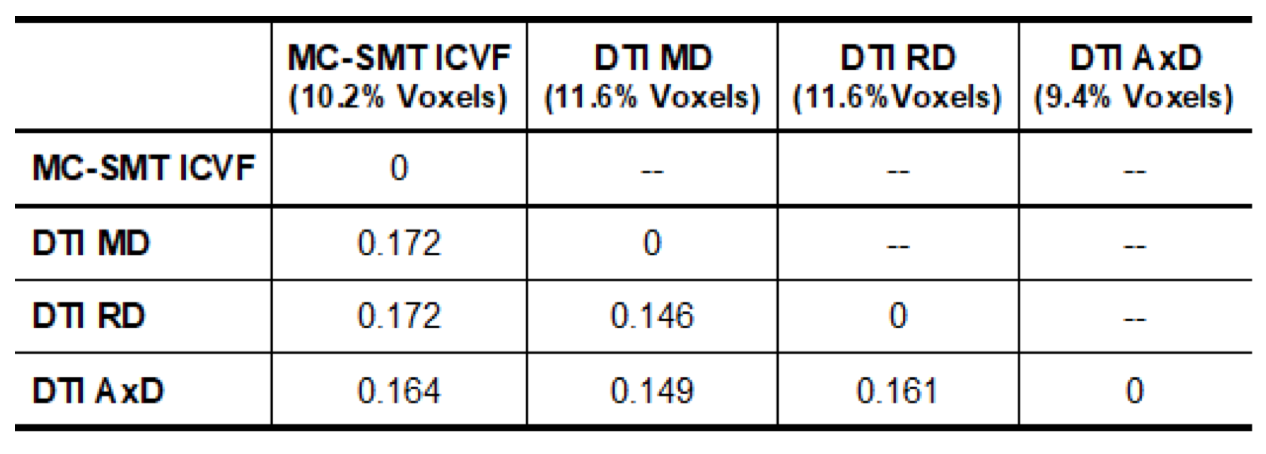
A classification accuracy above 70% was detected only with DTI-derived MD, RD and AD, and MC-SMT ICVF; of these, MC-SMT ICVF showed the largest recall for MCI (Table 1). When comparing the anatomical distribution of weights across these four measures, the resulting MC-SMT classifying map was the least similar to DTI MD and RD (i.e., highest Hamming distance; Table 2). The anatomical distributions of predictive region are shown in Figure 1.Discussion
Remarkably, we found that the simpler DTI diffusivity measures were among the best predictors of cognitive impairment. Nonetheless, multi-compartment SMT measures may offer greater sensitivity and specificity to MCI than DTI as MC-SMT ICVF resulted in both higher recall and fewer classifying voxels. Moreover, differences in the anatomical distributions suggest that each of these models may differentially capture underlying microstructural abnormalities. For example, in the left temporal lobe, MD and RD showed the highest odds in the gray matter, whereas MC-SMT ICVF captured more abnormalities in the central white matter. Additionally, MC-SMT yielded higher odds in regions with major crossing fibers (i.e., corona radiata). DTI is limited in regions with crossing fibers, but the Spherical Mean Technique retains the fiber crossings and dispersion information in the FOD and uses a spherical convolution kernel to disentangle this information from compartmental estimates. This may also explain better MC-SMT classification relative to any of the other NODDI models, which must fit numerous additional parameters to capture dispersion. Ultimately, future work should aim to replicate these preliminary trends in larger samples.Acknowledgements
Funded by NIH grants U54 EB020403, P41 EB015922, U01AG024904, R56AG058854, and T32AG058507. This work also received funding from the European Research Council (ERC) under the European Union’s Horizon 2020 research and innovation program (ERC Advanced Grant agreement No 694665: CoBCoM - Computational Brain Connectivity Mapping).References
1)Reid RI, et al. Alzheimer’s Dement. 13:1075–1076 (2017).
2)Fick R, et al. Frontiers in Neuroinformatics.13:64 (2019).
3)Zhang H, et al. NeuroImage 61:1000-1016(2012).
4)Tariq M, et al. NeuroImage 133:207-223(2016).
5)Kaden E, et al. NeuroImage 139:346–359(2016)
6)Garyfallidis E, et al. Frontiers in Neuroinformatics 8:8(2014)
7)Pasternak O, et al. Magn. Reson. Med. 62;3:717-30(2009)
8)Fick R, et al. NeuroImage 134:365-385(2016)
9)Neto HR, et al. NeuroImage 111:85-99(2015)
10)Avants B, et al. NeuroImage, 54: 2033-44(2011).
11)https://nilearn.github.io/.
Figures