4528
Differentiating Low- and High-Grade Adult glioma Using Multi-diffusion Models1Institute of Science and Technology for Brain-Inspired Intelligence, Fudan University, Shanghai, China, 2Human Phenome Institute, Fudan University, Shanghai, China, 3Radiology, Huashan Hospital, Fudan University, Shanghai, China
Synopsis
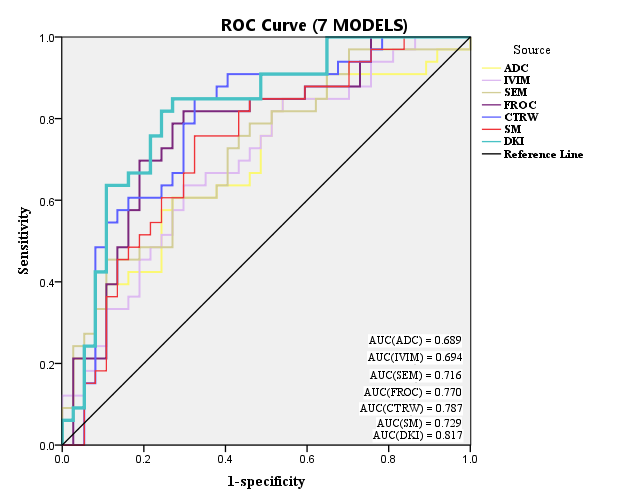
To offer a potential multiparameter-mapping platform for clinical pathological diagnosis using multi-diffusion models including mono-exponentional model, IVIM, SEM, FROC, CTRW, SM and DKI. The U-test and ROC analysis show the superiority of FROC, CTRW and DKI models in diagnostic accuracy for grading brain tumors (at 0.770, 0.780 and 0.817 respectively).
Introduction
Over the past few decades, several treatment strategies have been developed to manage the brain tumors, such as surgical resection, chemotherapy etc. And these strategies are chosen to depend on many aspects of the lesion, particularly, the tumor type and grade. Therefore it is important to differentiate low and high grade in brain tumor efficiently. However, the overlapping signal characteristics in conventional MRI makes it difficult to grading the brain tumor. Meanwhile, several non-Gaussian diffusion models for DWI including mono-exponentional model(ADC)1, Intravoxel Incoherent Motion(IVIM)2, Stretched-exponential Model(SEM)3, Fractional Order Calculus Model(FROC)4, Continuous-Time Random-Walk Model(CTRW)5, Statistical Model(SM) 6 and Diffusional Kurtosis Imaging (DKI) 7, have been developed to reveal the underlying tissue structures and environment. But there are still limited studies in differential diagnosis for low- and high-grade adult glioma using multiple diffusion models. In this study, we aim to improve diagnostic accuracy and efficiency by developing a platform for 7 diffusion imaging models with multiple and high b-values applied in. Furthermore, we also aim to differentiate High- and Low-Grade adults brain tumors using each model and make comparison about diagnostic accuracy, sensitivity and specificity.Methods
70 adults (33 cases are confirmed as high-grade glioma and 37 are low-grade from HuaShan Hospital) underwent diffusion MRI scans at 3T with 22 b-values (0-5000 ). The DWI signals were fitted with 7 models and values from respective parameter were also extracted. First, image reconstruction of whole brain was realized, and then the tumor parenchyma was focused as region of interest. The ROI was first drawn on T2w-flair image with the aid of T1w-enhanced image. For image reconstruction we use mono-exponentional model described as Eq.1: $$$S = S_0exp(-bADC)$$$ to calculate ADC. Then the IVIM model was described as Eq.2: $$$S = S_0[fexp(-bD_f)+(1-f)exp(-bD_s)]$$$. The SEM model realized by Eq.3: $$$S = S_0exp[-(b\times DDC)^{\alpha}]$$$. And we use Eq.4: $$$S = S_0exp[-D\mu^{2(\beta_f-1)}(b/(\Delta -\delta /3))^{\beta _f}(\Delta - ((2\beta_f-1)/(2\beta_f+1))\delta)]$$$ and Eq.5: $$$S = S_0E_{\alpha_c}(-(bD_m)^{\beta_c})$$$represented in Mittag-Leffler Function to describe FROC and CTRW respectively. The last two models are SM, described as Eq.6: $$$S = S_0exp(-bADC_S+(1/2)\theta^2b^2)$$$ and DKI, described as Eq.7: $$$S = S_0exp(-bD_K+(1/6)b^2D_K^2K)$$$. Parameters of IVIM, SEM, FROC and CTRW models were estimated by fitting Eq.2, Eq.3, Eq.4, Eq.5 separately to the acquired b values on a voxel-by-voxel basis, applying Levenberg-Marquardt methods. While the other models were fitting by linear fitting method. The sensitivity, specificity and diagnostic accuracy of each parameter in single or jointly by logistic regression as model fitted above for tumor grading were determined by mann-whitney U-test and ROC analysis.Results
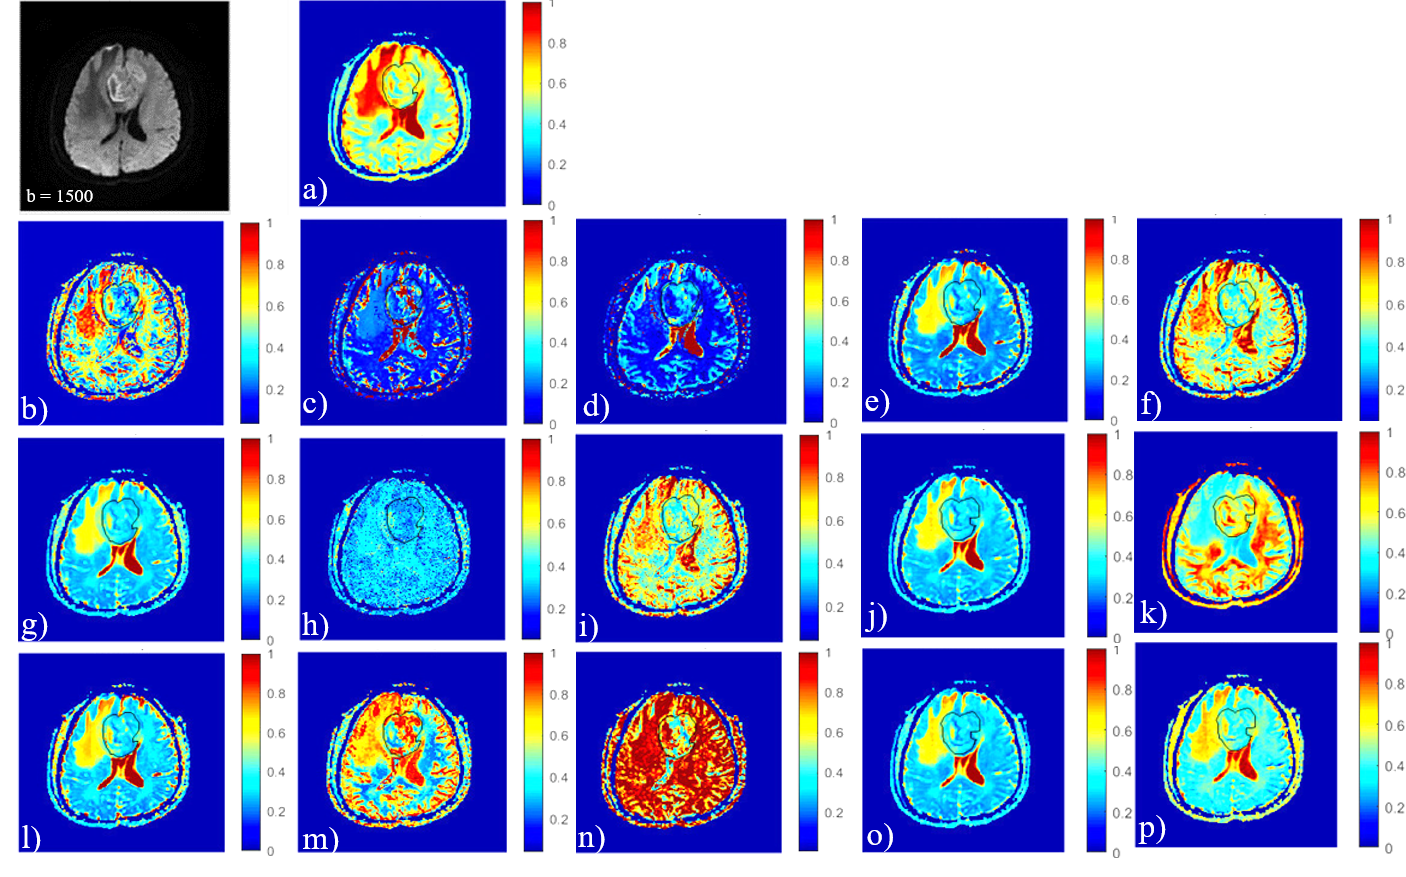
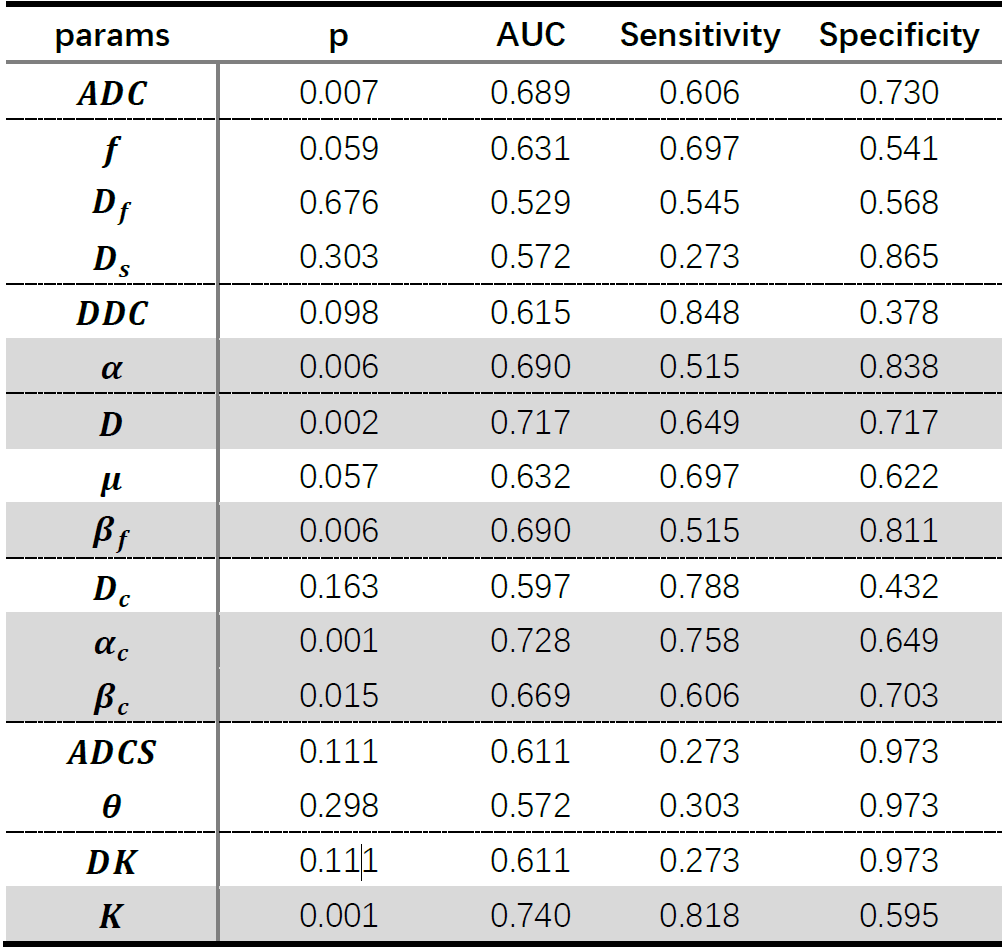
In the process of model building, appropriate initial values of the parameters, derived from the characteristics of biological tissue and mathematical theory, were used to optimize the algorithm. To improve the accuracy and reliability of the algorithm, reasonable quantitative mappings were obtained, shown as Fig. 1. Among the 16 parameters, parameters with significant differences in high- and low-grade brain tumors were ADC, $$$\alpha$$$from the SEM model, $$$D$$$ and $$$\beta_f$$$ from the FROC model, $$$\alpha_c$$$ and $$$\beta_c$$$ from the CTRW model, and $$$K$$$ from the DKI model, where was the best one. The three parameters with the highest AUC values were $$$D$$$ (0.717), $$$\alpha_c$$$ (0.728) and $$$K$$$(0.740), which were detailed in Tabel.1. The ROC curve analysis results of the seven models were as follows (Fig.2): the areas under the curve of IVIM model, SEM model, FROC model, CTRW model, SM model and DKI model were all larger than that of the traditional single exponential model ADC (0.689).The three models of highest diagnostic accuracy were FROC model (0.770), CTRW model (0.780) and DKI model (0.817), among which DKI had the best performance. All these three models had high diagnostic sensitivity (0.818, 0.848, 0.848 VS ADC diagnostic sensitivity 0.606).Discussion
In this study, we have compared different models in feasibility to differentiate low- and high-grade adults brain tumors. It was shown that FROC, CTRW and DKI models and some of individual parameters of each model display a high performance. For clinical application, it still needs more comprehensive analysis for direct correlation between CTRW and FROC parameters and tissue structure. Besides, We are expecting these advantage DWI models can be broadly applied for characterizing healthy and pathologic tissues in other fields such as breast cancer.Conclusion
We have developed a multi-DWI model platform for adult glioma diagnosis, which has profound significance in broader application in other tissue diseases clinical diagnosis. More importantly, we have demonstrated that FROC model, CTRW model and DKI model provides a set of novel diffusion parameters that can improve differentiation of low and high adult glioma with relatively high accuracy and sensitivity (0.818, 0.848, 0.848).Acknowledgements
This work was supported by Shanghai Municipal Science and Technology Major Project (No.2017SHZDZX01), Shanghai Municipal Science and Technology Major Project (No.2018SHZDZX01) and ZJLab, Shanghai Natural Science Foundation (No. 17ZR1401600) and the National Natural Science Foundation of China (No. 81971583).References
1. Chilla GS, Tan CH, Xu C, Poh CL. Diffusion weighted magnetic resonance imaging and its recent trend-a survey. Quant Imaging Med Surg. 2015;5:407-22.
2. Bihan DL, Breton E, Lallemand D, Aubin ML, Vignaud J, Laval-Jeantet M. Separation of diffusion and perfusion in intravoxel incoherent motion MR imaging. 1988;168:497-505.
3. Bennett KM, Schmainda KM, Bennett R, Rowe DB, Lu HB, Hyde JS. Characterization of continuously distributed cortical water diffusion rates with a stretched-exponential model. Magnet Reson Med. 2003;50:727-34.
4. Sui Y, Wang H, Liu G, Damen FW, Wanamaker C, Li Y, et al. Differentiation of Low- and High-Grade Pediatric Brain Tumors with High b-Value Diffusion-weighted MR Imaging and a Fractional Order Calculus Model. Radiology. 2015;277:489-96.
5. Karaman MM, Sui Y, Wang H, Magin RL, Li Y, Zhou XJ. Differentiating low- and high-grade pediatric brain tumors using a continuous-time random-walk diffusion model at high b-values. Magn Reson Med. 2016;76:1149-57.
6. Yablonskiy DA, Bretthorst GL, Ackerman JJ. Statistical model for diffusion attenuated MR signal. Magn Reson Med. 2003;50:664-9.
7. Jensen JH, Helpern JA, Ramani A, Lu HZ, Kaczynski K. Diffusional kurtosis imaging: The quantification of non-Gaussian water diffusion by means of magnetic resonance imaging. Magnet Reson Med. 2005;53:1432-40.
Figures